# How to Export Azure Monitor Metrics using OpenTelemetry to OpenObserve
> Collect and export Azure Monitor metrics to OpenObserve using the OpenTelemetry Collector. Build real-time dashboards, query metrics, and set up SQL-based alerts for Azure VMs, AKS, and other resources.
Source: https://openobserve.ai/blog/azure-monitor-metrics/
Published: 2025-11-20
Authors: Simran Kumari
Category: How To
Tags: Microsoft, Metrics
---
Using the OpenTelemetry Collector, you can collect metrics from Azure Monitor and export them directly to **OpenObserve**, an OpenTelemetry-native observability platform. Azure Monitor is great at capturing infrastructure and application-level metrics, but the data often stays siloed inside Azure.
This limits your ability to correlate metrics with logs, traces, and other signals across your broader environment.
This is where **OpenObserve** becomes extremely powerful. With OpenObserve’s OpenTelemetry-native ingestion, SQL/PromQL queries, and real-time dashboards, you can bring Azure Monitor metrics into a unified analytics layer, without paying for expensive proprietary pipelines.
*If you want to jump straight into implementation, start at the Prerequisites section.*
## Understanding Azure Monitor Metrics
Azure Monitor can collect metrics from a wide set of Azure and hybrid environments. These metrics give deep visibility inside Azure, but the challenge is **correlation**. If your logs, traces, and external infrastructure live outside Azure , insights are incomplete.
Exporting metrics into OpenObserve solves this.
## Why Export Azure Monitor Metrics?
Exporting metrics out of Azure Monitor enables:
* **A single observability backend:** Correlate Azure metrics with logs, traces, events, and Prometheus data inside OpenObserve.
* **Cost-efficient, vendor-neutral telemetry:** OpenObserve stores data on object storage, drastically reducing cost vs. Azure Monitor / App Insights.
* **Real-time dashboards built on SQL:** Plot, aggregate, and compare Azure metrics alongside Kubernetes, services, and edge workload data.
* **Unified alerting:** OpenObserve lets you trigger alerts using SQL , perfect for Azure infra + app SLOs.
## A Quick Overview of OpenTelemetry
OpenTelemetry (OTel) is the open standard for collecting logs, metrics, and traces.It provides:
* Vendor-agnostic telemetry
* Standardized SDKs and APIs
* Universal data format (OTLP)
* Rich ecosystem of receivers + exporters
You will use the OpenTelemetry Collector to extract metrics from Azure Monitor and push them into OpenObserve.
## What is the OpenTelemetry Collector?
A standalone service that:
* Receives telemetry (OTLP, Azure Monitor, Prometheus, Fluent Bit, etc.)
* Processes and transforms data
* Exports data to backends like OpenObserve
It supports dozens of receivers, including the **azuremonitor receiver** used in this integration. The Azure Monitor receiver in OpenTelemetry Collector only supports metrics. For logs or events, consider using [Diagnostic Settings → Event Hub and configure OpenTelemetry Collector](https://openobserve.ai/blog/monitor-azure-resources-eventhubreceiver/) accordingly.
Example receiver:
```
receivers:
otlp:
protocols:
grpc:
http:
```
## Step-by-Step Setup
Here’s the high-level flow of how Azure Monitor metrics reach OpenObserve:
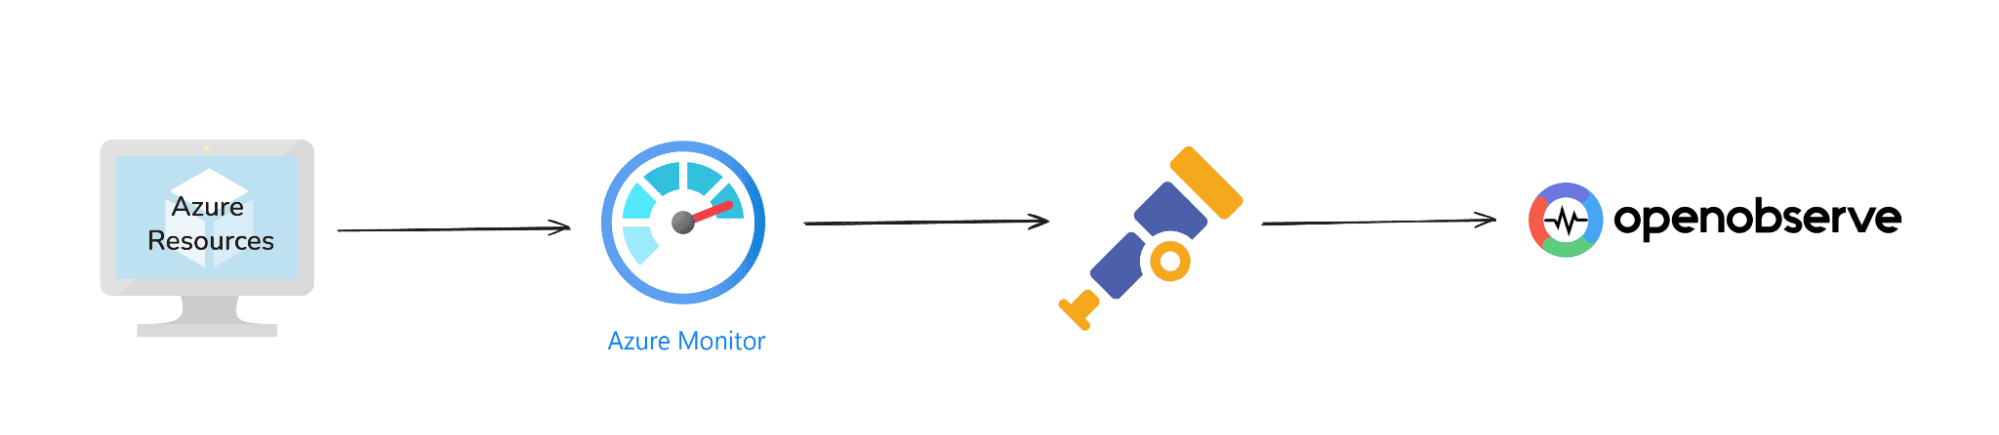
* **Azure Resources** : Your VMs, AKS nodes, databases, etc., generate metrics.
* **Azure Monitor** : Collects metrics by default; you can enable **Diagnostic Settings** for additional/custom metrics.
* **OpenTelemetry Collector** : Pulls metrics from Azure Monitor using the **Azure Monitor receiver**.
* **OpenObserve** :Receives telemetry via OTLP, stores it, allows you to query, visualize, and alert on it.
### Prerequisites
Before starting, ensure you have:
* An azure account
* Azure Monitor configured to receive metrics from Resources
* An **[OpenObserve Cloud](https://cloud.openobserve.ai/web/)** account (or [self-hosted instance](https://openobserve.ai/downloads/))
*Note: Azure Monitor automatically collects standard metrics from most Azure resources. For additional or custom metrics/logs, you can enable Diagnostic Settings. Make sure the account or identity used to pull metrics has Reader access to the relevant resources.*
### 1. Setting Up OpenObserve
You need a backend to receive and visualize the telemetry.
#### Option 1: OpenObserve Cloud (recommended)
Easiest way to start: fully managed ingestion + storage + dashboards. Create a free account at [https://cloud.openobserve.ai/](https://cloud.openobserve.ai/) .
#### Option 2: Self-host OpenObserve
Supports Kubernetes, Docker Compose, or binary installation. Docs: *[OpenObserve Installation Guide](https://openobserve.ai/docs/getting-started/)*
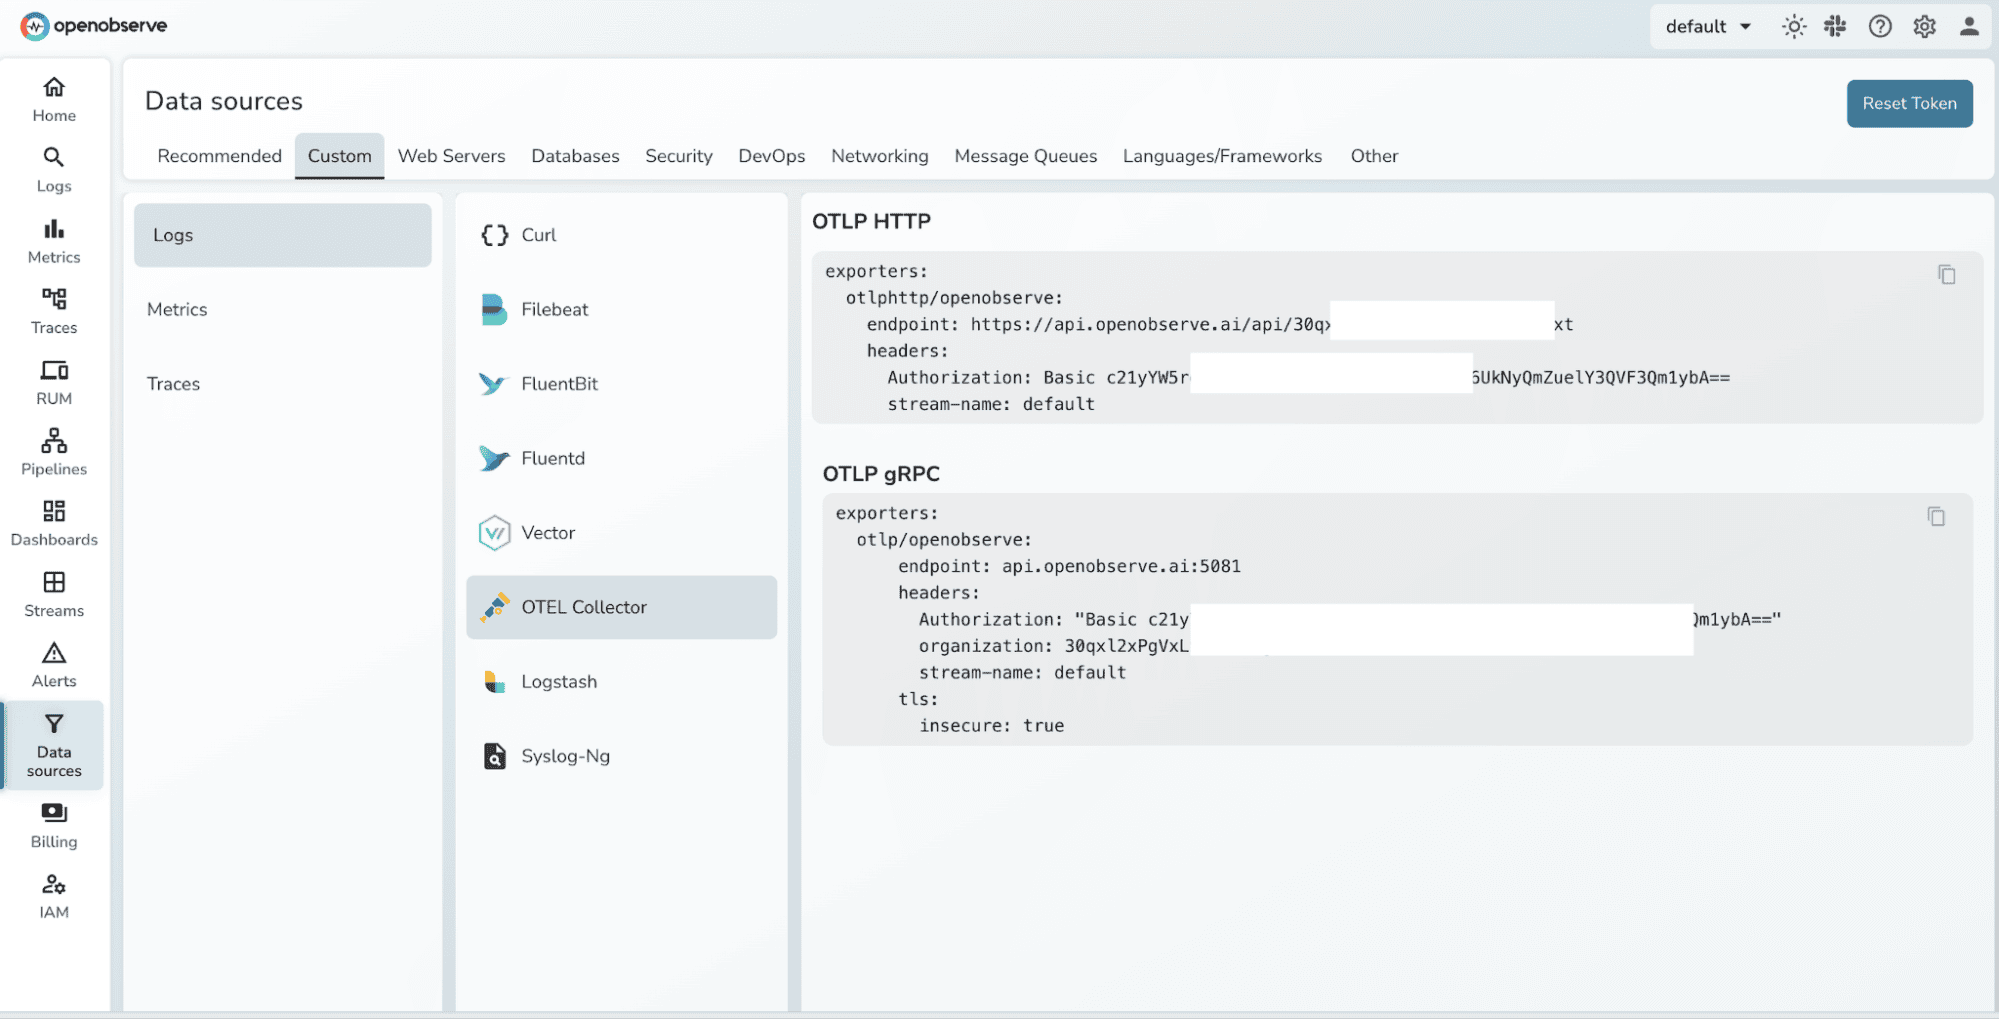
Once set up, you will use the **OTLP / ingestion endpoint**: `https:///api/`
You will also need your **organization ID** and **API ingestion token** from your OpenObserve console.
### 2. Create an Azure Service Principal
A Service Principal is an identity in Azure Active Directory (AAD) that can be used by applications or scripts.
* Log in to Azure: `az login`
* Create a Service Principal: You can create one scoped to the subscription:
```
az ad sp create-for-rbac \
--name "" \
--role Reader \
--scopes /subscriptions/
```
* `` → name of your SP (e.g., `otel-collector-sp`)
* `` → your Azure subscription ID
**Output example:**
```
{
"appId": "xxxx-xxxx-xxxx-xxxx",
"displayName": "otel-collector-sp",
"password": "xxxx-xxxx-xxxx-xxxx",
"tenant": "xxxx-xxxx-xxxx-xxxx"
}
```
These values map directly to your **OpenTelemetry Collector YAML**:
```
receivers:
azuremonitor:
subscription_id: ""
tenant_id: "" # tenant
client_id: "" # appId
client_secret: "" # password
```
### 3. Run Otel Collector
You need the OTel Collector to pull the data from Azure Monitor and push it to OpenObserve. You can run the collector anywhere: locally, on an Azure VM, or inside a container, as long as it can reach the Event Hub.
*It’s recommended to use containers for production scale environments.*
**1\. Download the Collector (Binary)**
For Linux/Ubuntu:
```
# Download latest contrib build
wget https://github.com/open-telemetry/opentelemetry-collector-releases/releases/latest/download/otelcol-contrib-linux-amd64.tar.gz
# Extract
tar -xvzf otelcol-contrib-linux-amd64.tar.gz
cd otelcol-contrib
```
This gives you the `otelcol-contrib` binary you can run directly.
**Note:** Use the **contrib** build, the regular OTel Collector doesn’t support these receivers.
2\. Create a configuration file `azure-to-o2.yaml`**:**
```
receivers:
azuremonitor:
subscription_id: ""
tenant_id: ""
client_id: "" # if using Service Principal
client_secret: ""
resource_groups: [""]
collection_interval: 60s
exporters:
otlphttp/openobserve:
endpoint: "https://api.openobserve.ai/api/"
headers:
Authorization: "Bearer "
service:
pipelines:
metrics:
receivers: [azuremonitor]
exporters: [otlphttp]
```
3\. Run the otel-collector :
```
./otelcol-contrib --config azure-to-o2.yaml
```

### 4. Verify Metrics in OpenObserve
Once your **OpenTelemetry Collector** is running and sending Azure Monitor metrics, you can confirm that the data is reaching OpenObserve.
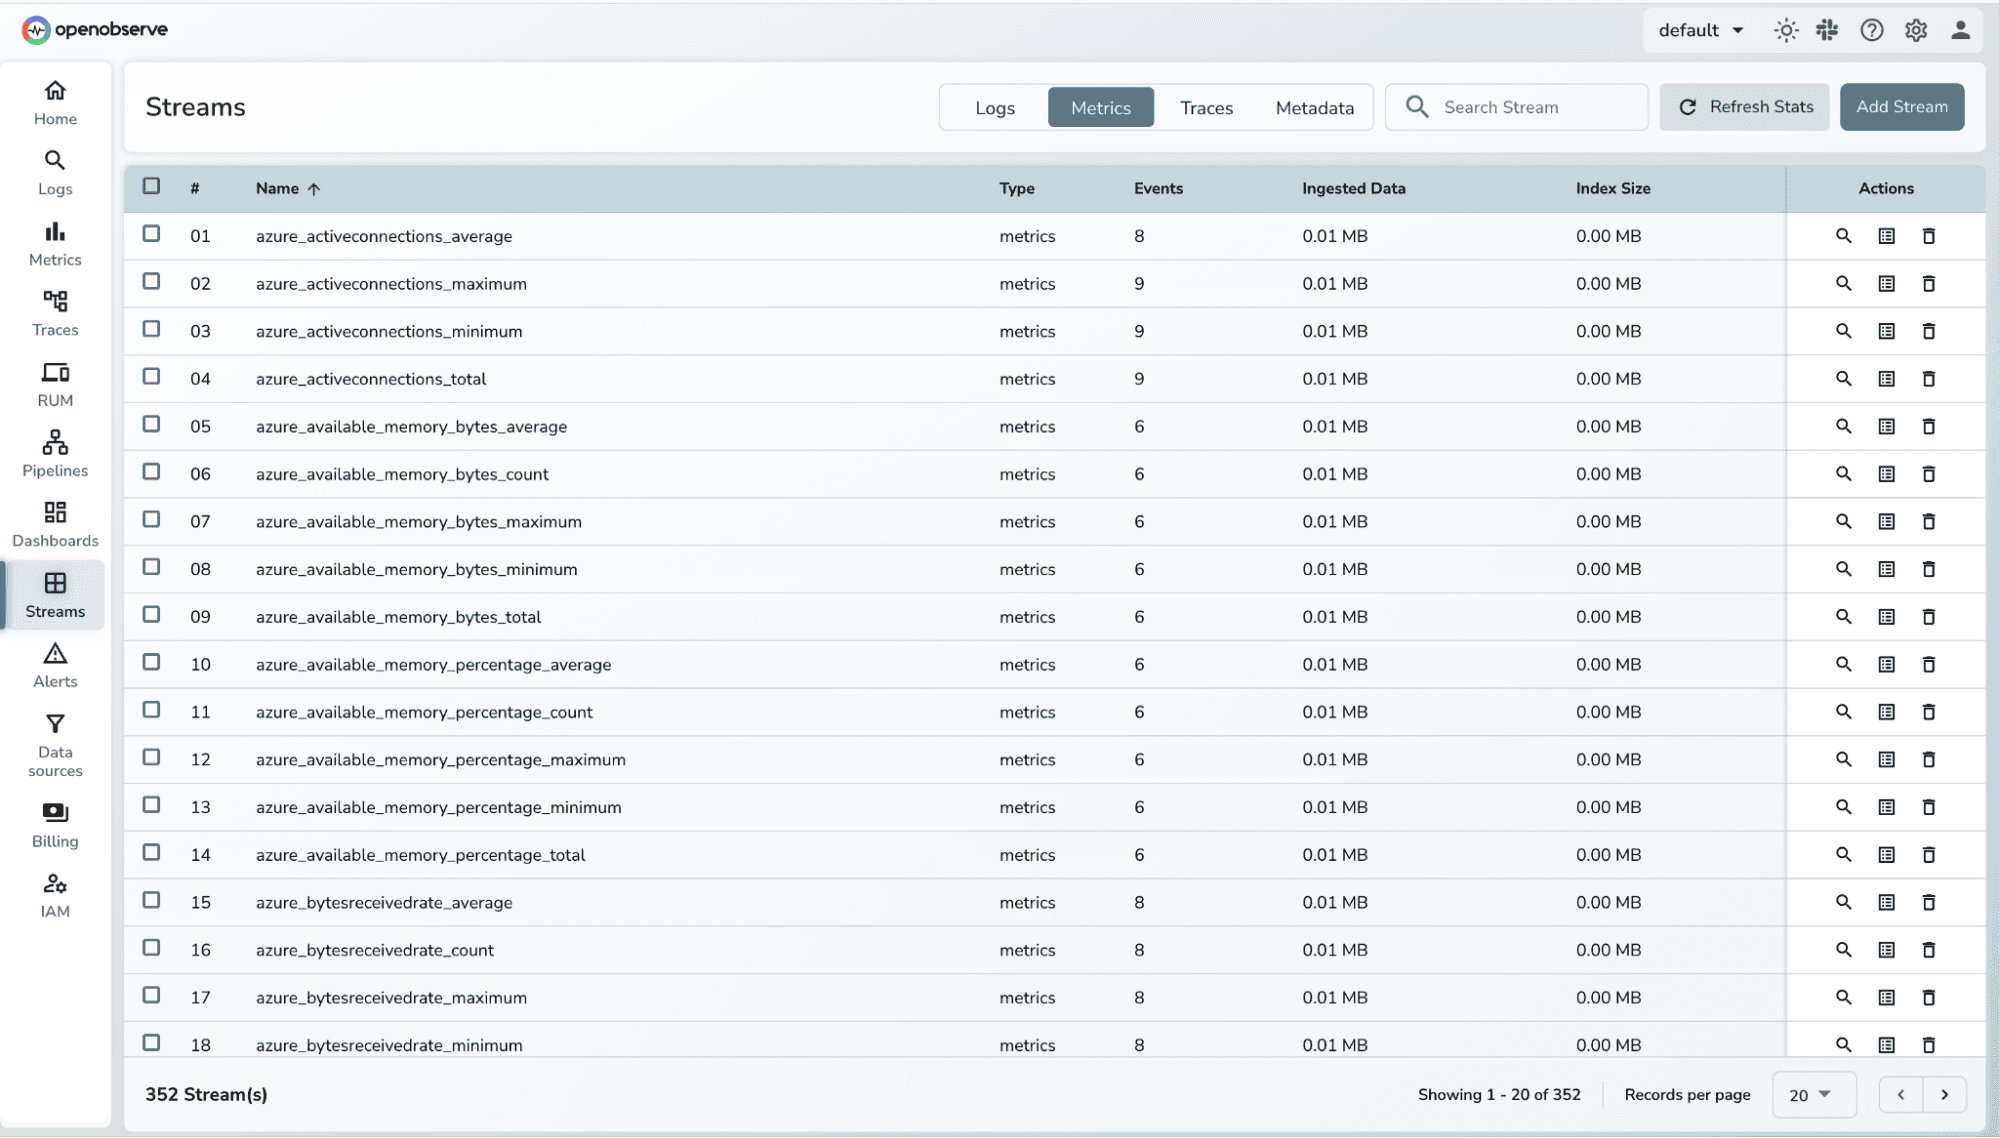
* Navigate to **OpenObserve → Streams**.
* In the **Metrics section**, you will see a list of metrics coming from Azure Monitor.Most metrics will have an **Azure-specific tag**, usually starting with `azure_` (e.g., `azure_vm_cpu_percent`, `azure_k8s_pod_count`).
* Click on any metric to **explore events recorded** for that metric. You can see the timestamps, values, and any associated metadata or tags.
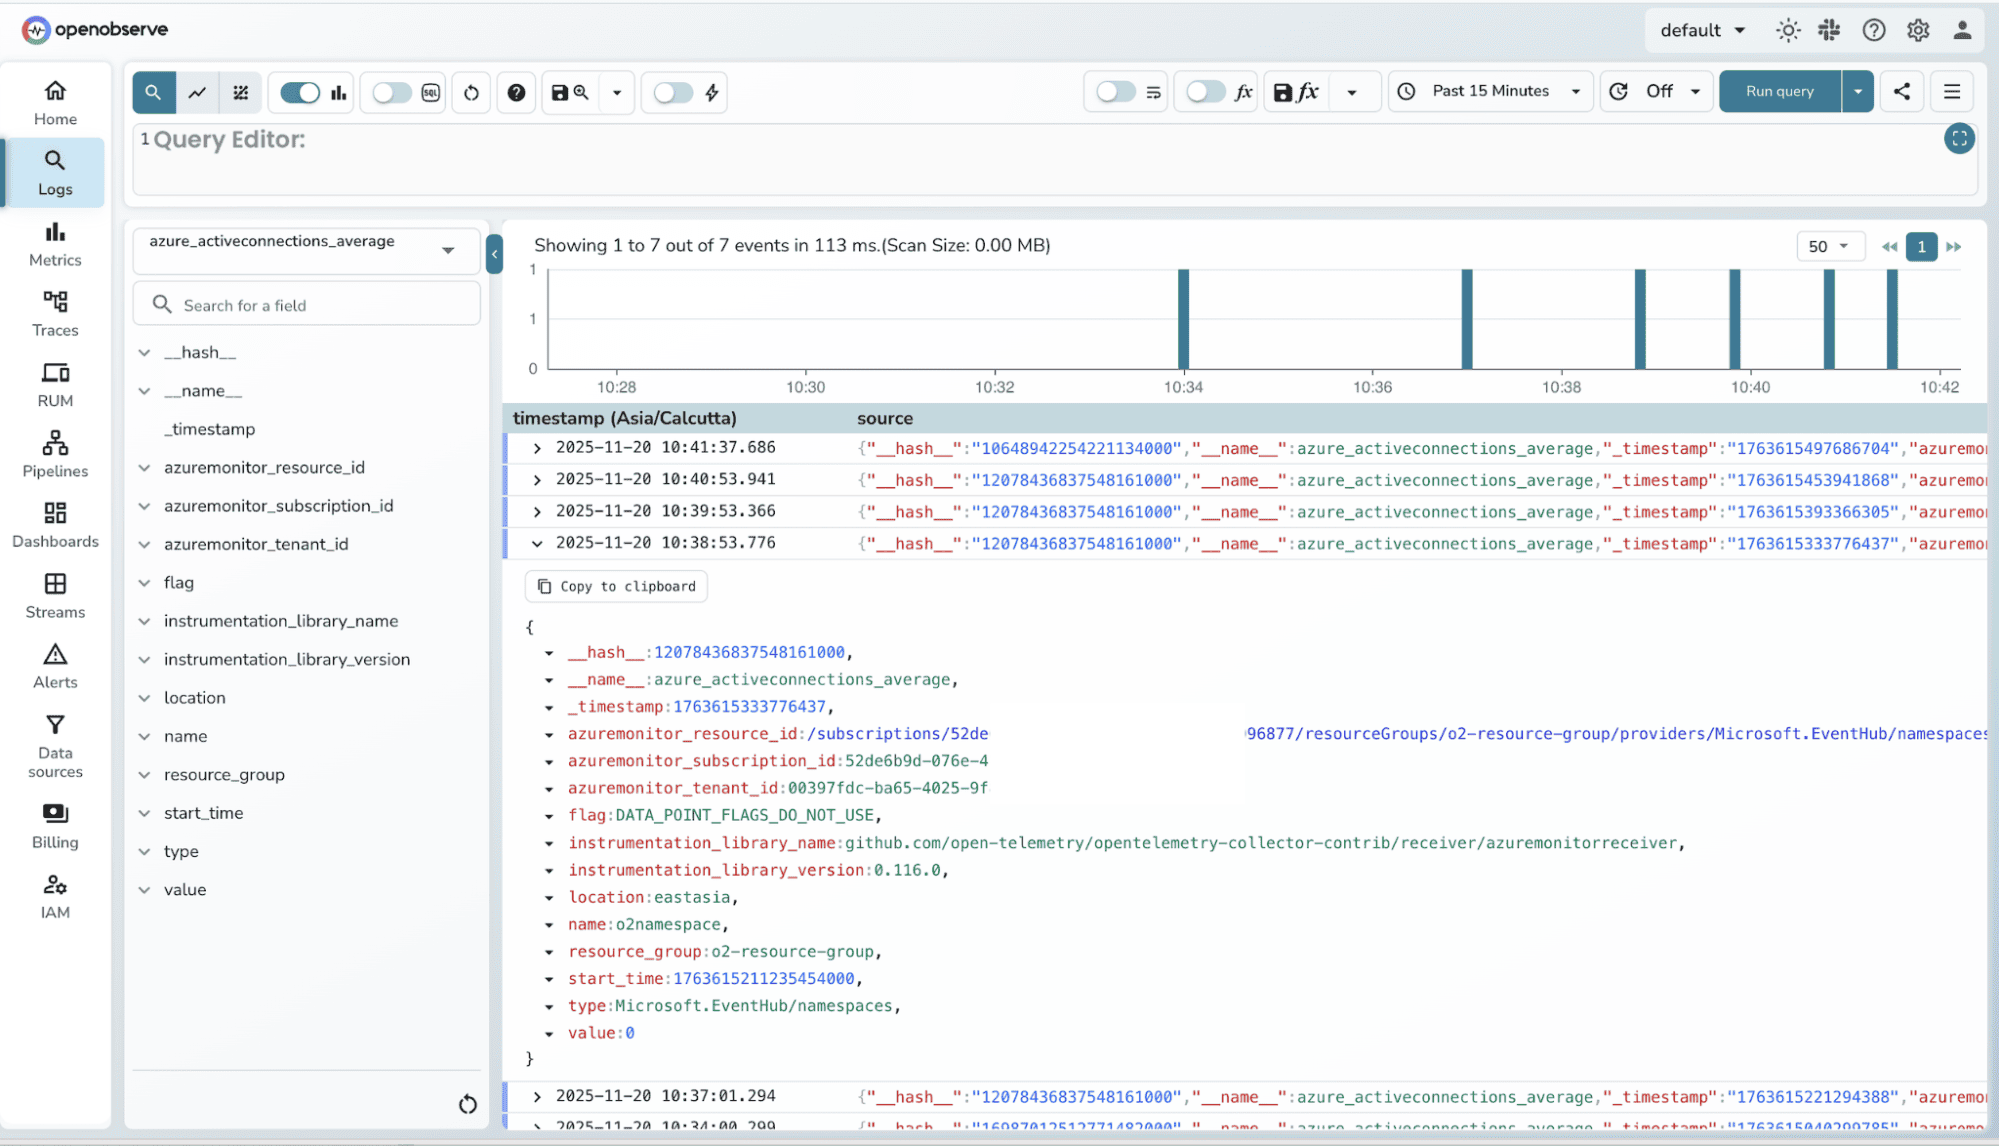
* Once verified, you can **create visualizations** for individual metrics. Use the **Query Editorr** to filter, aggregate, or transform metrics.
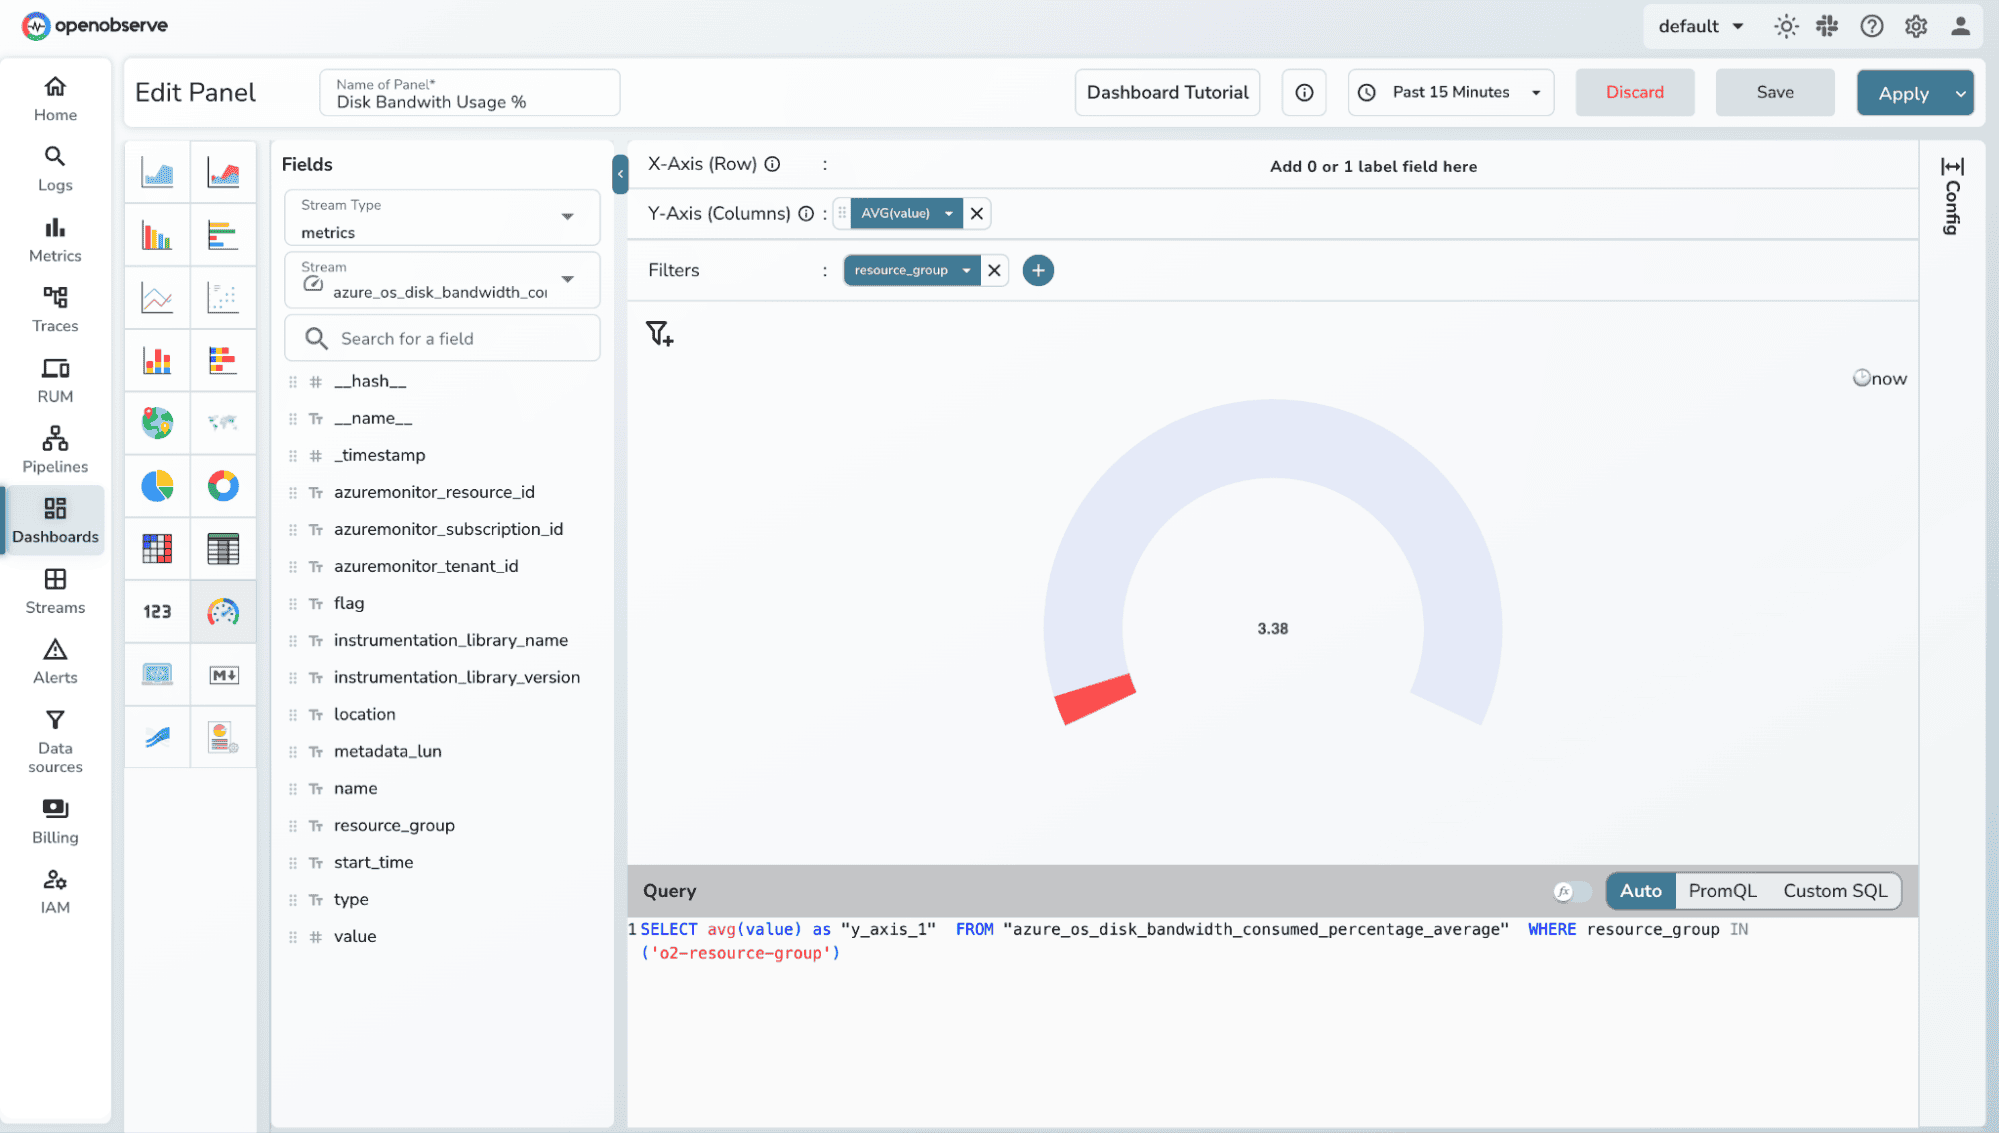
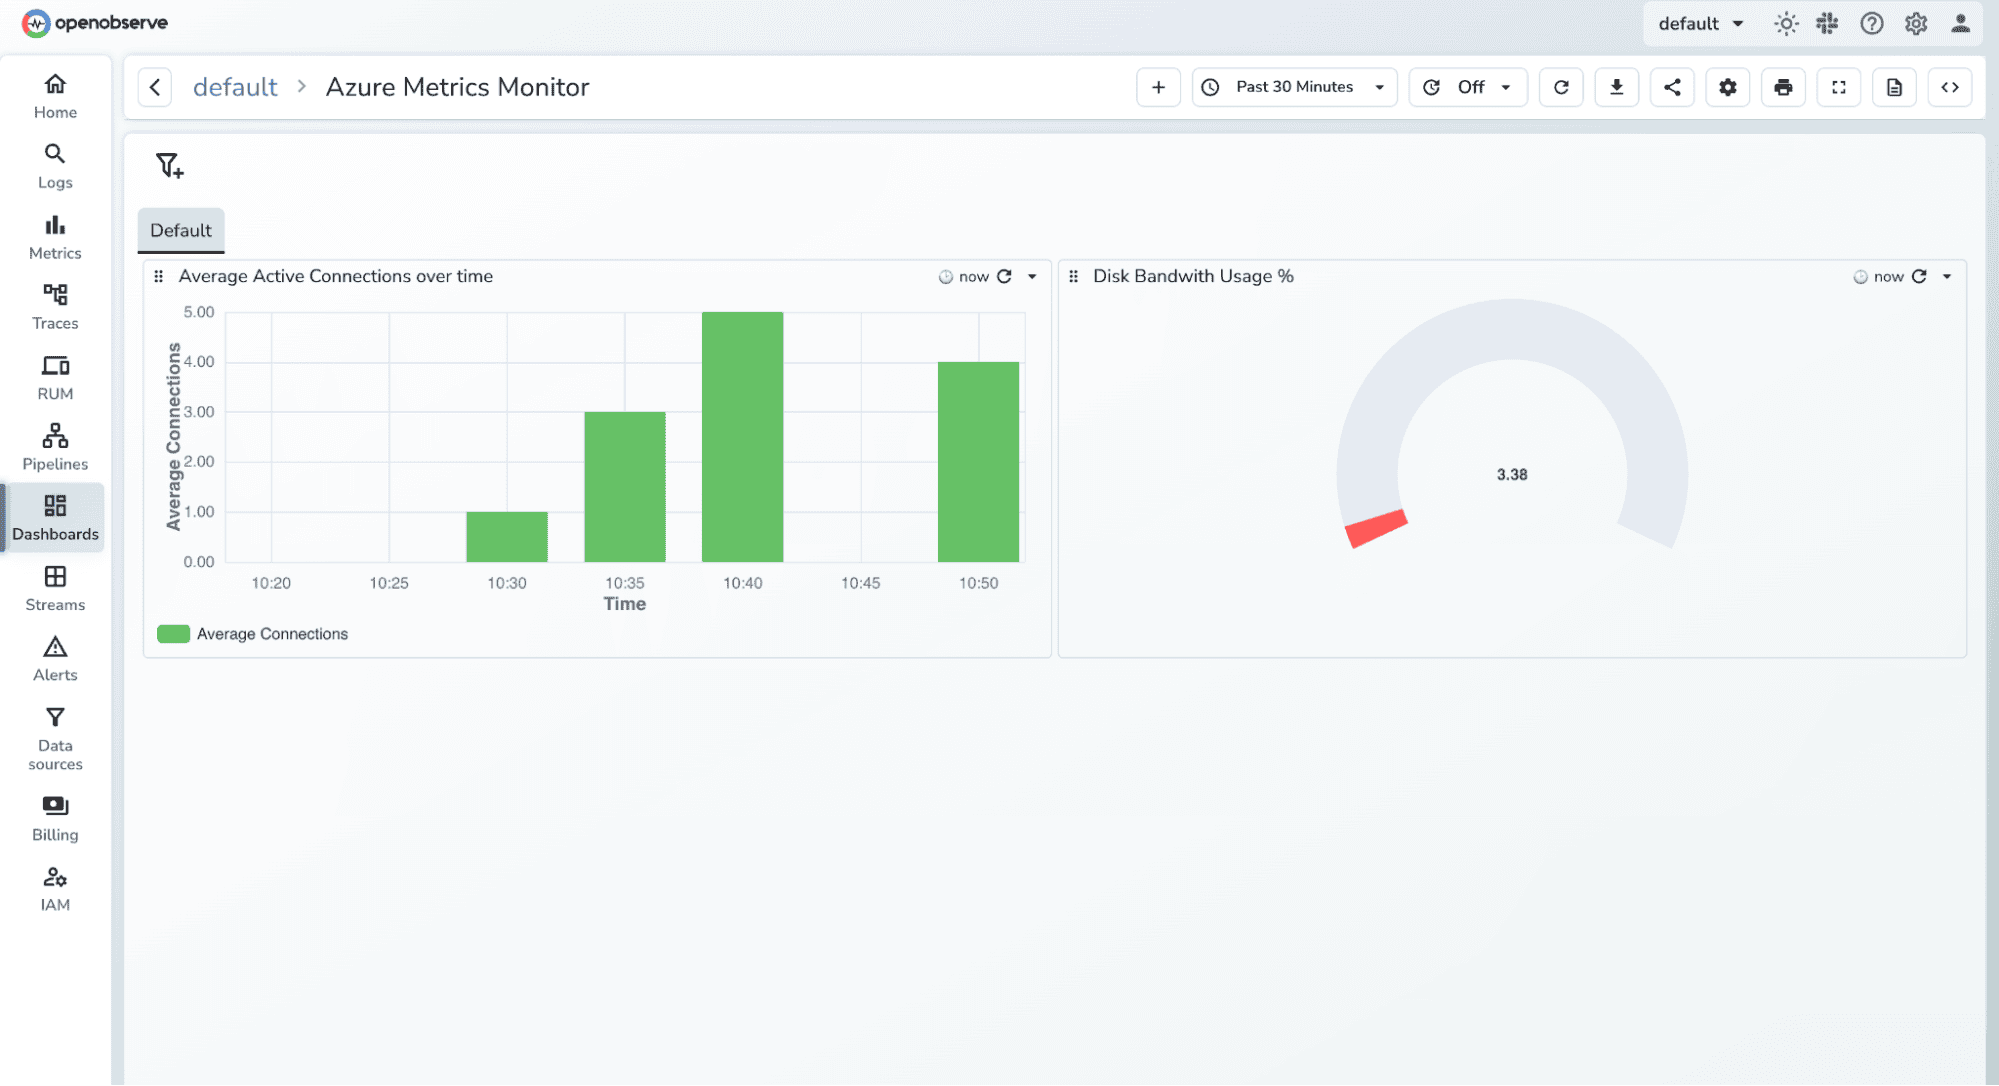
* Add charts or panels to dashboards for monitoring **CPU usage, memory, network throughput**, and other metrics.
## Conclusion
In this guide, we demonstrated how to export Azure Monitor metrics into OpenObserve using the OpenTelemetry Collector. By connecting Azure Monitor to OpenObserve, you can:
* Break data silos and unify metrics with logs, traces, and Prometheus data.
* Build real-time dashboards and visualizations for deeper insights into your infrastructure.
* Set up SQL-based alerts to monitor critical Azure resources and services effectively.
This integration empowers SREs, DevOps, and cloud engineers to have a single, vendor-neutral observability platform for end-to-end monitoring
## Next Steps
* **[Extend your dashboards](https://openobserve.ai/docs/user-guide/analytics/dashboards/dashboards-in-openobserve/)**
* **[Set up advanced alerts: ](https://openobserve.ai/docs/user-guide/analytics/alerts/)** Use SQL-based alerting to monitor SLIs and SLOs for your Azure workloads.
* **[Explore logs and traces](https://openobserve.ai/blog/monitor-azure-resources-eventhubreceiver/)**: Integrate Azure logs using Diagnostic Settings or Event Hub with OpenTelemetry Collector for full observability.