# Observability for the Claude Agent SDK: Tracing Tool Use and Extended Thinking with OpenTelemetry
> Trace, meter, and log Claude Agent SDK agents with OpenTelemetry: tool calls, MCP servers, extended thinking, and cost, all correlated in OpenObserve.
Source: https://openobserve.ai/blog/claude-agent-sdk-observability-opentelemetry/
Published: 2026-06-22
Authors: Gorakhnath Yadav
Category: How To
Tags: Claude Agent SDK, OpenTelemetry, Observability, Tracing, MCP, LLM
---
**TL;DR:** **Claude Agent SDK observability** comes down to three OpenTelemetry signals: traces for the agent loop, metrics for tokens and cost, and log events for the audit trail. The Claude Agent SDK runs the Claude Code CLI as a child process, and that CLI has OpenTelemetry instrumentation built in. You turn it on with environment variables, point it at an OTLP endpoint like [OpenObserve](https://openobserve.ai/), and every model request, tool call, MCP request, and subagent shows up as a span. This guide wires up all three signals end to end and reads a real trace that stitches your application, the agent, and its MCP servers into one timeline.
## Why observing an Agent SDK app is not like observing one API call
A single Claude API call is easy to reason about: one request, one response, some token counts. An agent built on the Claude Agent SDK is a different shape. One `query()` call runs a loop. Claude reads a prompt, decides to call a tool, waits for a permission decision, runs the tool, reads the result, calls the model again, maybe spawns a subagent, maybe calls an MCP server, and only then produces an answer. A single user request can fan out into a dozen model calls and tool executions.
When that loop is slow or wrong, a log line that says "agent finished in 38 seconds" tells you nothing useful. You need to see which model call burned 12 seconds, which tool returned an error, which MCP server timed out, and how much of the token bill came from extended thinking. That is the gap distributed tracing fills for agents, the same way it does for [AI agents in production](https://openobserve.ai/blog/monitor-ai-agents-production/) generally: every step becomes a span, and the trace shows you the timeline instead of a single duration.
The good news is that you do not have to instrument any of this by hand. The Agent SDK ships the instrumentation with it.
## How the Agent SDK emits OpenTelemetry
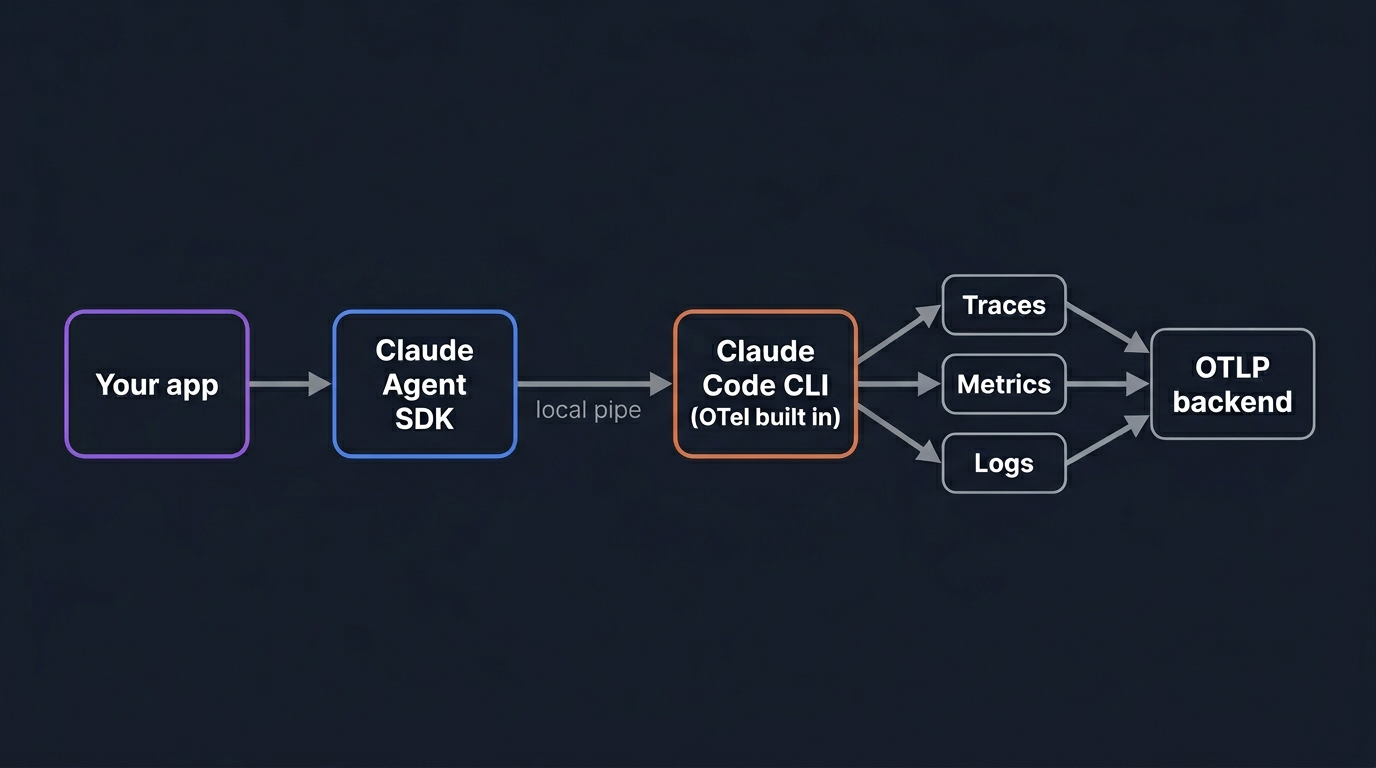
The Agent SDK does not produce telemetry itself. It runs the Claude Code CLI as a child process and talks to it over a local pipe. The CLI is the part with OpenTelemetry instrumentation built in: it records spans around each model request and tool execution, emits counters for tokens and cost, and writes structured log events for prompts and tool results. The SDK's job is to pass configuration through to that child process, and the CLI exports directly to your collector.
Configuration travels as environment variables. By default the child process inherits your application's environment, so you can set the variables in your shell, container, or orchestrator, or pass them per call through `ClaudeAgentOptions.env` in Python or `options.env` in TypeScript.
The CLI exports three independent signals, each with its own enable switch and its own exporter. You can turn on only the ones you need.
| Signal | What it contains | Enable with |
|---|---|---|
| Traces | Spans for each interaction, model request, tool call, and hook | `OTEL_TRACES_EXPORTER` plus `CLAUDE_CODE_ENHANCED_TELEMETRY_BETA=1` |
| Metrics | Counters for tokens, cost, sessions, lines of code, and tool decisions | `OTEL_METRICS_EXPORTER` |
| Log events | Structured records for each prompt, API request, API error, and tool result | `OTEL_LOGS_EXPORTER` |
If you are new to the protocol underneath all of this, [what is OpenTelemetry](https://openobserve.ai/blog/what-is-opentelemetry/) covers the span, metric, and log model these three signals map onto.
## The example app: a coding assistant that calls multiple MCP servers
To keep the rest of this guide concrete, here is the agent we will trace. It is a small coding assistant that answers questions about a repository. It has the standard file tools, and it connects to two MCP servers: one that exposes the project's issue tracker and one that exposes its CI system. A typical request like "why did the last deploy fail and is there an open issue for it" makes the agent read files, query CI through one MCP server, search issues through the other, and sometimes spawn a subagent to dig into a specific log.
That single request touches the model several times, runs local tools, and crosses two process boundaries to reach the MCP servers. On a flat log it is one line and a duration. As a trace it is a tree you can read top to bottom. Everything below uses this agent as the running example.
## Enabling telemetry
Telemetry is off until you set `CLAUDE_CODE_ENABLE_TELEMETRY=1` and choose at least one exporter. The example below enables all three signals over OTLP HTTP and passes them through `options.env`.
```python
import asyncio
from claude_agent_sdk import query, ClaudeAgentOptions
OTEL_ENV = {
"CLAUDE_CODE_ENABLE_TELEMETRY": "1",
# Traces are in beta and need this flag. Metrics and logs do not.
"CLAUDE_CODE_ENHANCED_TELEMETRY_BETA": "1",
"OTEL_TRACES_EXPORTER": "otlp",
"OTEL_METRICS_EXPORTER": "otlp",
"OTEL_LOGS_EXPORTER": "otlp",
"OTEL_EXPORTER_OTLP_PROTOCOL": "http/protobuf",
"OTEL_EXPORTER_OTLP_ENDPOINT": "http://localhost:4318",
"OTEL_EXPORTER_OTLP_HEADERS": "Authorization=Bearer your-token",
}
async def main():
options = ClaudeAgentOptions(env=OTEL_ENV)
async for message in query(
prompt="Why did the last deploy fail?", options=options
):
print(message)
asyncio.run(main())
```
The TypeScript shape is the same, with one trap. In Python, `env` is merged on top of the inherited environment. In TypeScript, `env` replaces the inherited environment entirely, so you must spread `process.env` yourself or the child process loses `PATH`, `ANTHROPIC_API_KEY`, and everything else.
```typescript
import { query } from "@anthropic-ai/claude-agent-sdk";
const otelEnv = {
CLAUDE_CODE_ENABLE_TELEMETRY: "1",
CLAUDE_CODE_ENHANCED_TELEMETRY_BETA: "1",
OTEL_TRACES_EXPORTER: "otlp",
OTEL_METRICS_EXPORTER: "otlp",
OTEL_LOGS_EXPORTER: "otlp",
OTEL_EXPORTER_OTLP_PROTOCOL: "http/protobuf",
OTEL_EXPORTER_OTLP_ENDPOINT: "http://localhost:4318",
OTEL_EXPORTER_OTLP_HEADERS: "Authorization=Bearer your-token",
};
for await (const message of query({
prompt: "Why did the last deploy fail?",
options: { env: { ...process.env, ...otelEnv } },
})) {
console.log(message);
}
```
One thing not to do: the `console` exporter writes telemetry to standard output, and the SDK uses standard output as its message channel. Setting any exporter to `console` while running through the SDK corrupts that channel. To inspect telemetry locally, point the OTLP endpoint at a local collector instead.
## Sending telemetry to OpenObserve over OTLP
OpenObserve is OpenTelemetry-native: it accepts traces, metrics, and logs on the same OTLP endpoint and stores them together. Because the Agent SDK speaks plain OTLP, pointing it at OpenObserve is a matter of the endpoint and an auth header, with no extra integration.
For OpenObserve Cloud, the base endpoint is your organization path, and the OTLP exporter appends `/v1/traces`, `/v1/metrics`, and `/v1/logs` to it.
```bash
OTEL_EXPORTER_OTLP_PROTOCOL=http/protobuf
OTEL_EXPORTER_OTLP_ENDPOINT=https://api.openobserve.ai/api/your_org_slug
OTEL_EXPORTER_OTLP_HEADERS=Authorization=Basic
```
For a self-hosted instance, swap the host and use the default organization:
```bash
OTEL_EXPORTER_OTLP_ENDPOINT=http://localhost:5080/api/default
```
The Basic token is the base64 encoding of your OpenObserve `email:token` pair, which you can copy from the data ingestion screen. Once the agent runs, traces, metrics, and logs land in OpenObserve under their own streams, ready to query and correlate. One thing to expect on the metrics side: OpenObserve stores each metric as its own stream and maps the dots in the metric name to underscores, so `claude_code.token.usage` shows up as a stream named `claude_code_token_usage`.
### Flushing telemetry from short-lived runs
There is a timing problem unique to agents that run once and exit. The CLI batches telemetry and exports on an interval: metrics every 60 seconds by default and logs every 5 seconds. A short task can finish and the process can exit before the next export fires. On a clean exit the CLI tries to flush, but the flush is bounded by a short timeout, and if your process is killed outright, anything still in the buffer is lost.
The fix is to shorten the intervals so data reaches the backend while the task is still running.
```python
OTEL_ENV = {
# ... the exporter configuration from above ...
"OTEL_METRIC_EXPORT_INTERVAL": "1000",
"OTEL_LOGS_EXPORT_INTERVAL": "1000",
}
```
Set these for short-lived jobs and cron-style agents. For a long-running service, the defaults are fine and the lower intervals only add export overhead.
## Reading the trace: client to agent to MCP server
With `CLAUDE_CODE_ENHANCED_TELEMETRY_BETA=1` set, each step of the agent loop becomes a span. The hierarchy is fixed and worth memorizing, because it is how you read every agent trace:
```text
claude_code.interaction
├── claude_code.llm_request
├── claude_code.hook (requires detailed beta tracing)
└── claude_code.tool
├── claude_code.tool.blocked_on_user
├── claude_code.tool.execution
└── (Agent tool) subagent claude_code.llm_request / claude_code.tool spans
```
`claude_code.interaction` wraps one turn of the loop, from receiving a prompt to producing a response. Each model call is a `claude_code.llm_request` child span. Its attributes follow the OpenTelemetry `gen_ai.*` semantic conventions, so you get `gen_ai.request.model`, `gen_ai.operation.name`, the response finish reasons, and token counts, alongside the span's latency. Each tool call is a `claude_code.tool` span. When the agent spawns a subagent through the Agent tool (or the legacy Task tool), the subagent's own model and tool spans nest under the parent's `claude_code.tool` span, so the entire delegation chain reads as one tree. The `llm_request`, `tool.execution`, and `hook` spans set OpenTelemetry status `ERROR` when they fail, so a failed step is visible without reading attributes.
The piece that makes this genuinely end to end is trace-context propagation. When you call `query()` while an OpenTelemetry span is active in your own application, the SDK injects `TRACEPARENT` and `TRACESTATE` into the child process, and the CLI makes its `claude_code.interaction` span a child of your span. The agent run appears inside your application's trace instead of as a disconnected root.
```python
from opentelemetry import trace
tracer = trace.get_tracer("coding-assistant")
with tracer.start_as_current_span("handle_request"):
options = ClaudeAgentOptions(env=OTEL_ENV)
async for message in query(prompt=user_question, options=options):
handle(message)
# The agent's interaction span nests under handle_request automatically.
```
Propagation runs deeper than the agent boundary. The CLI forwards `TRACEPARENT` to every Bash and PowerShell command it runs, so a command that emits its own spans nests under the `claude_code.tool.execution` span that launched it. It also attaches a W3C `traceparent` header to each model request and to outbound HTTP MCP requests, so an MCP server that is itself instrumented continues the same trace on its side. That is how a single trace spans your app, the agent loop, and the MCP servers it calls, which is the whole point of [distributed tracing](https://openobserve.ai/blog/distributed-tracing-basics-to-beyond-guide/) applied to agents.
Every span also carries a `session.id` attribute. When you make several `query()` calls against the same session, filter on `session.id` in OpenObserve to see them as one timeline.
## Tracing tool use: where latency and failures live
Tool spans are where most agent surprises hide, and the Agent SDK splits each one into parts that answer different questions. A `claude_code.tool` span has two children: `claude_code.tool.blocked_on_user`, which measures the time spent waiting on a permission decision, and `claude_code.tool.execution`, which measures the tool actually running. That split matters. An agent that feels slow because a human has to approve every file write looks completely different in a trace from one that is slow because a tool call hangs. The first shows fat `blocked_on_user` spans; the second shows fat `execution` spans.
For the coding assistant, this is where you see that the CI MCP query took 9 seconds while the file reads took milliseconds, or that the agent stalled waiting for approval on a shell command. The same picture extends to the MCP servers themselves, which is the focus of [MCP server observability](https://openobserve.ai/blog/mcp-servers-observability-guide/): once the MCP request is a span in the same trace, a slow or failing server stops being invisible.
If you want the tool inputs and outputs on the span as well, `OTEL_LOG_TOOL_CONTENT=1` records the full input and output bodies as span events on `claude_code.tool`, truncated at 60 KB. Leave it off until you have decided that storing tool content is acceptable, which the privacy section below covers.
## How extended thinking shows up in traces
Extended thinking is not a separate span, and it is not a separate signal. There is no `claude_code.thinking` span to look for.
What you actually see is the cost. Thinking happens inside a model call, so it shows up as larger token counts on the `claude_code.llm_request` span and as a higher `claude_code.token.usage` metric for that interaction. A request where Claude thought hard before answering has a longer `llm_request` span and more output tokens than one where it answered directly. That is the observable signal: latency and tokens on the model span.
The framing of "budget for thinking" has also moved on. On current Claude models, you do not set a fixed thinking token budget. You set the `effort` parameter, and the model decides how much to think per request with adaptive thinking. So the operational loop is: watch token spend per interaction in your traces and metrics, and if a class of requests spends more on thinking than the answers justify, lower the effort for that path instead of reaching for a token cap. Tracking that spend over time is ordinary [LLM cost monitoring](https://openobserve.ai/blog/llm-cost-monitoring/), just sourced from the agent's own telemetry.
The thinking text itself stays private. Even when you enable raw API body logging, extended-thinking content is redacted from the exported bodies. You get the shape and cost of thinking in your traces without the thinking content leaking into your observability backend, which is usually exactly what you want. The token counts that show this are right there on the `claude_code.llm_request` span detail in the trace waterfall above.
## Metrics: token, cost, and tool-decision counters
A trace shows one run. Metrics show the aggregate you put on a dashboard and alert on. The CLI emits these counters:
| Metric | What it measures | Unit |
|---|---|---|
| `claude_code.token.usage` | Tokens used | tokens |
| `claude_code.cost.usage` | Session cost | USD |
| `claude_code.session.count` | CLI sessions started | count |
| `claude_code.active_time.total` | Active time | seconds |
| `claude_code.lines_of_code.count` | Lines of code modified | count |
| `claude_code.commit.count` | Git commits created | count |
| `claude_code.pull_request.count` | Pull requests created | count |
| `claude_code.code_edit_tool.decision` | Code-editing tool permission decisions | count |
For the coding assistant, `claude_code.cost.usage` and `claude_code.token.usage` are the two you watch daily: cost per session, tokens per request, and the trend as you change prompts or models. The same approach used for [monitoring OpenAI API costs with OpenTelemetry](https://openobserve.ai/blog/monitor-openai-api-costs-opentelemetry/) applies here, except the counters arrive from the agent's own CLI rather than a wrapper you wrote. `claude_code.code_edit_tool.decision` is the one to watch for behavior: a spike in rejected edits often means a prompt regression or an agent fighting its permission rules.
A practical note on cardinality. Every attribute on a metric becomes a label, and high-cardinality labels inflate storage. The CLI gives you switches for this: `OTEL_METRICS_INCLUDE_SESSION_ID` adds `session.id` to metrics (on by default), and you can turn off version, account, and resource attributes on datapoints if you do not need to slice by them. Keep `session.id` on metrics only if you actually query metrics by session; otherwise it multiplies your series count for little gain.
## Log events: the agent's audit trail
The third signal is structured log events, and it is the record of what the agent decided and did, one event per action. The events that matter most:
- `claude_code.user_prompt` records each submitted prompt.
- `claude_code.tool_result`: a tool ran and returned, with timing and (optionally) its parameters.
- `claude_code.tool_decision`: the permission system accepted or rejected a tool call.
- `claude_code.api_request`, `claude_code.api_error`, and `claude_code.api_refusal` cover each model call and how it ended.
- `claude_code.permission_mode_changed` fires when the agent's permission mode changes mid-session.
- `claude_code.auth` for authentication events.
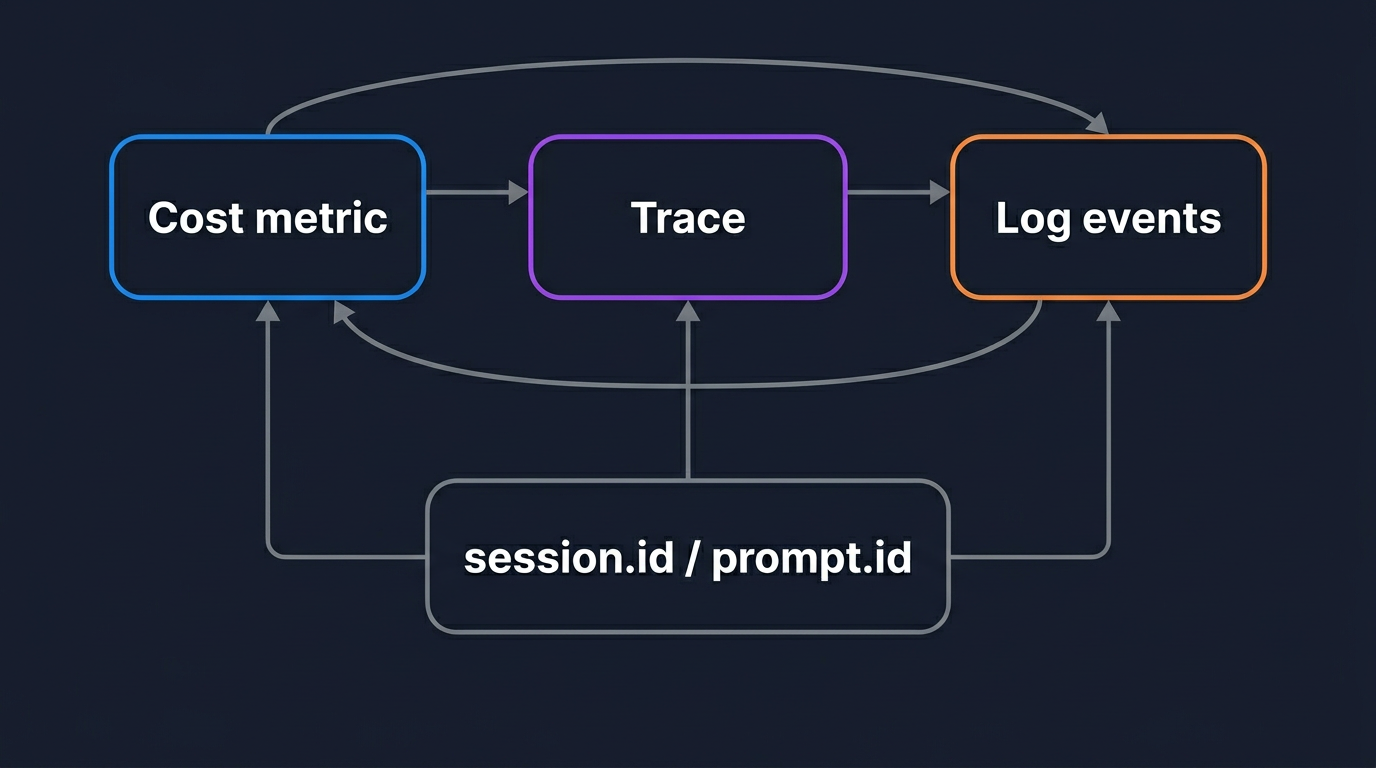
These events share the standard attributes, and they add one that ties them together: `prompt.id`. When a user submits a prompt, the agent may make several API calls and run several tools; every event from that turn carries the same `prompt.id`, so you can reconstruct the full sequence of one request from the log stream alone. That makes the event stream a clean per-request audit trail, which is also what you forward to a SIEM when you need to know which tool ran which command on whose behalf.
For the coding assistant, the events answer what the traces leave out. They record the exact commands the agent proposed and which ones the permission system rejected. They also record whether a model call failed or refused instead of stopping normally. Traces give you the timing; events give you the decisions.
## Correlating traces, metrics, and logs in OpenObserve
Three signals are only worth the trouble if you can move between them. This is where sending all of them to one OTLP-native backend pays off, instead of splitting traces to one tool and metrics to another. In OpenObserve, the agent's traces, metrics, and logs share the same `session.id`, and its events share the same `prompt.id`. The investigation flow becomes a straight line.
A cost alert fires on `claude_code.cost.usage` for a session. You filter traces by that `session.id` and find the `claude_code.interaction` that did the damage. Inside it, one `claude_code.llm_request` span is huge, with a large token count, which tells you the model spent heavily on thinking. You pivot to the log events for that `prompt.id` and read the `tool_decision` and `tool_result` sequence to see what the agent was doing that drove the thinking. That whole path runs on shared keys, so you are not copy-pasting timestamps between separate tools to line things up. It is the same [logs, metrics, and traces correlation](https://openobserve.ai/blog/logs-traces-metrics-correlation/) workflow you would want for any service, with the agent's identifiers doing the joining.
## Built-in CLI telemetry vs. in-process instrumentation
The built-in CLI telemetry is not the only way to observe an Agent SDK app, and sometimes you want an alternative. Libraries such as OpenInference's `openinference-instrumentation-claude-agent-sdk` instrument the SDK inside your own Python process, so spans are created by your application's tracer rather than exported from the CLI subprocess. Vendor integrations from Langfuse and LangSmith wrap the SDK the same way.
The trade-off is straightforward. The built-in CLI telemetry is zero application code, gives you the full native span tree (`interaction`, `llm_request`, `tool`, and the subagent nesting), propagates context across the process and MCP boundaries, and is the right default for production. In-process instrumentation is useful when you want agent spans created by the same tracer as the rest of your application without relying on `TRACEPARENT` injection, when you want to attach custom attributes inline in your own code, or when you are already committed to a specific tracing vendor and want everything in their model. For a broader survey of where these fit, [OpenTelemetry for LLMs](https://openobserve.ai/blog/opentelemetry-for-llms/) walks through the instrumentation options. Both export OpenTelemetry, so both land in OpenObserve over OTLP; the question is which tracer owns the spans.
## Controlling sensitive data and attributing activity
Agent telemetry is structural by default, which is the safe default. Durations, model names, tool names, and token counts are recorded; the prompts your agent reads and the content your tools handle are not. Content is added only when you opt in, one flag at a time:
- `OTEL_LOG_USER_PROMPTS=1` adds prompt text to `claude_code.user_prompt` events and the interaction span.
- `OTEL_LOG_TOOL_DETAILS=1` adds tool input arguments (file paths, shell commands, search patterns) to tool events.
- `OTEL_LOG_TOOL_CONTENT=1` adds full tool input and output bodies as span events, truncated at 60 KB, and requires tracing.
- `OTEL_LOG_RAW_API_BODIES` adds the full Messages API request and response JSON, with the entire conversation history and extended-thinking content redacted.
Leave these unset unless your observability pipeline is approved to store what your agent handles. If you need a middle ground, OpenObserve ingestion pipelines can redact specific fields server-side before the data lands in storage, so you can capture tool details for debugging while scrubbing secrets out of the path.
Attribution is the other half. By default the CLI reports `service.name` as `claude-code` and tags events with the identity of the credential it used to call Anthropic, which is your service, not your end user. Override the service name and attach metadata so you can tell agents apart, and inject end-user identity per request so multi-tenant activity is attributable:
```python
from urllib.parse import quote
options = ClaudeAgentOptions(
env={
# ... exporter configuration ...
"OTEL_SERVICE_NAME": "coding-assistant",
"OTEL_RESOURCE_ATTRIBUTES": (
f"enduser.id={quote(request.user_id)},"
f"tenant.id={quote(request.tenant_id)}"
),
},
)
```
Percent-encode the values, since `OTEL_RESOURCE_ATTRIBUTES` reserves commas, spaces, and equals signs. With end-user identity attached, the `tool_decision`, `tool_result`, and permission events become a per-user audit trail you can group and route in OpenObserve, the same pattern used for any [AI agent monitoring](https://openobserve.ai/blog/ai-agent-monitoring/) at scale.
## See your agent traces in OpenObserve
The Claude Agent SDK already emits OpenTelemetry traces, metrics, and logs over OTLP, and OpenObserve ingests all three on one endpoint and correlates them by `session.id` and `prompt.id`, alongside the rest of your infrastructure observability. You do not need a separate LLM tool. Set the telemetry environment variables, point them at your instance, and your agent's full trace tree shows up in the explorer on the next run. [Start free with OpenObserve Cloud](https://openobserve.ai/) and send your first agent trace in minutes.