# Why Stream Cloudflare Logs?
> This guide demonstrates how to stream Cloudflare HTTP request logs to OpenObserve using GraphQL API polling or Logpush HTTP push.
Source: https://openobserve.ai/blog/cloudflare-monitoring/
Published: 2025-03-24
Authors: Nitya Timalsina
Category: How To
Tags: DevOps, Integrations, Logging
---
Cloudflare protects and optimizes millions of domains with its CDN, DDoS protection, and DNS services. Its logs, packed with HTTP request data, response codes, and security events, are vital for monitoring web performance and threats. While Logpush provides real-time log streaming for Enterprise plans, it’s not the only way to capture Cloudflare logs-or a requirement. This guide equips Free, Pro, Business, and Enterprise users with two practical methods to stream Cloudflare logs: the GraphQL API (accessible to all plans) or Logpush (Enterprise-only).
In this article, we’ll show you how to set up Cloudflare logs streaming to OpenObserve using real traffic from a website or Worker. Whether you’re avoiding Logpush costs or enhancing an Enterprise setup, you’ll have it running in 30 minutes. Let’s get started\!
## Why Stream Cloudflare Logs?
Streaming Cloudflare logs delivers immediate, actionable insights into your web traffic-far surpassing static exports. Here’s what it enables:
- **Performance Monitoring**: Spot 500 errors or latency spikes as they occur, ensuring quick fixes.
- **Security Analysis**: Catch bots, rate-limits, or attacks in real time, bolstering defenses.
- **Operational Insights**: Use live data to troubleshoot issues or optimize site performance.
For Free, Pro, and Business users, streaming Cloudflare logs offers a no-cost alternative to Logpush. For Enterprise users, it’s a versatile enhancer or standalone option, reducing reliance on premium features. OpenObserve simplifies the process, making Cloudflare logs streaming accessible and efficient-here’s how to implement it.
## Prerequisites
You’ll need:
- **Cloudflare Account**: Free, Pro, Business, or Enterprise-all compatible.
- **OpenObserve Account**: [Sign up for OpenObserve](https://openobserve.ai/downloads/) if you don't already have an account.
- **API Token**: “Read analytics and logs” for GraphQL or Logpush permissions (Enterprise).
- **Tools**: Python 3.8+, terminal, virtual environment (GraphQL option).
- **Traffic Source**: Live site, Worker, or existing traffic (GraphQL option).
---
## Step 1: Retrieve Your OpenObserve Endpoint and Credentials
To stream Cloudflare logs, you will first need to grab your OpenObserve Cloud endpoint and credentials. Log into OpenObserve and follow these steps:
1. From the left menu, select **Data Sources \> Custom \> Logs \> Curl**.
2. **Extract Details:**
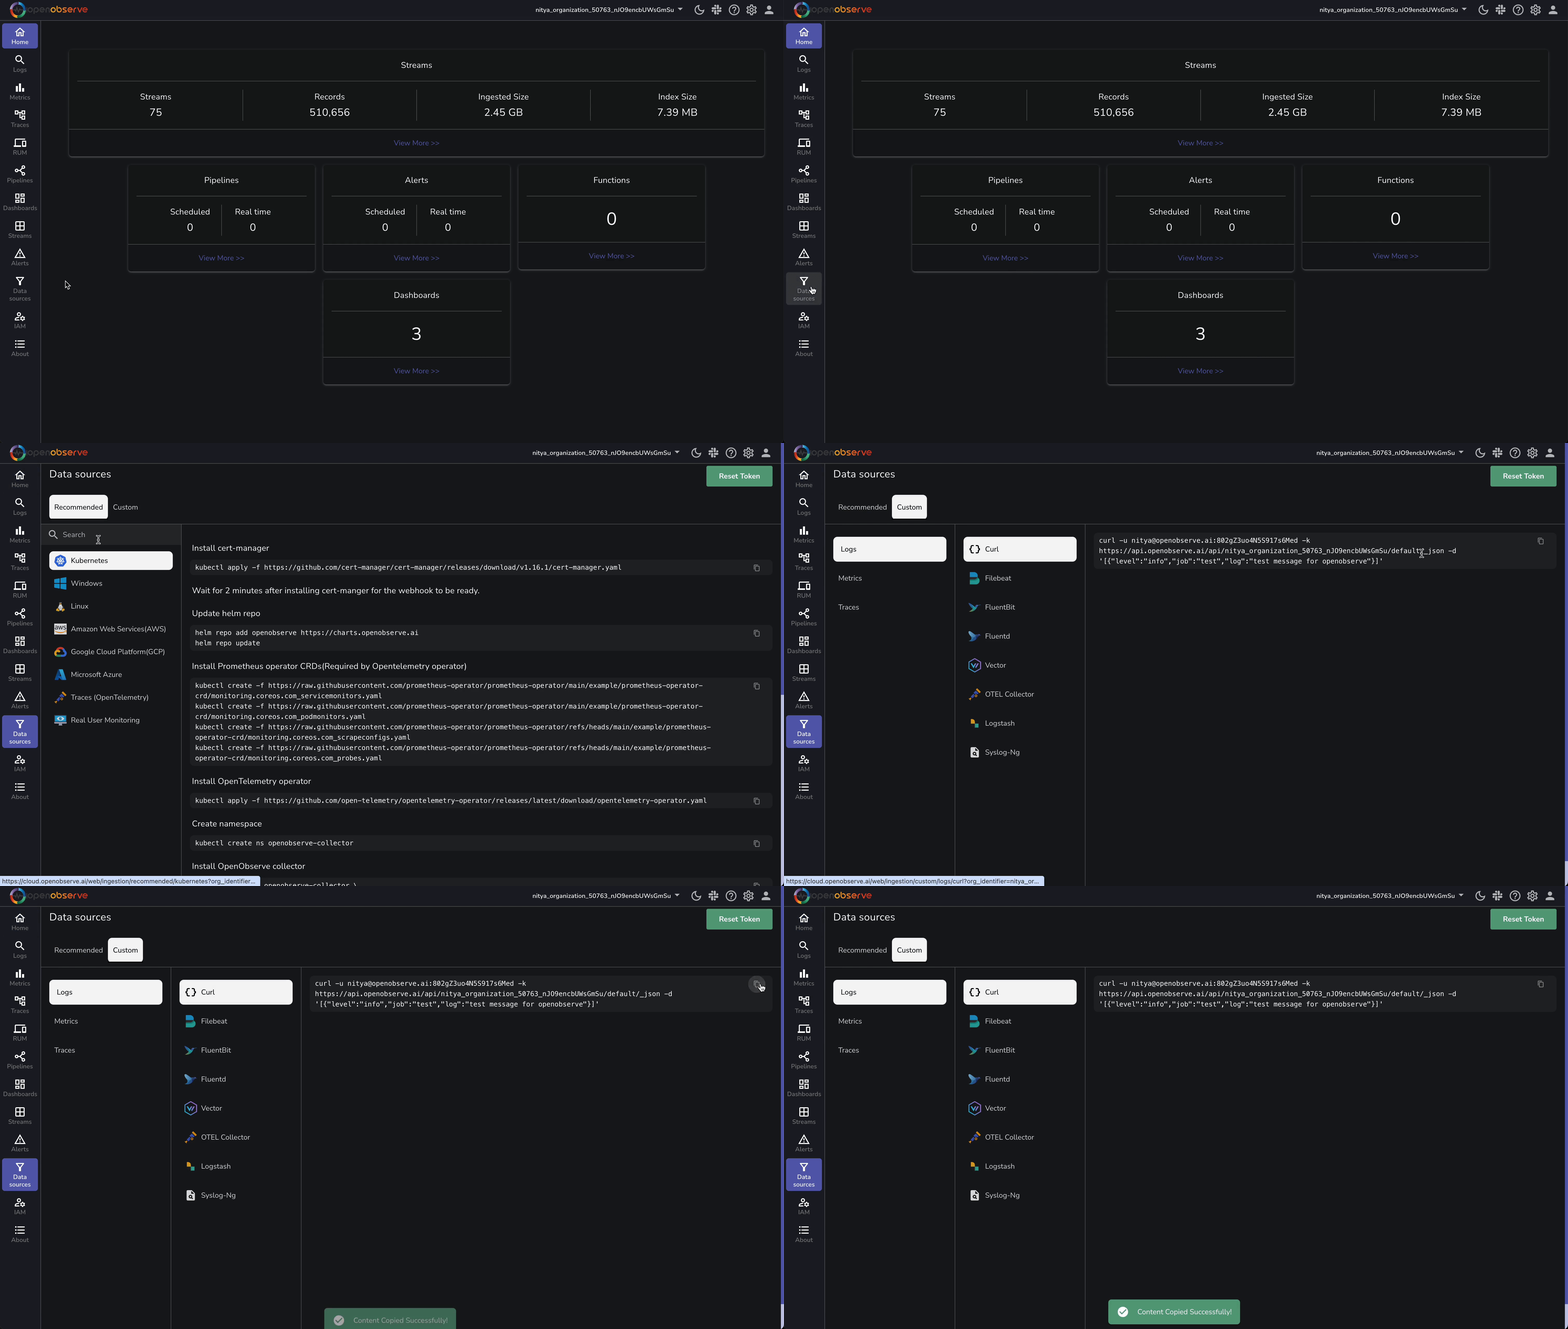
- **Endpoint**: `https://api.openobserve.ai/api/cloudflare_logs/_json` (replace \; update default to cloudflare_logs).
- **Credentials**: Username (e.g., nitya@openobserve.ai) and password (e.g., 802gZ3uo4N5S917s6Med).
Replace the example values with yours. Your OpenObserve setup is ready-on to the next step\!
---
## Step 2: Generate Cloudflare Logs
Real logs come from actual traffic-no artificial loops required. Choose a scenario:
1. **Live Site Traffic** (Any Plan):
- Add a domain (e.g., example.com) in the Cloudflare dashboard.
- Set up a proxied DNS A record (orange cloud enabled) to your server.
- Drive traffic by visiting the site, sharing the URL, or letting users access it naturally.
- Logs appear as requests hit Cloudflare’s edge.
2. **Cloudflare Worker** (Free+ Plans):
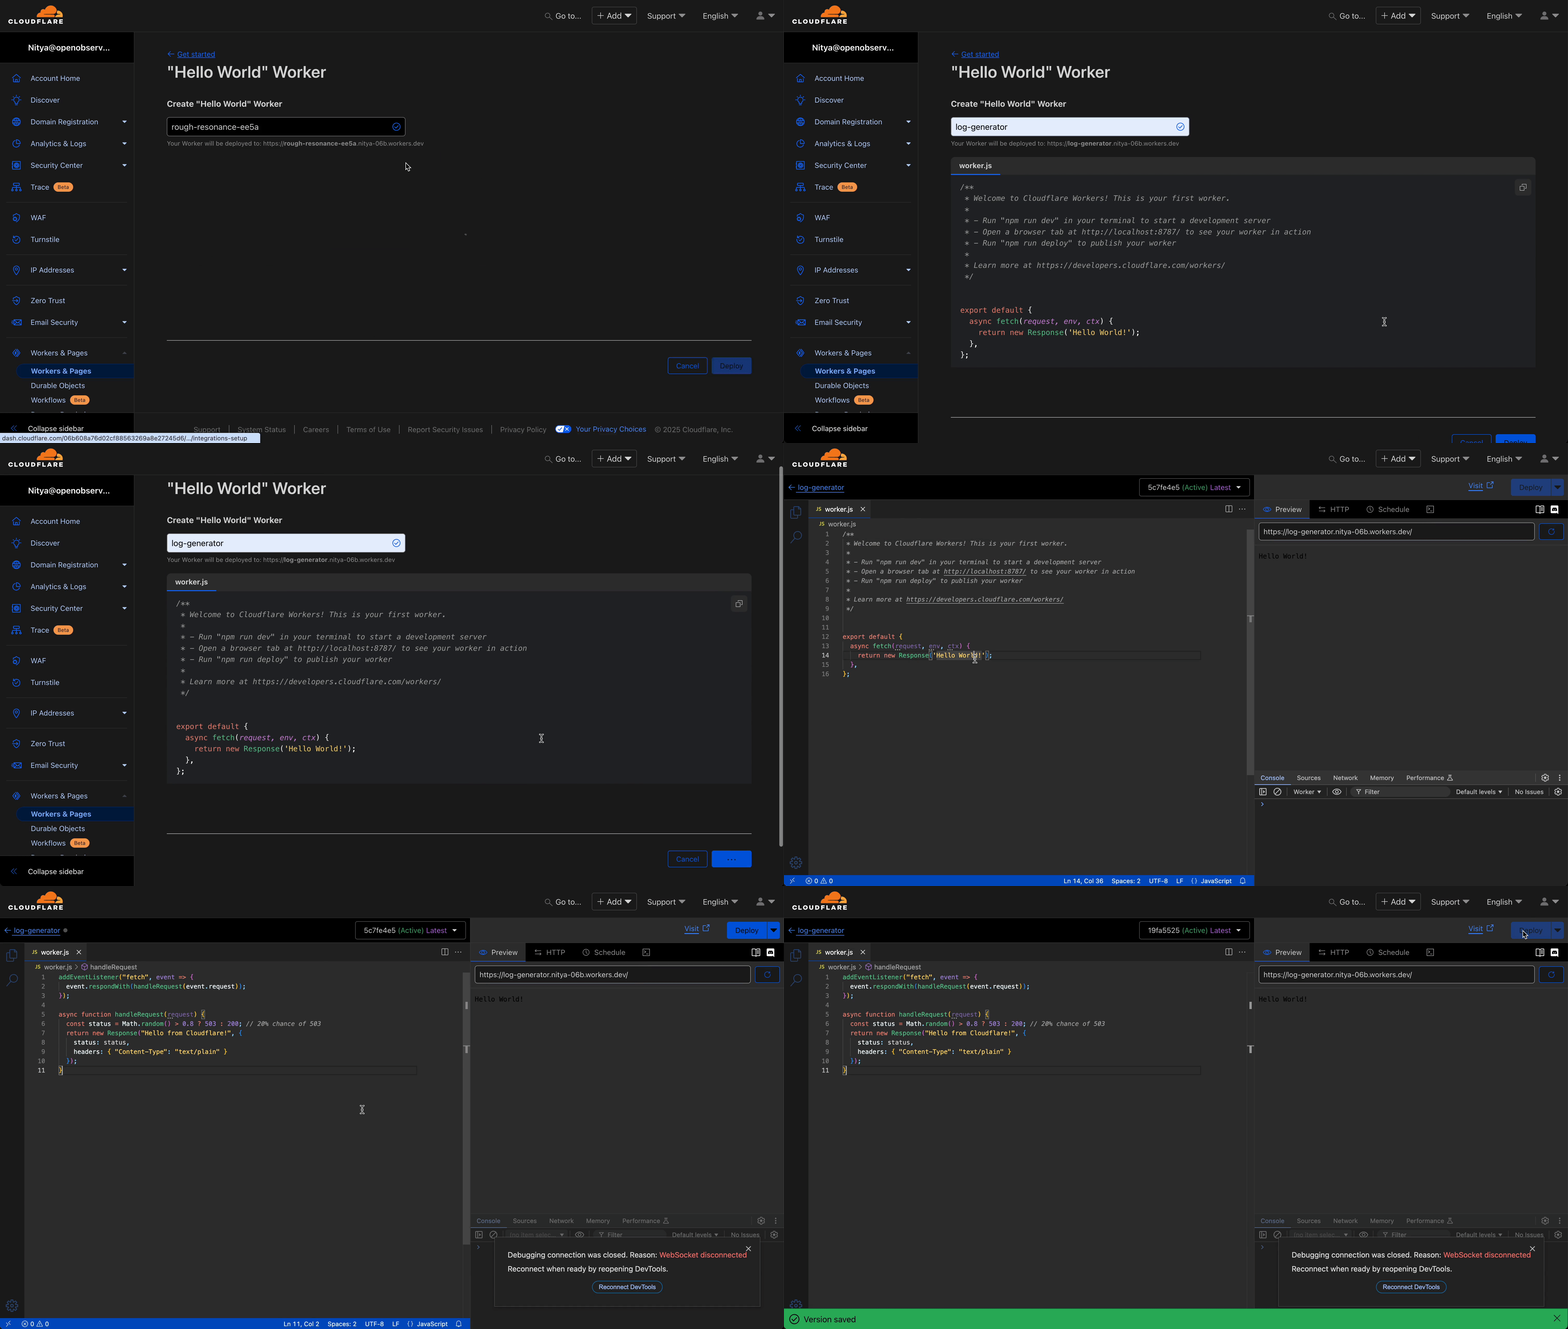
- Go to **Workers & Pages \> Create Worker**.
- Name it (e.g., log-generator).
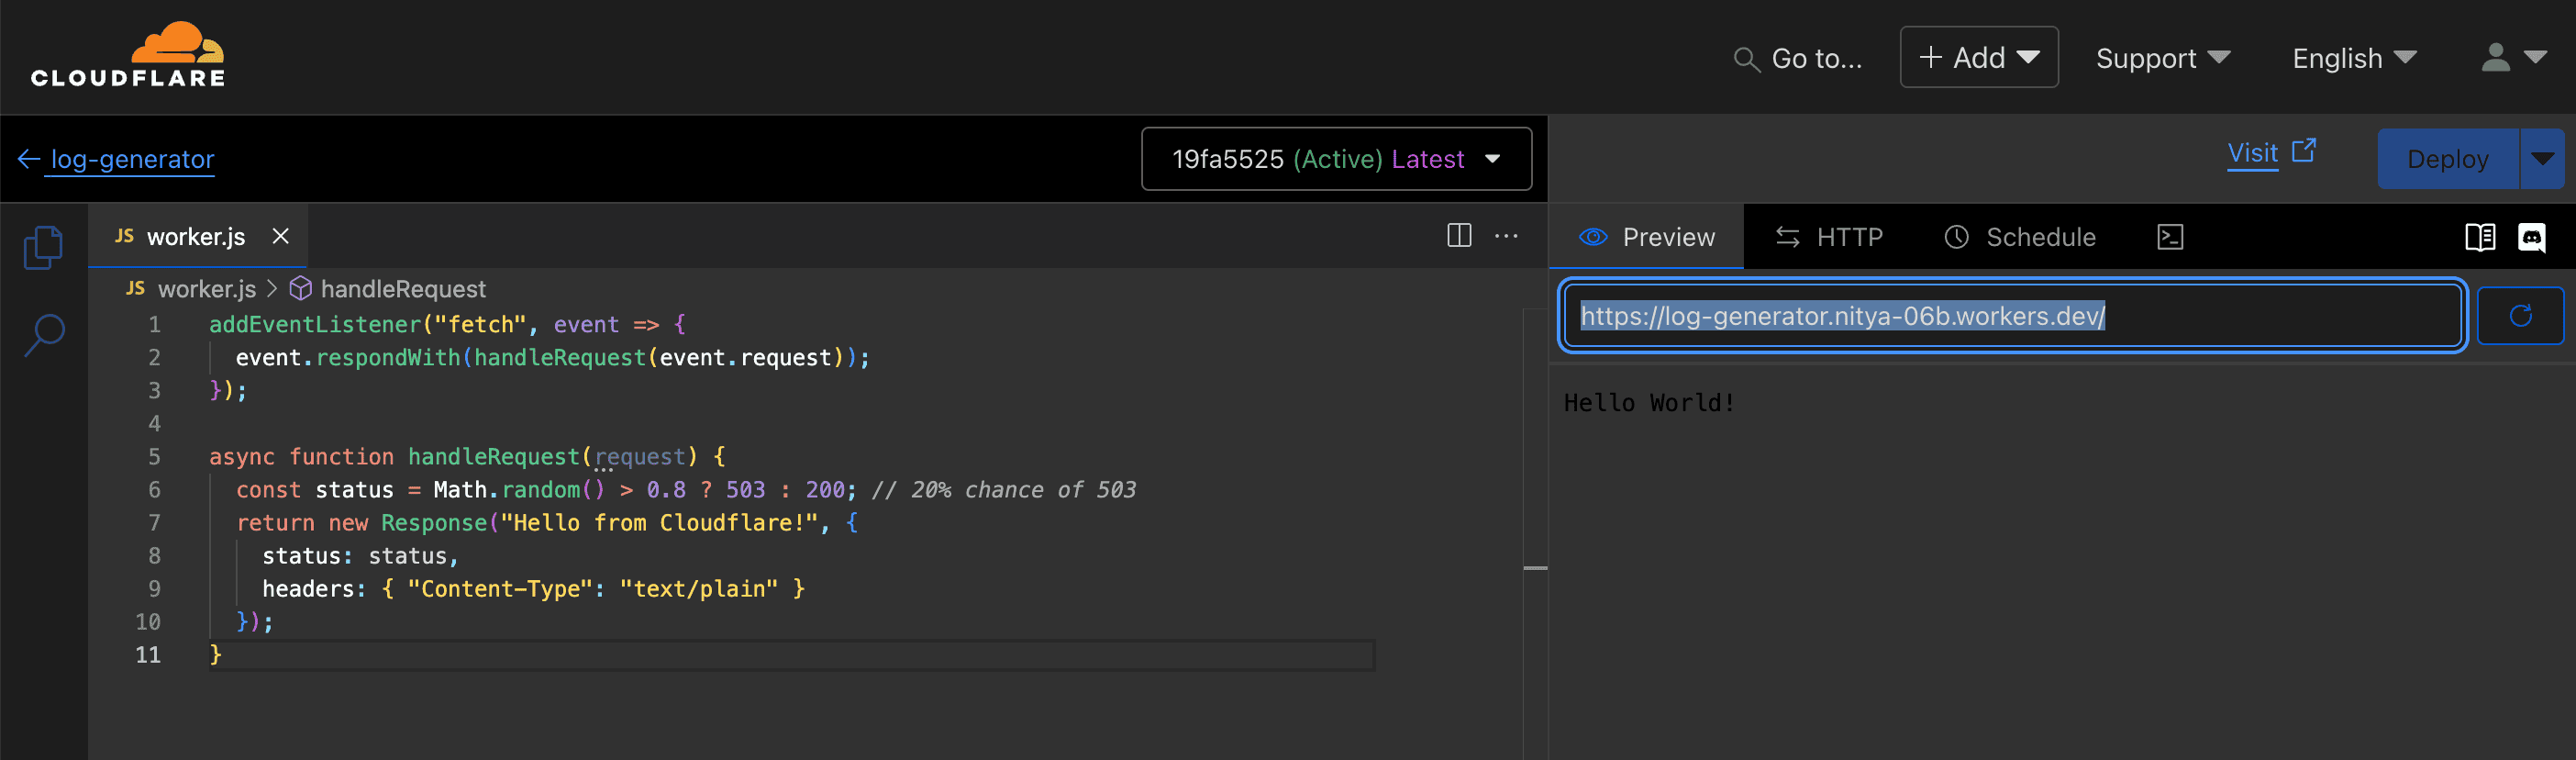
- Add this code:
```javascript
addEventListener("fetch", (event) => {
event.respondWith(handleRequest(event.request));
});
async function handleRequest(request) {
const status = Math.random() > 0.8 ? 503 : 200; // 20% chance of 503
return new Response("Hello from Cloudflare!", {
status: status,
headers: { "Content-Type": "text/plain" },
});
}
```
- Click **Deploy**, note the URL (e.g., log-generator.\.workers.dev).
- Optional: Add a route (e.g., example.com/log/\*) in **Workers Routes**.
- Generate traffic by visiting the URL/route, linking it on a site, or enabling user access.
3. **Existing Traffic** (Business/Enterprise):
- Use an active domain or Worker proxied by Cloudflare.
- Logs flow from existing users or services—no extra setup.
4. **Verify Logs**:
- Check **Analytics \> Traffic** in the dashboard—requests show up within minutes.
---
## Step 3: Stream Logs to OpenObserve
Choose one of these options to stream your logs-both integrate seamlessly:
### **Option 1: GraphQL API (All Plans, No Logpush)**
1. **Generate API Token**:
- Go to **My Profile \> API Tokens \> Create Token**.
- Select **Read analytics and logs** template (or “Custom Token” with Zone \> Analytics \> Read).
- Scope: “All zones” or specific zones.
- Copy the **API Token** (e.g., xUL39zImSqAG5-JJNpLMC7HVIqGuckorb9AKo-Tx).
2. **Set Up Environment**:
- Configure a virtual environment:
```
python3 -m venv venv
source venv/bin/activate # Windows: venv\Scripts\activate
pip install requests
```
3. **Run the Script**:
- Save as cloudflare_logs_to_openobserve.py:
```py
import requests
import time
import json
from datetime import datetime, timedelta, timezone
import base64
import random
## Cloudflare config
API_TOKEN = "xUL39zImSqAG5-JJNpLMC7HVIqGuckorb9AKo-Tx" # Your token
EMAIL = "your-username@example.com" # Your email
ZONE_IDS = [] # Leave empty for all zones, or add ["zone_id_1"]
## OpenObserve config
OPENOBSERVE_URL = "https://api.openobserve.ai/api/your_organization_id/cloudflare_logs/_json"
OPENOBSERVE_USER = "your-username@example.com"
OPENOBSERVE_PASS = "your_password" # Your password
def simulate_cloudflare_logs():
methods = ["GET", "POST", "PUT"]
uris = ["/", "/api/users", "/checkout"]
statuses = [200, 404, 429, 503]
countries = ["US", "IN", "UK"]
return [{
"dimensions": {
"datetime": datetime.now(timezone.utc).isoformat(),
"clientRequestHTTPMethodName": random.choice(methods),
"clientRequestURI": random.choice(uris),
"edgeResponseStatus": random.choice(statuses),
"clientCountryName": random.choice(countries)
},
"sum": {
"bytes": random.randint(100, 5000),
"requests": random.randint(1, 5)
}
} for _ in range(random.randint(1, 5))]
def fetch_cloudflare_logs(zone_ids):
url = "https://api.cloudflare.com/client/v4/graphql"
headers = {
"X-Auth-Email": EMAIL,
"Authorization": f"Bearer {API_TOKEN}",
"Content-Type": "application/json"
}
end_time = datetime.now(timezone.utc)
start_time = end_time - timedelta(minutes=5)
zone_filter = f'zoneTag: "{zone_ids[0]}"' if zone_ids else ""
query = """
{
viewer {
zones(%s) {
httpRequests1mGroups(limit: 1000, filter: {datetime_geq: "%s", datetime_leq: "%s"}) {
dimensions {
datetime
clientRequestHTTPMethodName
clientRequestURI
edgeResponseStatus
clientCountryName
}
sum {
bytes
requests
}
}
}
}
}
""" % ("filter: {%s}" % zone_filter if zone_filter else "",
start_time.isoformat(), end_time.isoformat())
response = requests.post(url, headers=headers, json={"query": query})
if response.status_code != 200:
print(f"API Error: {response.status_code} - {response.text}")
return simulate_cloudflare_logs()
try:
data = response.json()
if not data or not data.get("data", {}).get("viewer", {}).get("zones"):
print("No logs yet—waiting for traffic. Using simulated data.")
return simulate_cloudflare_logs()
logs = []
for zone in data["data"]["viewer"]["zones"]:
logs.extend(zone["httpRequests1mGroups"])
return logs
except (json.JSONDecodeError, AttributeError):
print("API response issue. Switching to simulation.")
return simulate_cloudflare_logs()
def send_to_openobserve(logs):
if not logs:
print("No logs to send.")
return
auth_str = base64.b64encode(f"{OPENOBSERVE_USER}:{OPENOBSERVE_PASS}".encode()).decode()
headers = {"Authorization": f"Basic {auth_str}"}
payload = [log["dimensions"] | log["sum"] for log in logs]
response = requests.post(OPENOBSERVE_URL, headers=headers, json=payload)
print(f"Sent {len(payload)} logs at {datetime.now(timezone.utc)}: {response.status_code}")
if __name__ == "__main__":
print("Streaming Cloudflare logs to OpenObserve...")
while True:
try:
logs = fetch_cloudflare_logs(ZONE_IDS)
send_to_openobserve(logs)
time.sleep(60) # Poll every minute
except Exception as e:
print(f"Error: {e}")
logs = simulate_cloudflare_logs()
send_to_openobserve(logs)
time.sleep(60)
```
- Run with:
```
python cloudflare_logs_to_openobserve.py
```
- Logs transition from simulated to real after traffic starts (5-10 minutes).
- **Note**: Use nohup python script.py for background streaming.
### **Option 2: Logpush (Enterprise Only)**
1. **Generate API Token**:
- Go to **My Profile \> API Tokens \> Create Token**.
- Select **Edit Logs** template (or “Custom Token” with Account \> Logs \> Edit).
- Scope: Your account or specific zones.
- Copy the **API Token**.
2. **Configure Logpush**:
- Navigate to **Analytics & Logs \> Logpush** (or **Logs \> Logpush**).
- Click **Create a Logpush Job**.
- Choose **HTTP Requests** dataset (or another like Firewall Events).
- Select **HTTP** destination.
- Enter:
```
https://api.openobserve.ai/api/your_organization_id/cloudflare_logs/_json
```
- Add **Authorization Header**:
- Key: Authorization
- Value: Basic \
- Encode credentials (e.g., your-username@example.com:802gZ3uo4N5S917s6Med):
```
echo -n "your-username@example.com:802gZ3uo4N5S917s6Med" | base64
```
- Save-logs stream immediately.
---
## Step 4: Verify Logs in OpenObserve
Check OpenObserve:
- Log in to [cloud.openobserve.ai](https://cloud.openobserve.ai).
- Go to **Logs \> cloudflare_logs**.
- You should see structured logs like:
```
{
"_timestamp": 1742220353596180,
"bytes": 2109,
"clientcountryname": "IN",
"clientrequesthttpmethodname": "POST",
"clientrequesturi": "/",
"datetime": "2025-03-17T14:05:53.447689+00:00",
"edgeresponsestatus": 503,
"requests": 1
}
```
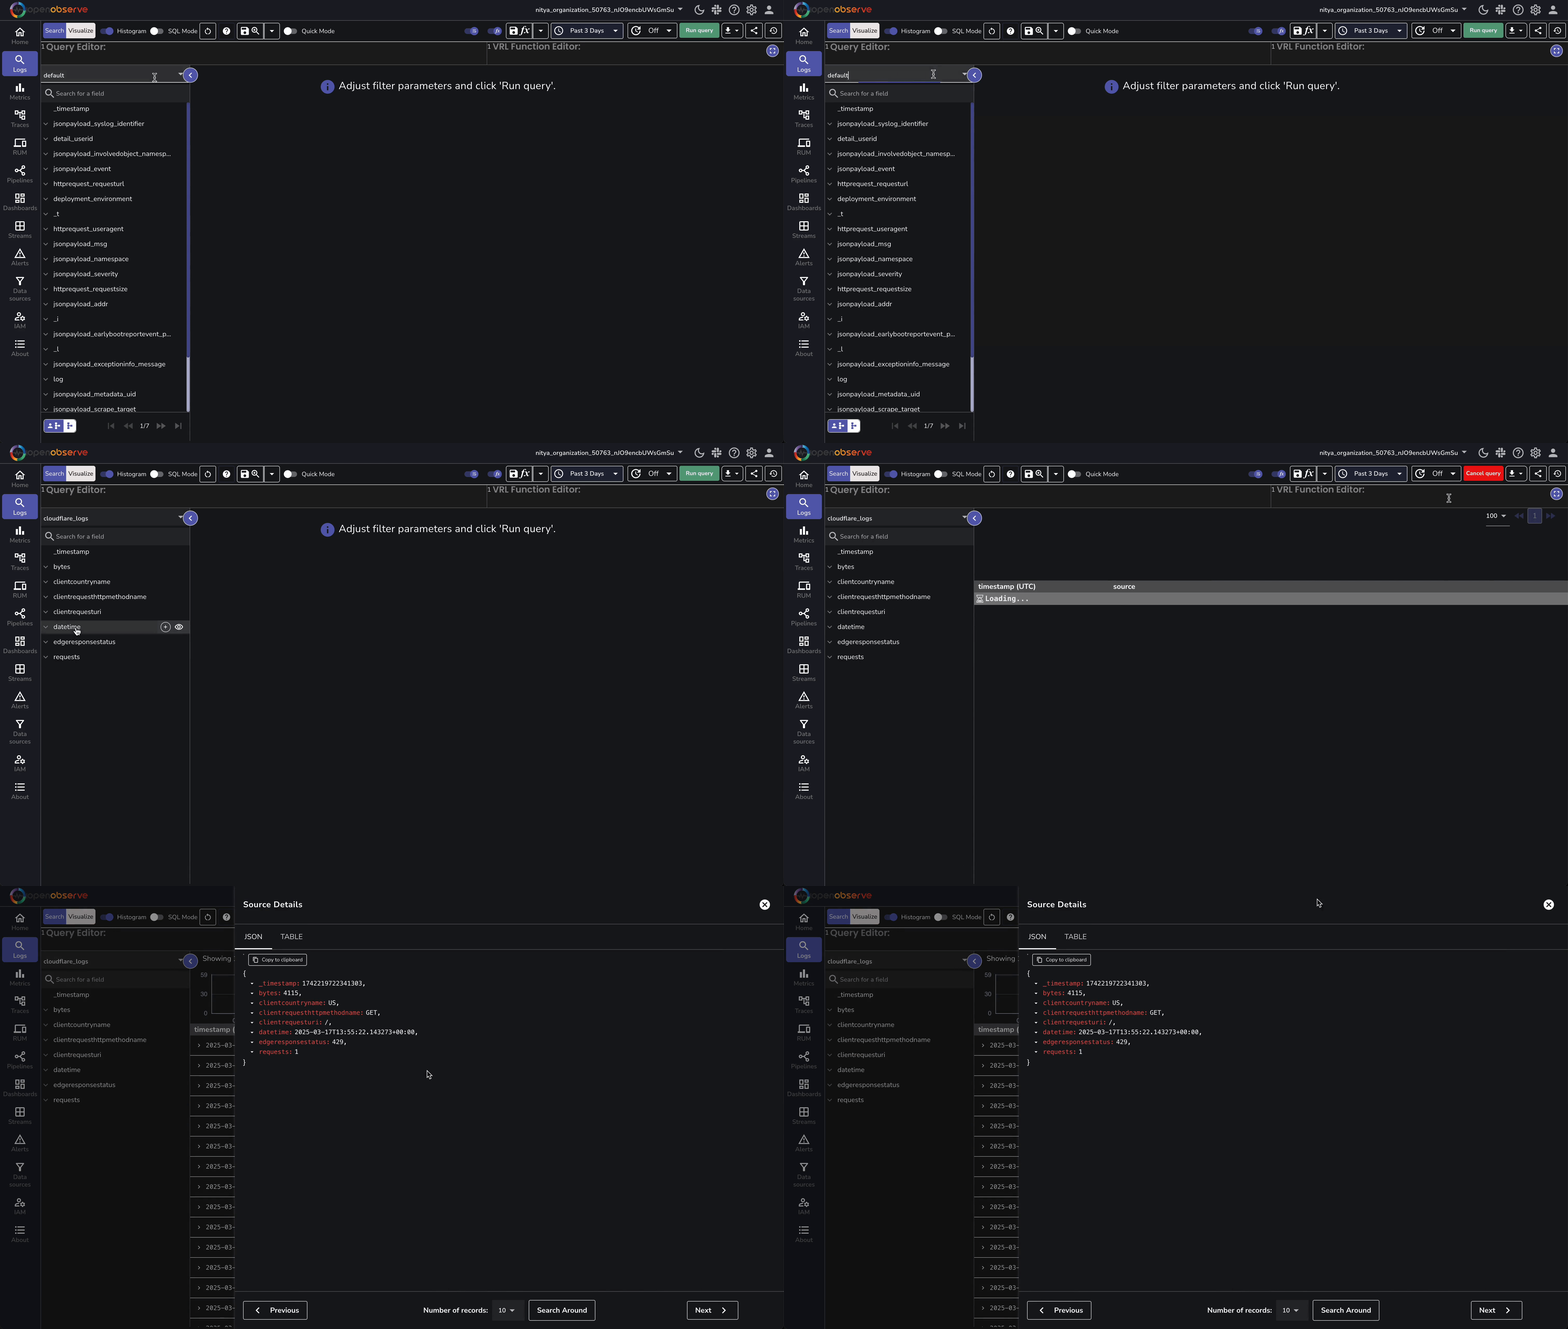
With our GraphQL example, this data is initially simulated, with the real logs following 5-10 minutes later. If you’re using Logpush, you will see instant logs.
### **Troubleshooting**
1. **GraphQL**: “No logs yet”-check traffic in **Analytics \> Traffic**. “API Error”-verify response.text.
2. **Logpush**: Confirm endpoint and auth in Logpush settings.
3. **No Data**: Validate org ID (e.g., nitya_organization_50763_nJO9encbUWsGmSu) and credentials.
---
You’ve built a robust Cloudflare log monitoring system with OpenObserve, using either the GraphQL API or Logpush to streamline the process. Now, you have deep visibility into your traffic-request details, response codes, and security events-all in one place. Whether you’re on Free, Pro, Business, or Enterprise, this setup allows you to monitor your Cloudflare logs.
With your Cloudflare logs streaming into OpenObserve, you can further process them using [pipelines](https://openobserve.ai/pipelines/), visualize them using [interactive dashboards](https://openobserve.ai/visualization-and-dashboards/), or set up [custom alerts](https://openobserve.ai/alerts/) to proactively assess and mitigate potential issues with your application.
Want to learn more or need assistance? Join our [Slack community](https://short.openobserve.ai/community) or reach out directly.