# DataDog vs OpenObserve Part 3: Traces & APM Comparison
> DataDog vs OpenObserve APM comparison: $120/day LLM charge, SQL trace dashboards, OTel native, service dependency mapping, and 60-90% cost savings with real data.
Source: https://openobserve.ai/blog/datadog-vs-openobserve-part-3-traces-apm/
Published: 2025-12-23
Authors: Manas Sharma
Category: Engineering
Tags: Comparisons, OpenObserve, OpenTelemetry
---
## DataDog vs OpenObserve Part 3: Traces & APM: OTel Native, No Hidden Tiers, Up to 90% Cost Savings
DataDog charges per APM host, per indexed span, with automatic premium tiers for LLM traces. OpenObserve flips this model: predictable costs, SQL queries for trace visualization, no feature-based pricing. Same distributed tracing capabilities and up to 90% lower costs.
Beyond pricing, query flexibility and feature transparency matter. SQL support for trace dashboards, automatic span indexing, and OpenTelemetry-native compatibility directly impact how teams debug distributed systems and visualize trace data.
This hands-on comparison tests DataDog and OpenObserve as APM and distributed tracing platforms, sending identical production-like trace data to both platforms simultaneously. The results show how these platforms handle LLM observability, span indexing, trace search, and cost structure with the same production-like data.
Evereve, a fashion retail company, achieved 90% cost savings migrating from DataDog to OpenObserve for their full observability stack. They didn't sacrifice visibility but instead eliminated automatic premium tier surprises. Full trace retention, SQL-based dashboards, and accurate cost forecasting became possible.
This is Part 3 in a series comparing DataDog and OpenObserve for observability(security use cases excluded):
- **[Full comparison](https://openobserve.ai/openobserve-vs-datadog/)**
- [Part 1: Logs](https://openobserve.ai/blog/datadog-vs-openobserve-log-management/) - Automatic Field Discovery, SQL Queries, and 90% Cost Savings
- [Part 2: Metrics](https://openobserve.ai/blog/datadog-vs-openobserve-part-2-metrics/) - Drag & Drop, SQL, PromQL, High Cardinality
- Part 3: Traces/APM- OTel Native, No Hidden Tiers
- [Part 4: Dashboards](https://openobserve.ai/blog/datadog-vs-openobserve-part-4-dashboards/)- Prebuilt, Drag & Drop, Custom
- [Part 5: Alerts, Monitors, Destinations](https://openobserve.ai/blog/datadog-vs-openobserve-part-5-alerts/)
- [Part 6: Real User Monitoring](https://openobserve.ai/blog/datadog-vs-openobserve-rum/)
- [Part 7: Pipelines](https://openobserve.ai/blog/datadog-vs-openobserve-part-7-pipelines/)
- [Part 8: IAM (SSO, RBAC)](https://openobserve.ai/blog/datadog-vs-openobserve-iam-rbac/)
- [Part 9: Cost](https://openobserve.ai/blog/datadog-vs-openobserve-part-9-cost/)
---
---
## TL;DR: 8 Key Findings
1. **LLM Observability Premium**: 232 LLM spans triggered $120/day automatic charge in DataDog. OpenObserve treats LLM traces as standard traces with no premium pricing.
2. **Span Indexing**: DataDog charges per indexed span with retention filters. OpenObserve uses flat $0.50/GB for all spans with configurable retention.
3. **Service Maps**: Both auto-generate service topology and dependencies. Feature parity.
4. **Trace Search**: DataDog uses tag-based proprietary syntax. OpenObserve supports SQL queries plus UI filters.
5. **Error Tracking**: Both identify errors, aggregate, and support root cause analysis. Feature parity.
6. **APM Host Charges**: DataDog charges $36/day per APM host. OpenObserve has no per-host charges.
7. **OpenTelemetry Native**: OpenObserve provides full OTel compatibility without proprietary agents. DataDog requires DataDog Agent for full functionality.
8. **Cost Reality**: Teams are reducing their total cost of observability by 60-90% moving from DataDog to OpenObserve without sacrificing visibility.
## What We Tested
The test used the OpenTelemetry Astronomy Shop demo: a 16-service microservices application with Kafka, PostgreSQL, Valkey cache, and an LLM service for AI-powered features.
**Traces collected**: HTTP server/client spans, database queries, cache operations, RPC calls, message queue spans, and 232 LLM API call spans.
Total: ~49,100 indexed spans across distributed traces.
All services used OpenTelemetry SDKs sending traces to the OTel Collector, which exported to both platforms simultaneously.
## The $120/Day LLM Observability Charge
Modern applications integrate AI features: product recommendations, chat interfaces, content generation. These make API calls to LLM providers (OpenAI, Anthropic, Cohere, or self-hosted). When instrumented with OpenTelemetry, LLM calls generate traces like HTTP requests or database queries.
The test LLM service made **232 LLM spans**. These included metadata identifying them as LLM API interactions (span names like `llm.generate`, attributes like `llm.model`, `llm.prompt_tokens`).
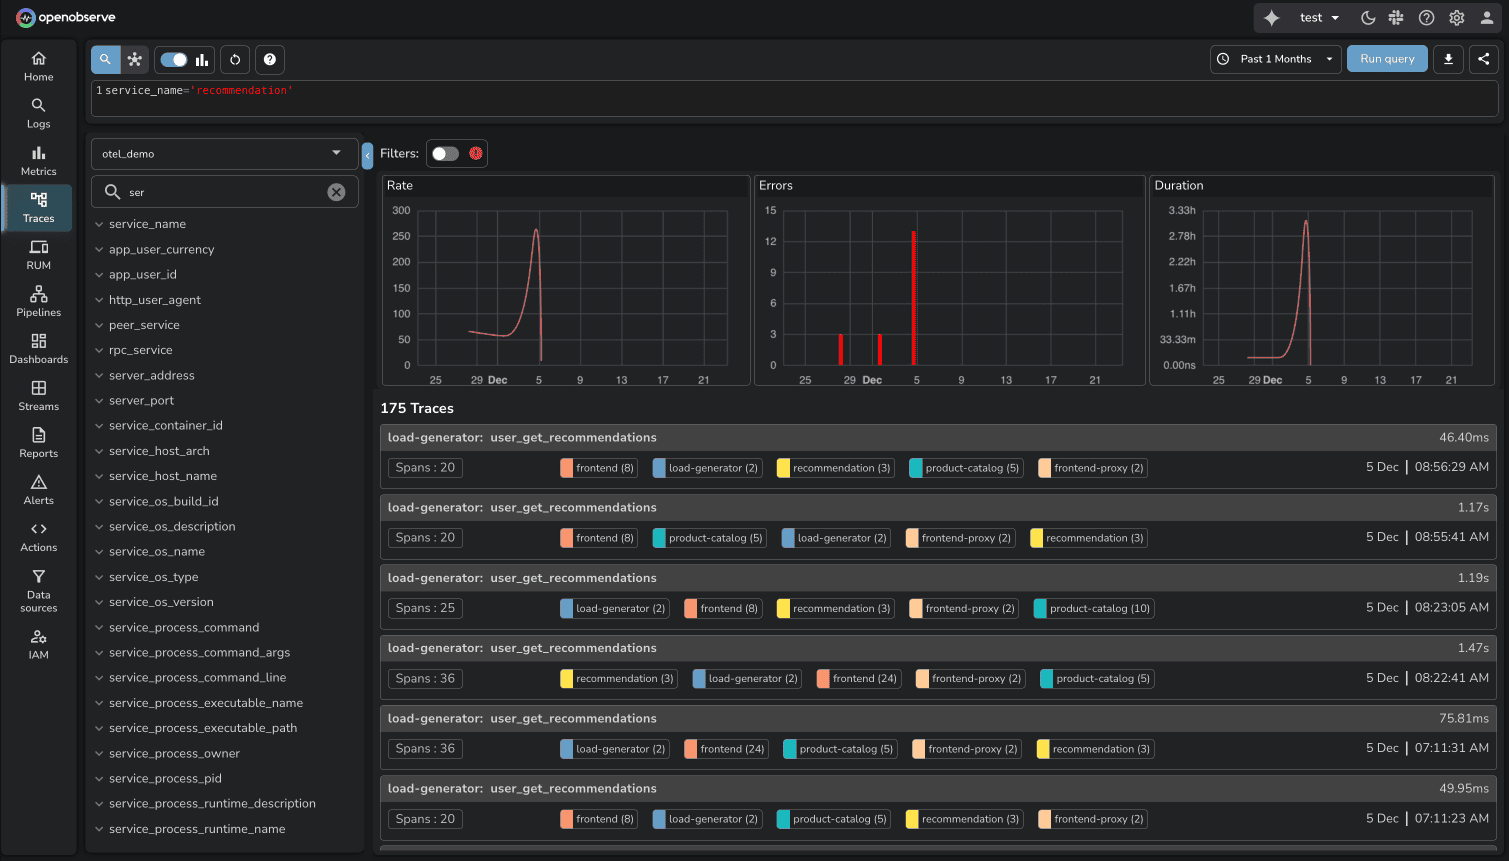
**In OpenObserve, these appeared in the traces UI like any other span.** Search, filter, analyze latency, view request flows. LLM traces are traces. No special classification. No premium pricing.
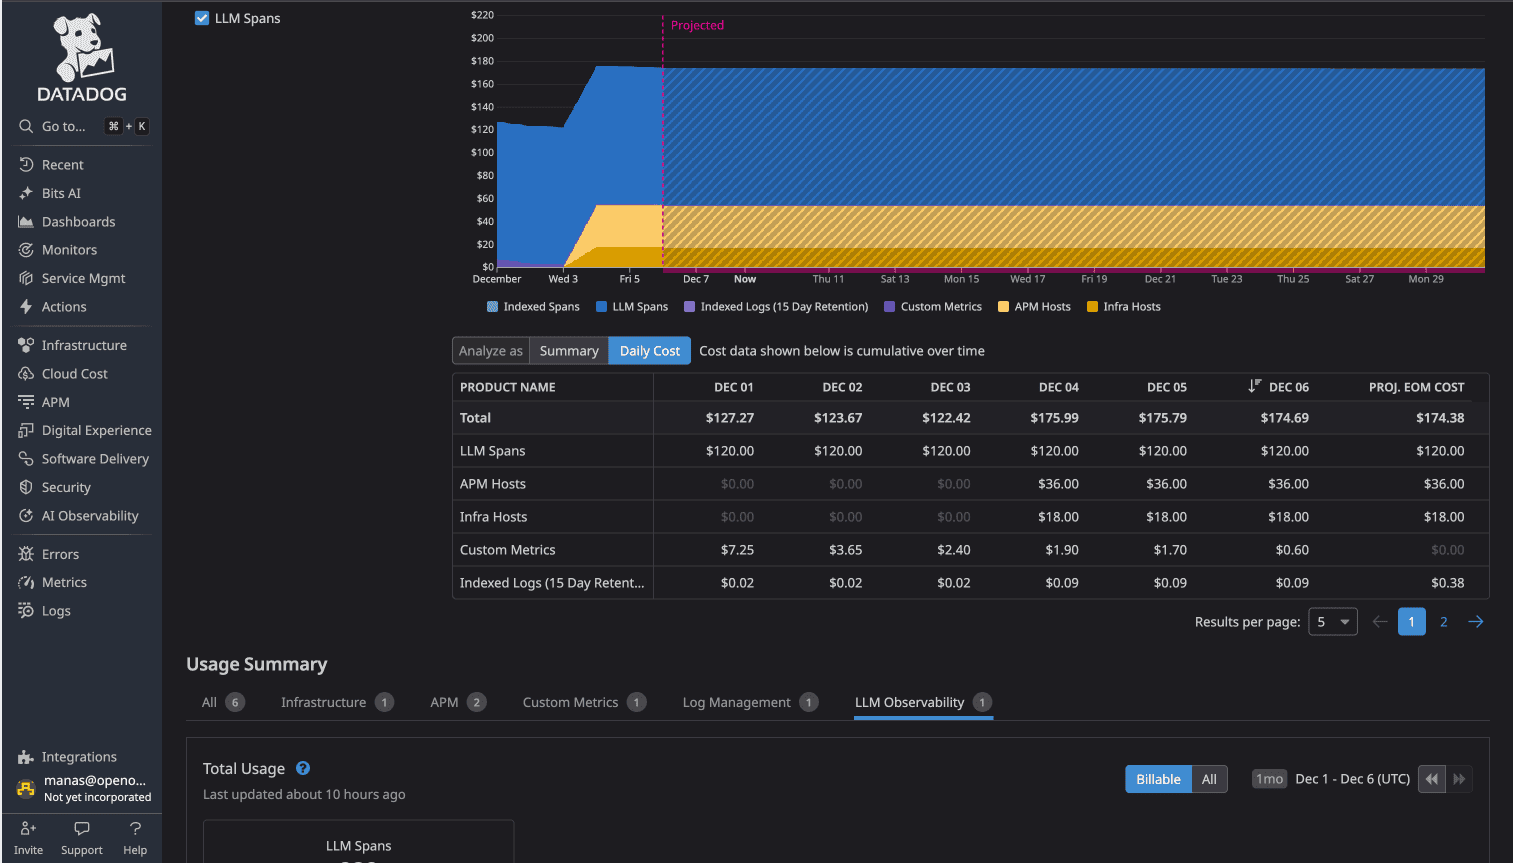
**In DataDog**, these 232 spans automatically activated **LLM Observability**, a premium feature. The cost: **$120 per day**.
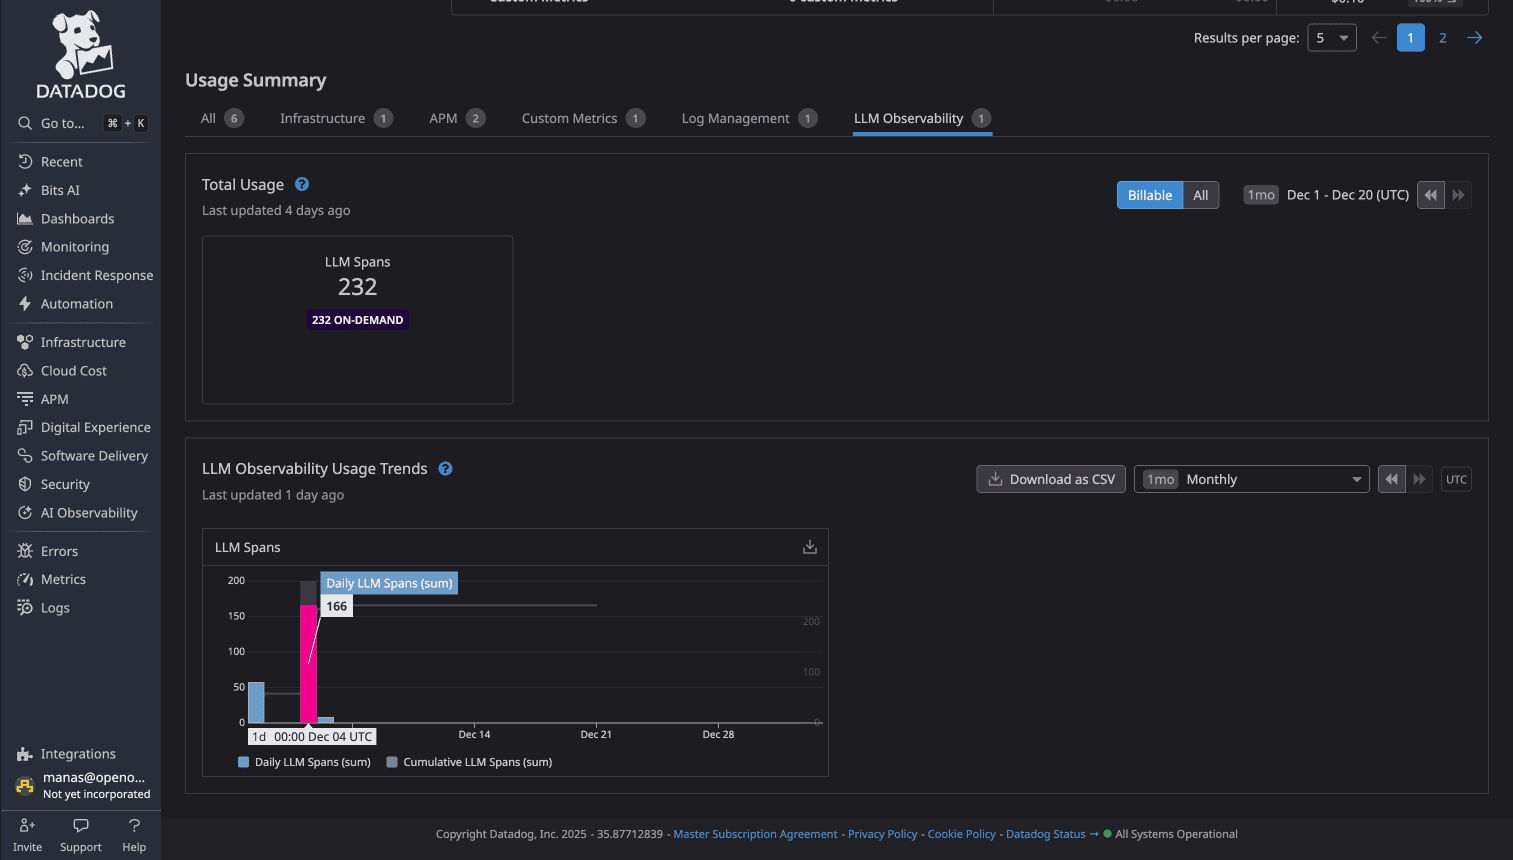
This activation happened automatically. No warning. No opt-in. DataDog detected LLM span attributes and enabled the premium feature. Over a month: **$3,600** for LLM trace observability.
### Why This Matters
The LLM charge illustrates feature-based tier pricing. Teams instrument services with OpenTelemetry expecting standard costs. Specific span types trigger premium charges.
This creates unpredictability: adding AI features adds $3,600/month in observability costs before the first production request.
**OpenObserve eliminates feature tiers for traces.** LLM spans, HTTP spans, database spans cost $0.50/GB ingested. Add AI features. Instrument with OpenTelemetry. Cost scales with data volume, not feature classification.
## Span Indexing and Retention
**DataDog uses retention filters** to control which spans are indexed and searchable. Configure filters based on span attributes. Spans matching filters are indexed. Others are sampled or dropped.
In the test:
- APM Hosts: $36/day (1 host)
- Indexed Spans: 137 spans
The 137 indexed spans represent head-based sampling and retention filtering from ~49,100 total spans. DataDog's sampling reduced storage costs but limited trace visibility (99.7% of traces not searchable).
**OpenObserve indexes all ingested spans** at $0.50/GB. Configure retention per stream after ingestion. All spans are searchable during retention.
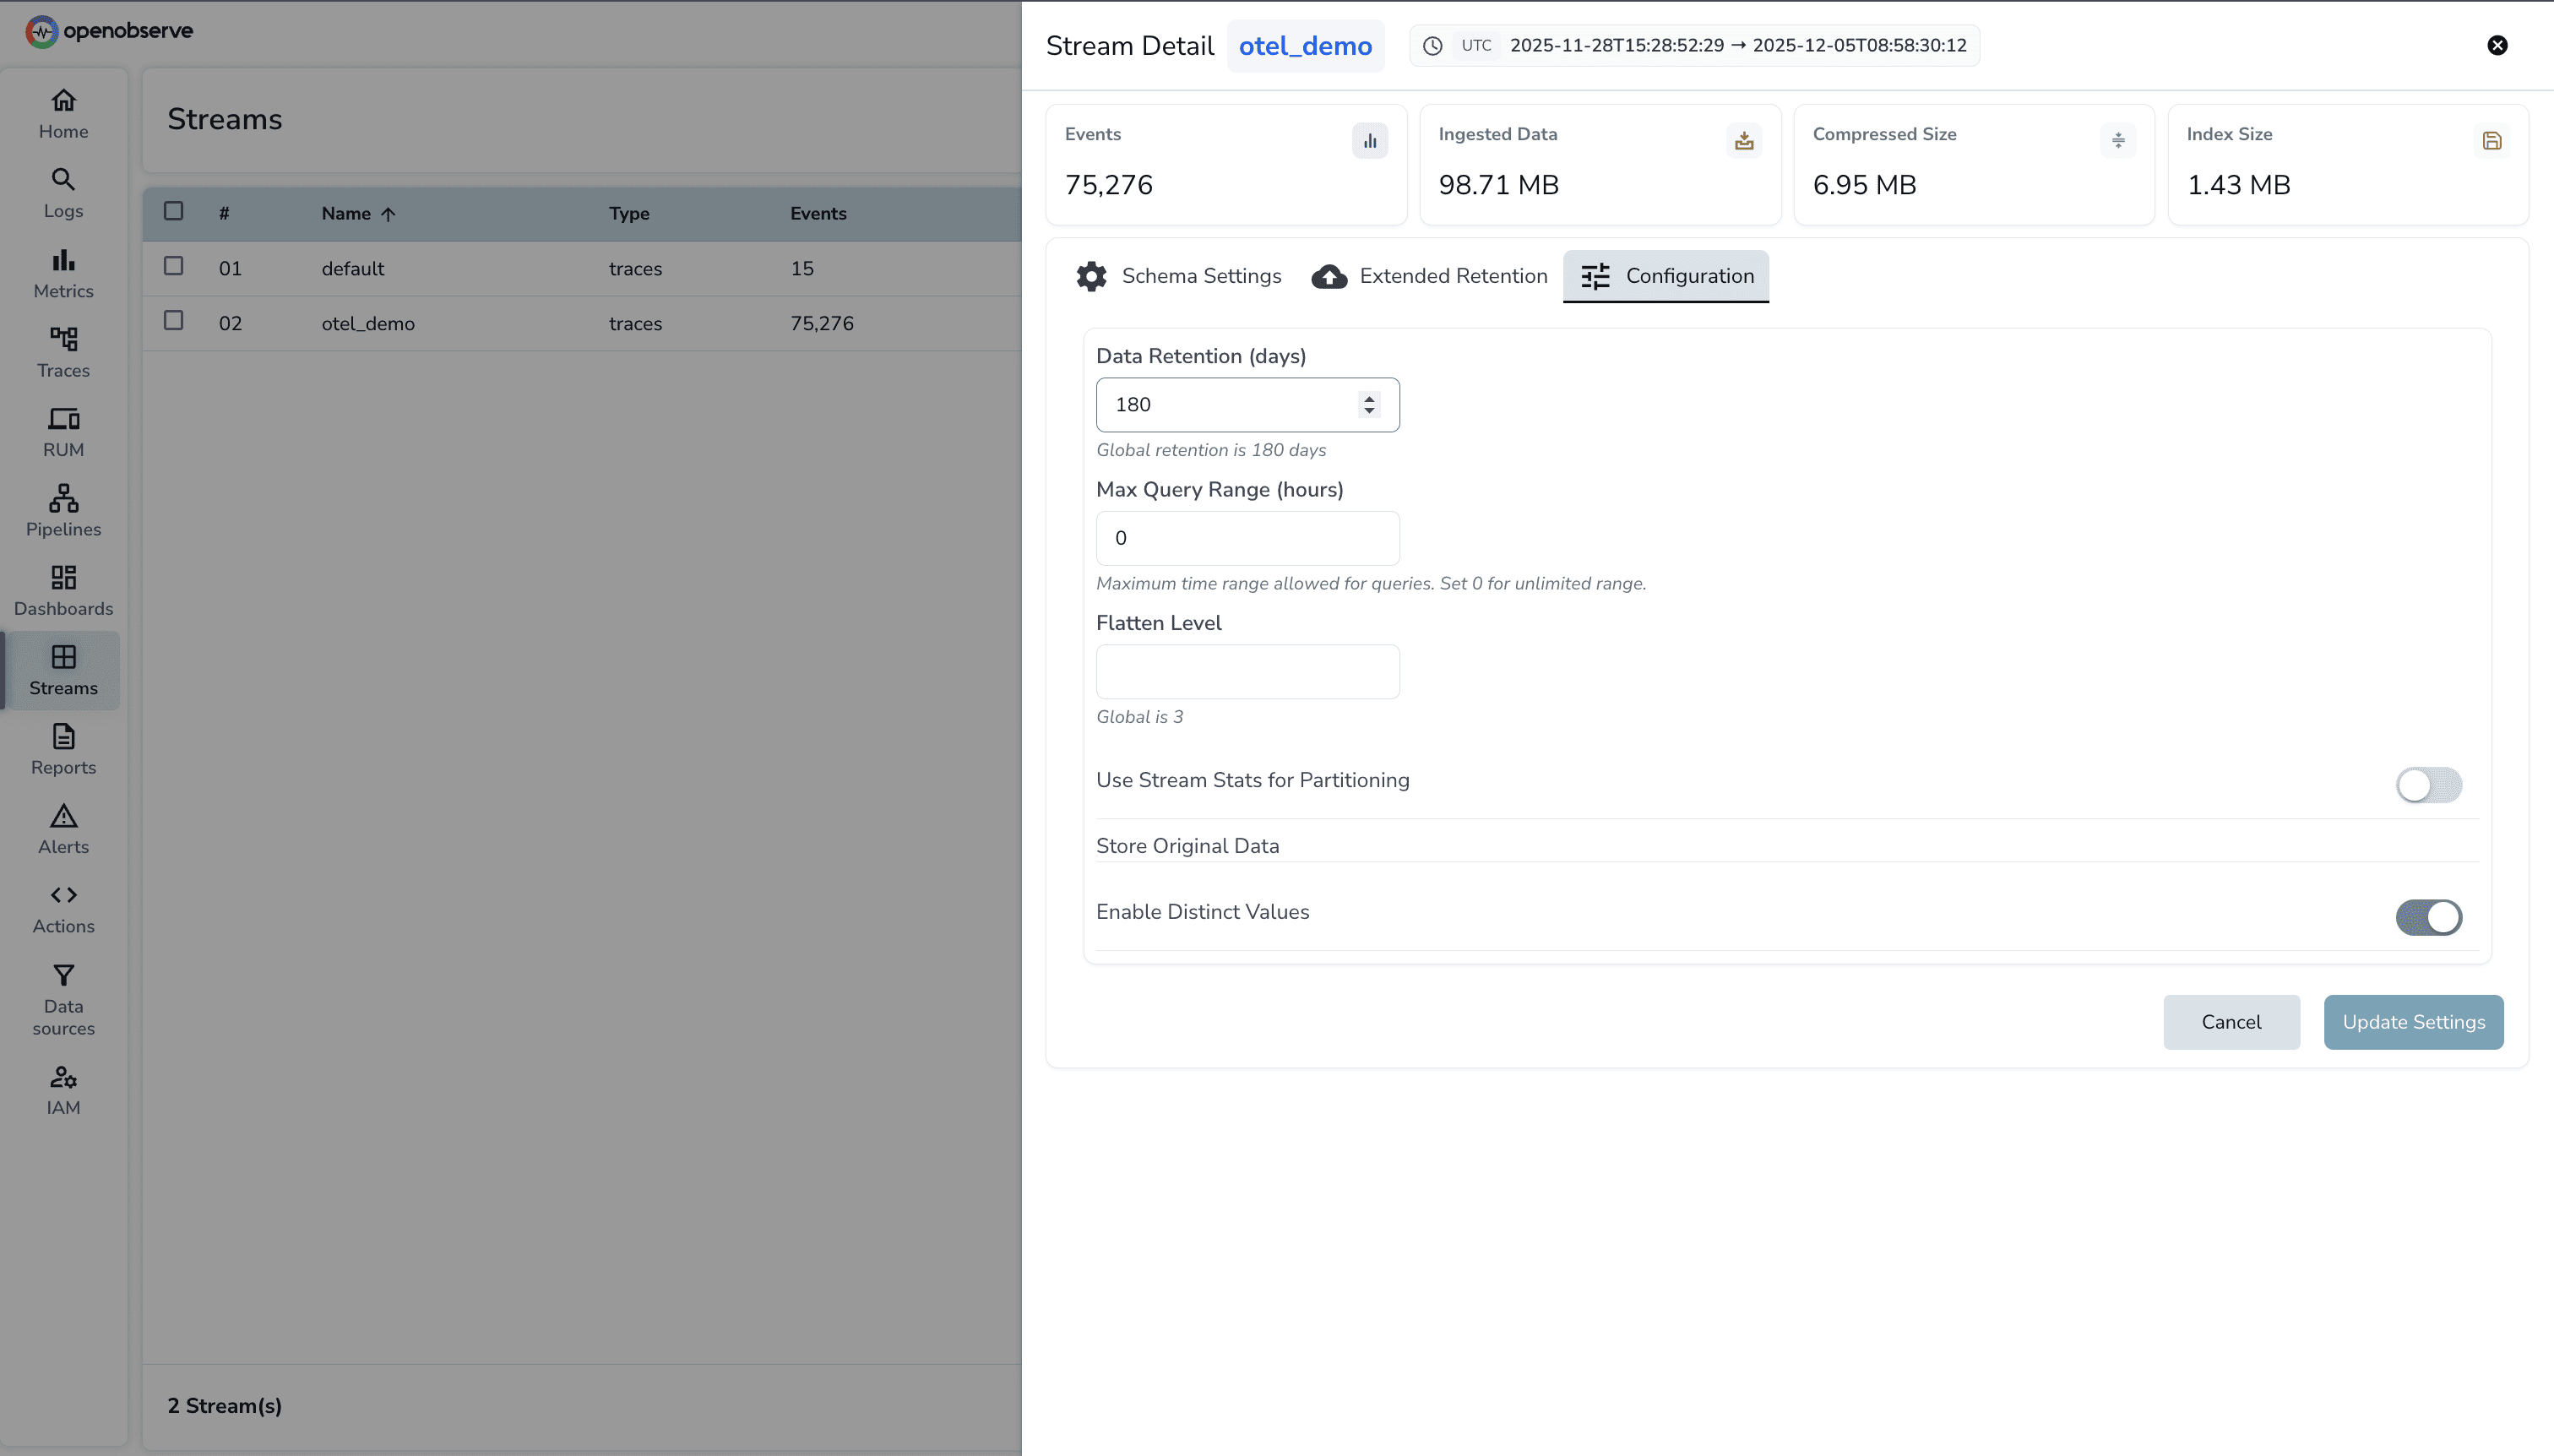
For debugging production issues, complete trace history matters. OpenObserve provides full visibility during configured retention windows.
## Service Maps and Dependencies
_Service Maps: OSS and Enterprise. Service Graph: Enterprise._
Both platforms auto-generate service topology from traces.
**DataDog's Service Map** visualizes dependencies based on observed traces. Services appear as nodes, requests as edges. Shows request rates, error rates, latency per service.

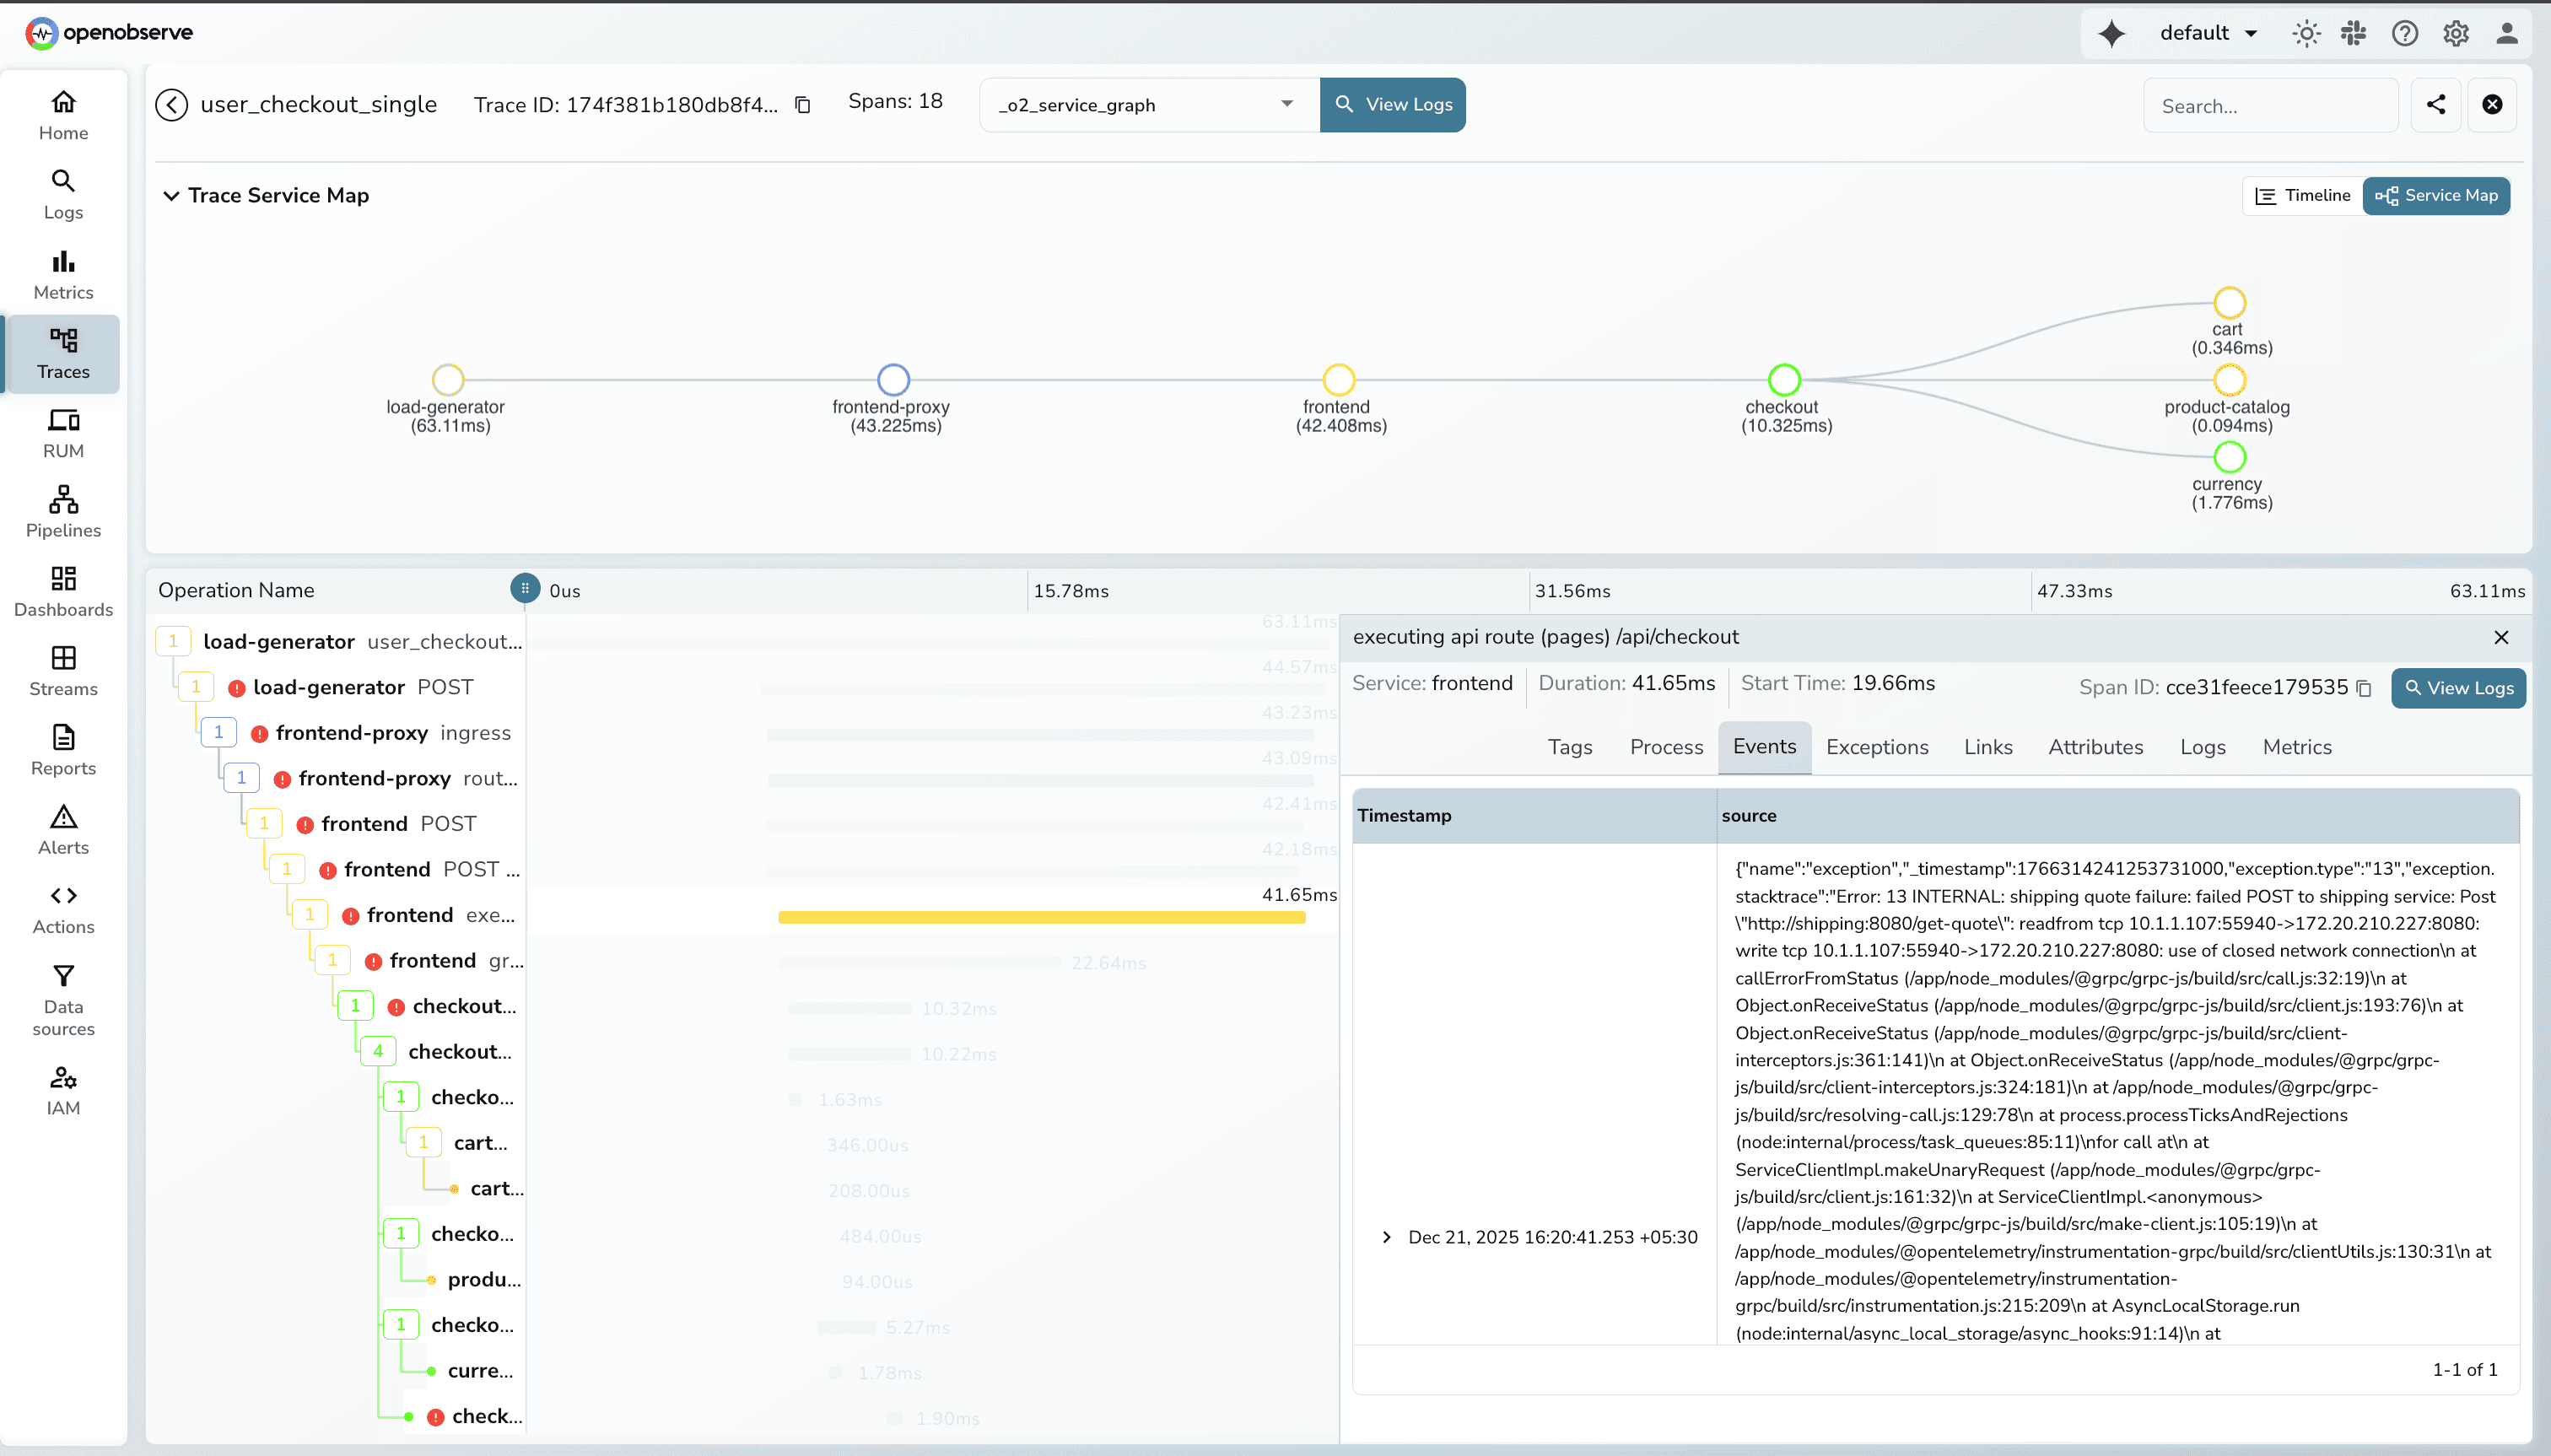
**OpenObserve provides **Service Map** and **Service Graph\*\* with real-time topology and performance metrics overlaid. Interactive exploration of dependencies.

## Trace Search and Filtering
_Available in OSS and Enterprise Edition._
**DataDog uses tag-based search** with proprietary syntax:
```
service:frontend operation_name:http.request status:error duration:>1s
```
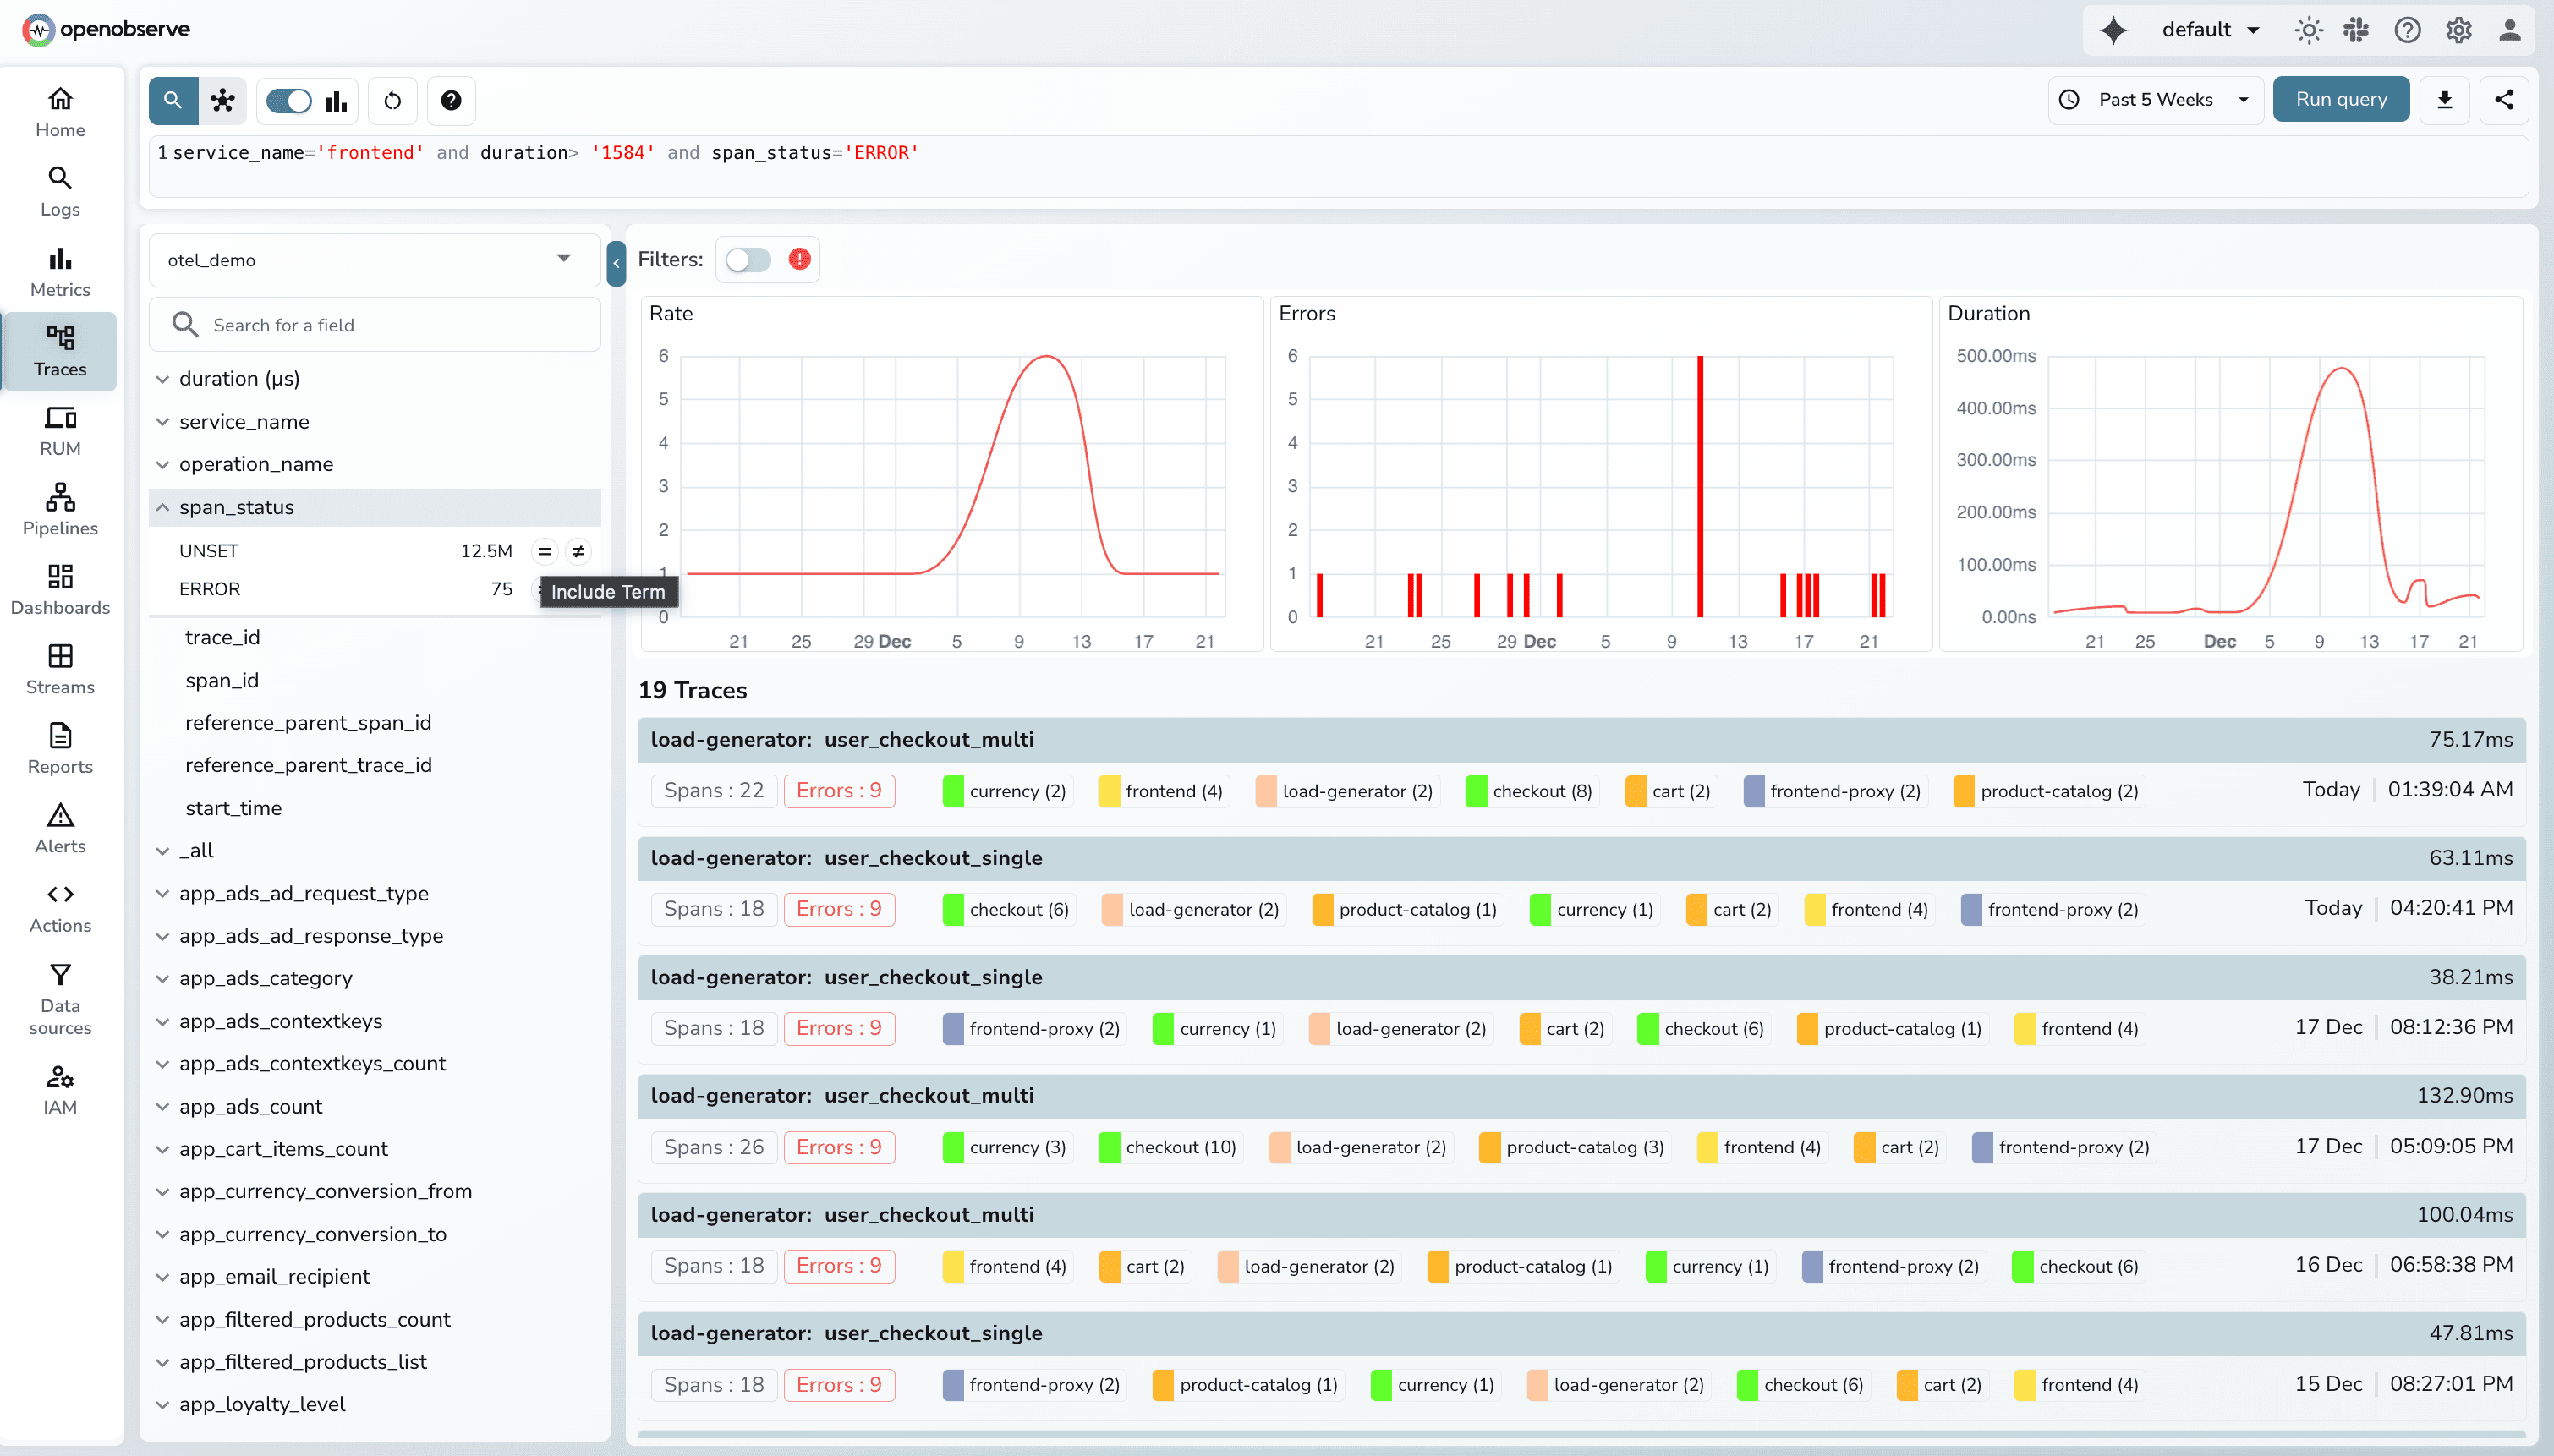
**OpenObserve provides Quick Mode** for trace search with intuitive UI interactions. Sidebar filters (service, operation, status, duration) and attribute-based filtering let teams search traces without writing queries. Click to filter by any span attribute.
For complex analysis, **OpenObserve dashboards support SQL queries on trace data**. Build visualizations showing trace patterns, latency distributions, or error trends using SQL:
```sql
SELECT histogram(_timestamp) as "x_axis_1", count(duration) as "y_axis_1" FROM "default" GROUP BY x_axis_1 ORDER BY x_axis_1 ASC
```
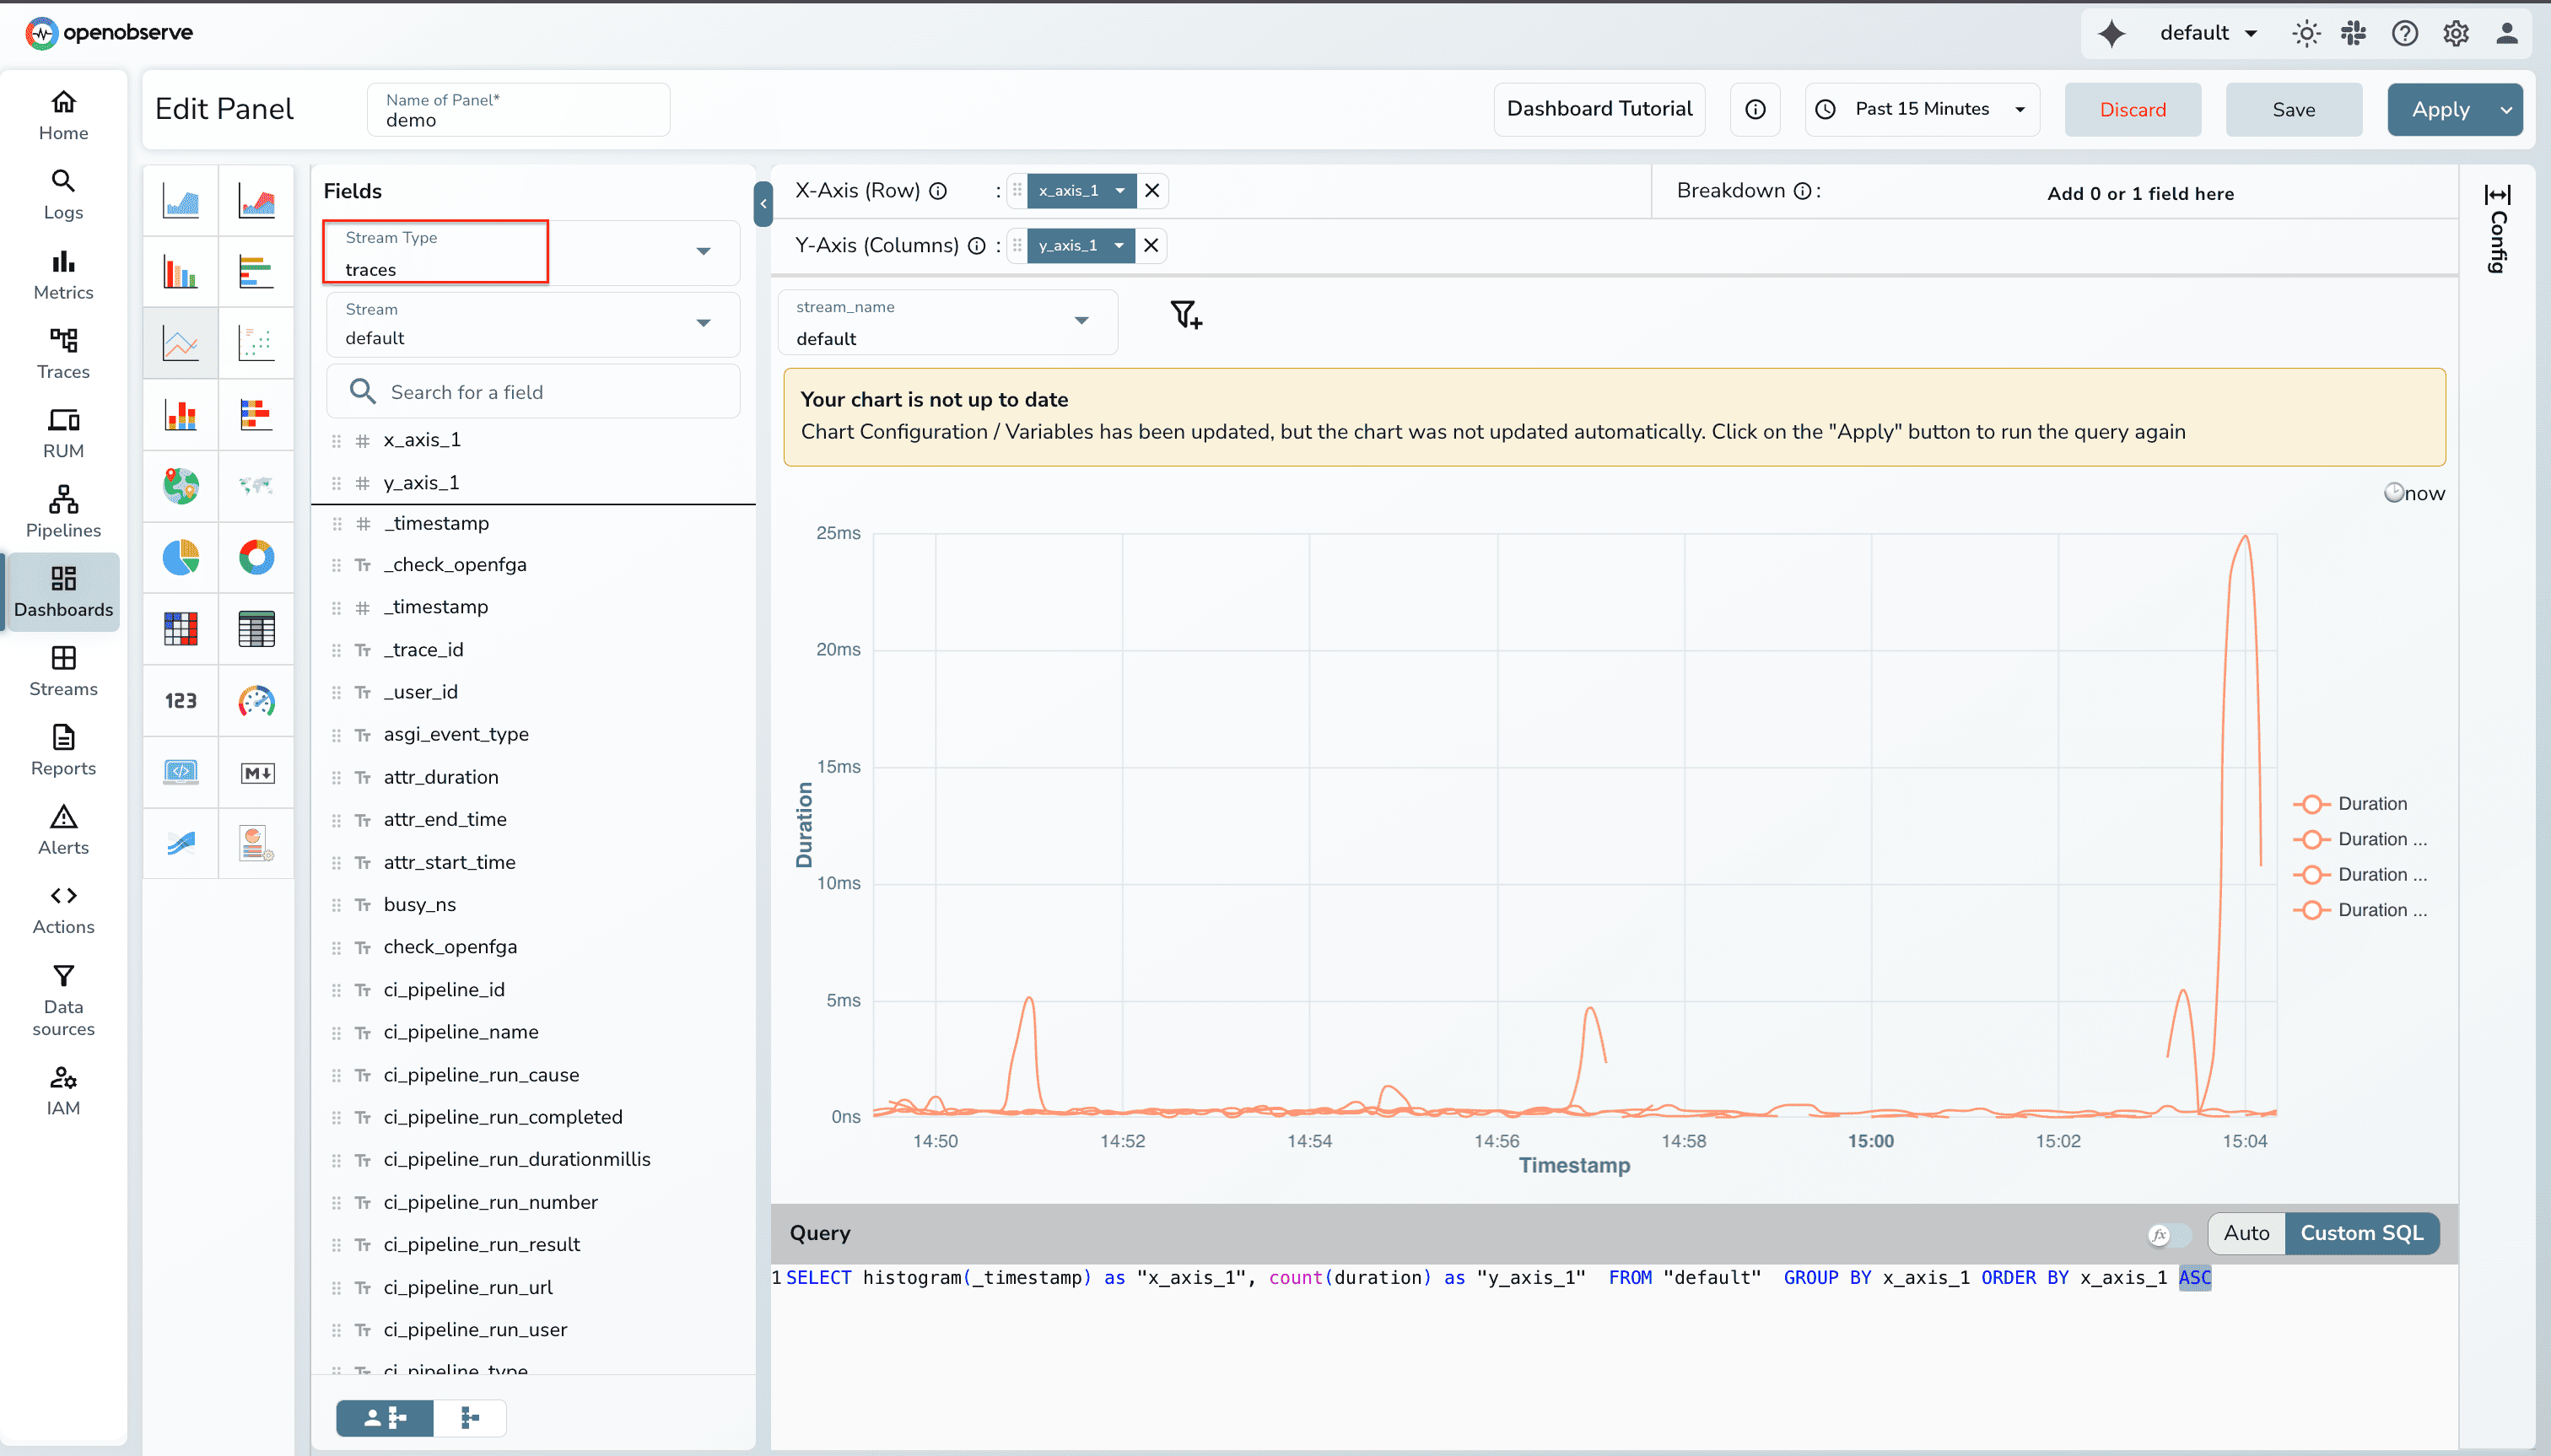
This separation is intentional: UI filters for quick trace searches, SQL for dashboard visualizations. OpenObserve dashboards support SQL for both logs and traces, enabling correlation and custom analytics.
## Error Tracking
Both identify error spans (HTTP 5xx, database failures, exceptions) and aggregate for analysis.
**DataDog** groups errors by service, operation, error type. Shows error rates in service maps and dashboards.
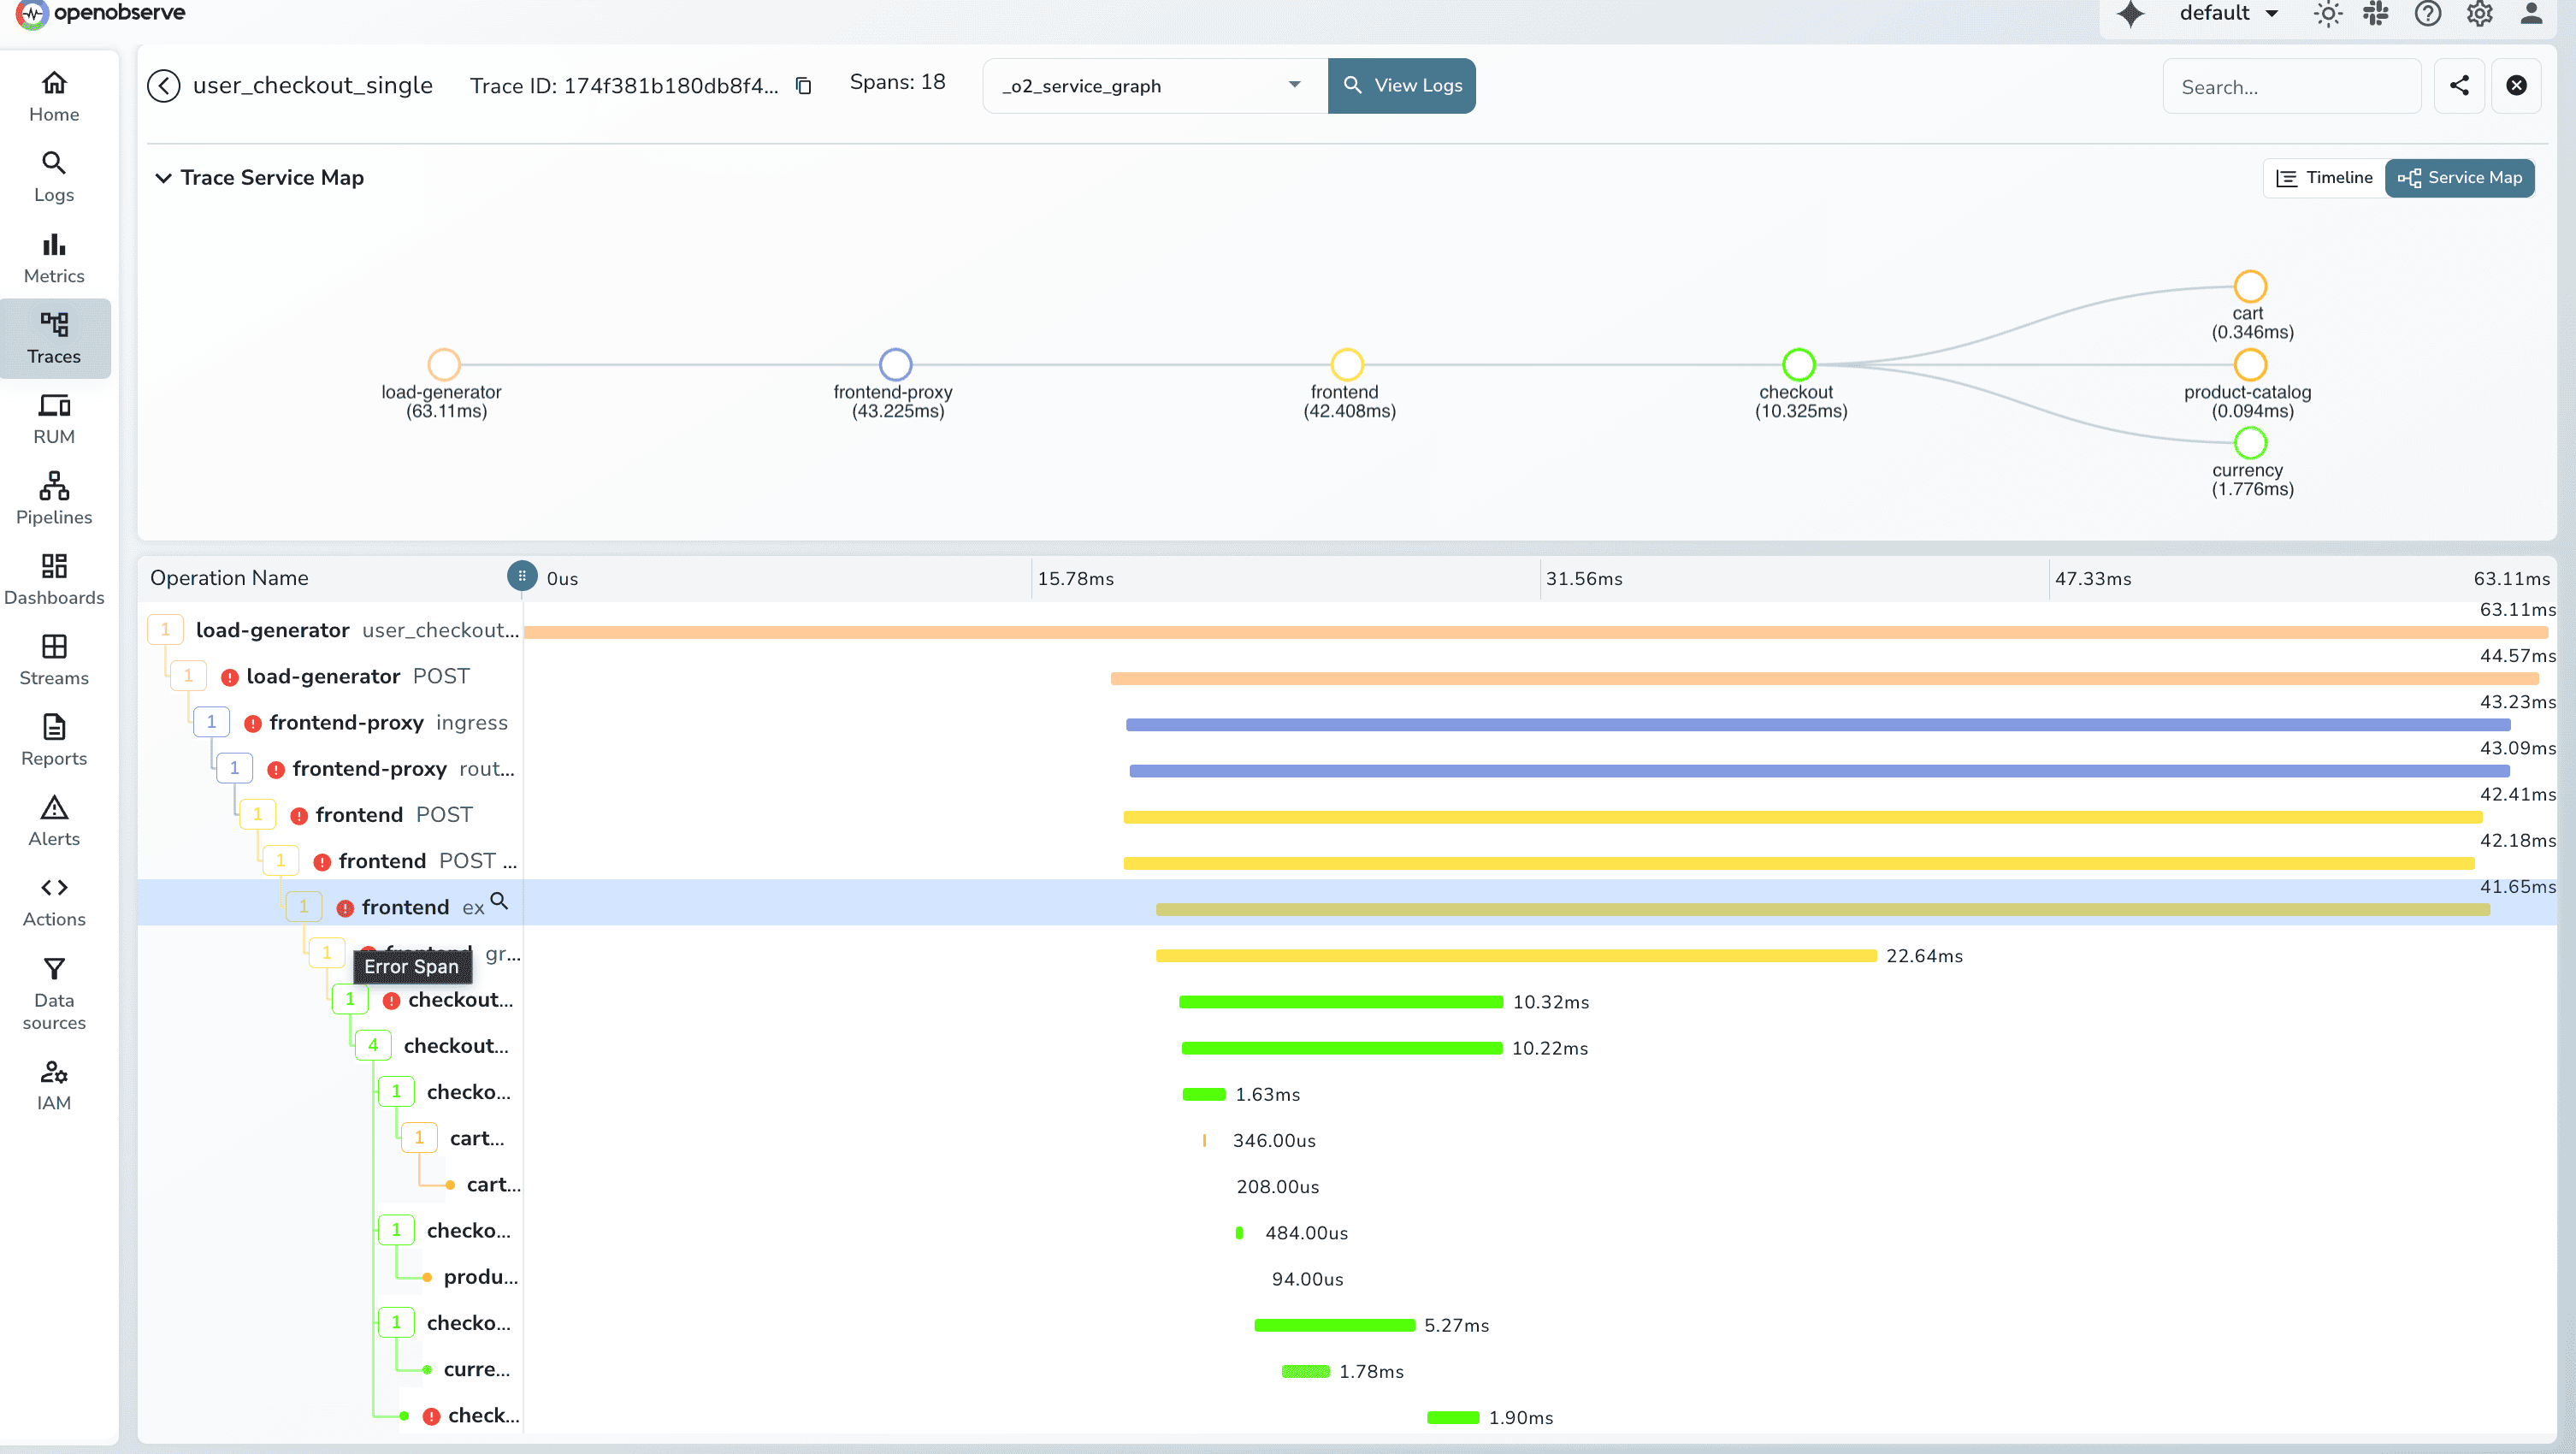
**OpenObserve** similarly identifies error spans, aggregates by service/operation, and provides drill-down to error correlated logs and metrics and Gantt chart views show error spans in request flow context.
## Quick Comparison
| Capability | DataDog | OpenObserve |
| ------------------------------ | ------------------------------------------------------------------------------------ | ------------------------------------------------- |
| **LLM Observability** | $120/day premium tier (232 LLM spans triggered automatic charge) | Standard traces, no premium pricing |
| **Span Indexing** | Retention filters, per-host charges ($36/day per host, 137 of ~49,100 spans indexed) | Flat $0.50/GB, all spans indexed |
| **Service Dependency Mapping** | Auto-generated topology | Service Graph + Service Map |
| **Trace Search** | Tag-based proprietary syntax | Quick Mode UI filters + attribute-based filtering |
| **Trace Dashboards** | Proprietary query syntax | SQL for trace visualizations |
| **Error Tracking** | Aggregated errors, drill-down | Aggregated errors, Gantt views |
| **APM Host Charges** | $36/day per APM host (1 host = $36/day) | No per-host charges |
| **OpenTelemetry Native** | Supported, DD Agent preferred for full functionality | Full OTel compatibility, no proprietary agents |
| **Total Test Cost** | $174/day (all observability: LLM $120 + APM $36 + Infrastructure $18) | $3.00/day (all observability) |
## Cost Breakdown: DataDog vs OpenObserve for APM
DataDog's APM pricing combines per-host charges, indexed span fees, and premium feature tiers.
### DataDog APM Costs
**LLM Observability**: $120/day (triggered by 232 LLM spans)
**APM Hosts**: $36/day (1 host sending traces)
**Indexed Spans**: 137 spans from ~49,100 total
**Total DataDog** (all observability): **$174/day**
- LLM Observability: $120/day
- APM Hosts: $36/day
- Infrastructure Hosts: $18/day
- Indexed Logs: $0.09/day
### OpenObserve APM Costs
**Flat rate**: $0.50 per GB ingested for all traces. No APM host charges. No premium tiers. No separate billing for LLM spans.
**Total OpenObserve** (all observability): **$3.00/day**
### The Difference
**58x cost difference (more than 98% cost savings)** for identical observability data.
### Why This Matters
- **No Feature Tier Surprises**: All traces priced at $0.50/GB (HTTP, database, RPC, LLM, message queue)
- **No Per-Host Multipliers**: Costs scale with data volume, not infrastructure count
- **Full Trace Retention**: All spans indexed and searchable, not sampled subsets
- **Predictable Scaling**: Adding AI features increases costs linearly with data, not exponentially through feature tiers
The 90% savings [Evereve achieved](https://openobserve.ai/customer-stories/evereve-customer-story/) extends to APM and distributed tracing.
## The Bottom Line
If evaluating APM platforms, **open-source DataDog alternatives for distributed tracing**, or OpenTelemetry-native observability, OpenObserve delivers:
1. **No premium feature tiers**: LLM traces, database spans, HTTP requests all priced at $0.50/GB
2. **SQL trace search**: complex filters, joins, aggregations
3. **OpenTelemetry native**: full OTel compatibility without proprietary agents
4. **No per-host APM charges**: costs scale with data, not infrastructure
5. **Up to 90% cost savings**
For platform engineers managing OpenTelemetry-instrumented microservices, these differences matter. No cost anxiety about AI features. No host-based multipliers. No sampling that sacrifices visibility.
---
- **[Full comparison](https://openobserve.ai/openobserve-vs-datadog/)**
- [Part 1: Logs](https://openobserve.ai/blog/datadog-vs-openobserve-log-management/) - Automatic Field Discovery, SQL Queries, and 90% Cost Savings
- [Part 2: Metrics](https://openobserve.ai/blog/datadog-vs-openobserve-part-2-metrics/) - Drag & Drop, SQL, PromQL, High Cardinality
- Part 3: Traces/APM- OTel Native, No Hidden Tiers
- [Part 4: Dashboards](https://openobserve.ai/blog/datadog-vs-openobserve-part-4-dashboards/)- Prebuilt, Drag & Drop, Custom
- [Part 5: Alerts, Monitors, Destinations](https://openobserve.ai/blog/datadog-vs-openobserve-part-5-alerts/)
- [Part 6: Real User Monitoring](https://openobserve.ai/blog/datadog-vs-openobserve-rum/)
- [Part 7: Pipelines](https://openobserve.ai/blog/datadog-vs-openobserve-part-7-pipelines/)
- [Part 8: IAM (SSO, RBAC)](https://openobserve.ai/blog/datadog-vs-openobserve-iam-rbac/)
- [Part 9: Cost](https://openobserve.ai/blog/datadog-vs-openobserve-part-9-cost/)
---
Prefer to try it locally first? The entire OpenObserve install is one command:
[Sign up for a free cloud trial](https://cloud.openobserve.ai/) or [schedule a demo](https://openobserve.ai/demo/) to test OpenObserve with your traces.