# Distributed Tracing in Node.js Applications with OpenTelemetry
> Learn how to implement distributed tracing in your Node.js applications using OpenTelemetry. Complete guide covering auto & manual instrumentation, trace visualization, and monitoring with OpenObserve.
Source: https://openobserve.ai/blog/distributed-tracing-in-nodejs-with-opentelemetry/
Published: 2025-03-06
Authors: Manas Sharma
Category: Engineering
Tags: Tracing, OpenTelemetry, Application
---
## Introduction
Express.js has become one of the most popular web application frameworks for Node.js, known for its minimalistic approach and robust features. As applications grow in complexity, understanding how requests flow through your services becomes crucial. This is where distributed tracing comes into play.
In modern microservices architectures, a single user request might traverse multiple services, making it challenging to:
- Identify performance bottlenecks
- Debug issues across service boundaries
- Understand service dependencies
- Monitor request latencies
This guide will walk you through implementing distributed tracing in your Express.js applications using OpenTelemetry - an observability framework that helps collect and manage telemetry data like traces, metrics, and logs.
### What is OpenTelemetry?
OpenTelemetry (OTel) is a collection of tools, APIs, and SDKs used to instrument, generate, collect, and export telemetry data for analysis. It provides a standardized way to:
- Instrument your application code
- Collect trace data
- Export data to various backends (like OpenObserve, Jaeger, Zipkin)
The best part? It's vendor-neutral and supported by major observability providers, making it a future-proof choice for your observability needs.
## Prerequisites and Environment Setup
Before we dive into implementation, let's ensure you have everything needed to follow along.
### Prerequisites
- Node.js version 12 or newer installed on your system
- An OpenObserve account (You can use [OpenObserve Cloud](https://cloud.openobserve.ai) or set up a [self-hosted installation](https://openobserve.ai/docs/quickstart/#self-hosted-installation))
### Getting Started
You can clone the sample application from our GitHub repository:
```bash
git clone https://github.com/openobserve/sample-tracing-nodejs-javascript
cd sample-tracing-nodejs-javascript
npm install
```
### Understanding OpenTelemetry Configuration
Let's look at how we configure OpenTelemetry in our application. We'll start with **auto-instrumentation** - the quickest way to add tracing to your Express.js application.
```javascript
const opentelemetry = require("@opentelemetry/sdk-node");
const {
getNodeAutoInstrumentations,
} = require("@opentelemetry/auto-instrumentations-node");
const { diag, DiagConsoleLogger, DiagLogLevel } = require("@opentelemetry/api");
const {
OTLPTraceExporter,
} = require("@opentelemetry/exporter-trace-otlp-http");
// For troubleshooting, set the log level to DiagLogLevel.DEBUG
diag.setLogger(new DiagConsoleLogger(), DiagLogLevel.INFO);
const exporterOptions = {
url: "url/v1/traces",
headers: {
Authorization: "Basic YOUR_AUTH_TOKEN",
},
};
const traceExporter = new OTLPTraceExporter(exporterOptions);
const sdk = new opentelemetry.NodeSDK({
traceExporter: new opentelemetry.tracing.ConsoleSpanExporter(),
traceExporter,
instrumentations: [getNodeAutoInstrumentations()],
serviceName: "nodejs-javascript-service",
});
sdk.start();
```
The `OTLPTraceExporter` sends the captured traces to OpenObserve. Replace url and YOUR_AUTH_TOKEN with your actual HTTP endpoint and authentication token, which you can find in your Data Sources -> Custom -> Traces -> OpenTelemetry -> OTLP HTTP.
- Auto-Instrumentation:
- `getNodeAutoInstrumentations()` automatically instruments common Node.js modules
- This includes Express.js, HTTP clients, and other popular modules
- No manual code changes needed in your application
- Service Name:
- The `serviceName` helps identify your application in the trace data
- Choose a meaningful name that represents your service
## Running and Verifying Traces
### Starting the Application
1. Configure OpenObserve endpoint and authentication in `tracing.js`
2. Start the application:
```bash
node --require './tracing.js' app.js
```
3. Generate test traffic:
```bash
curl http://localhost:8080
```
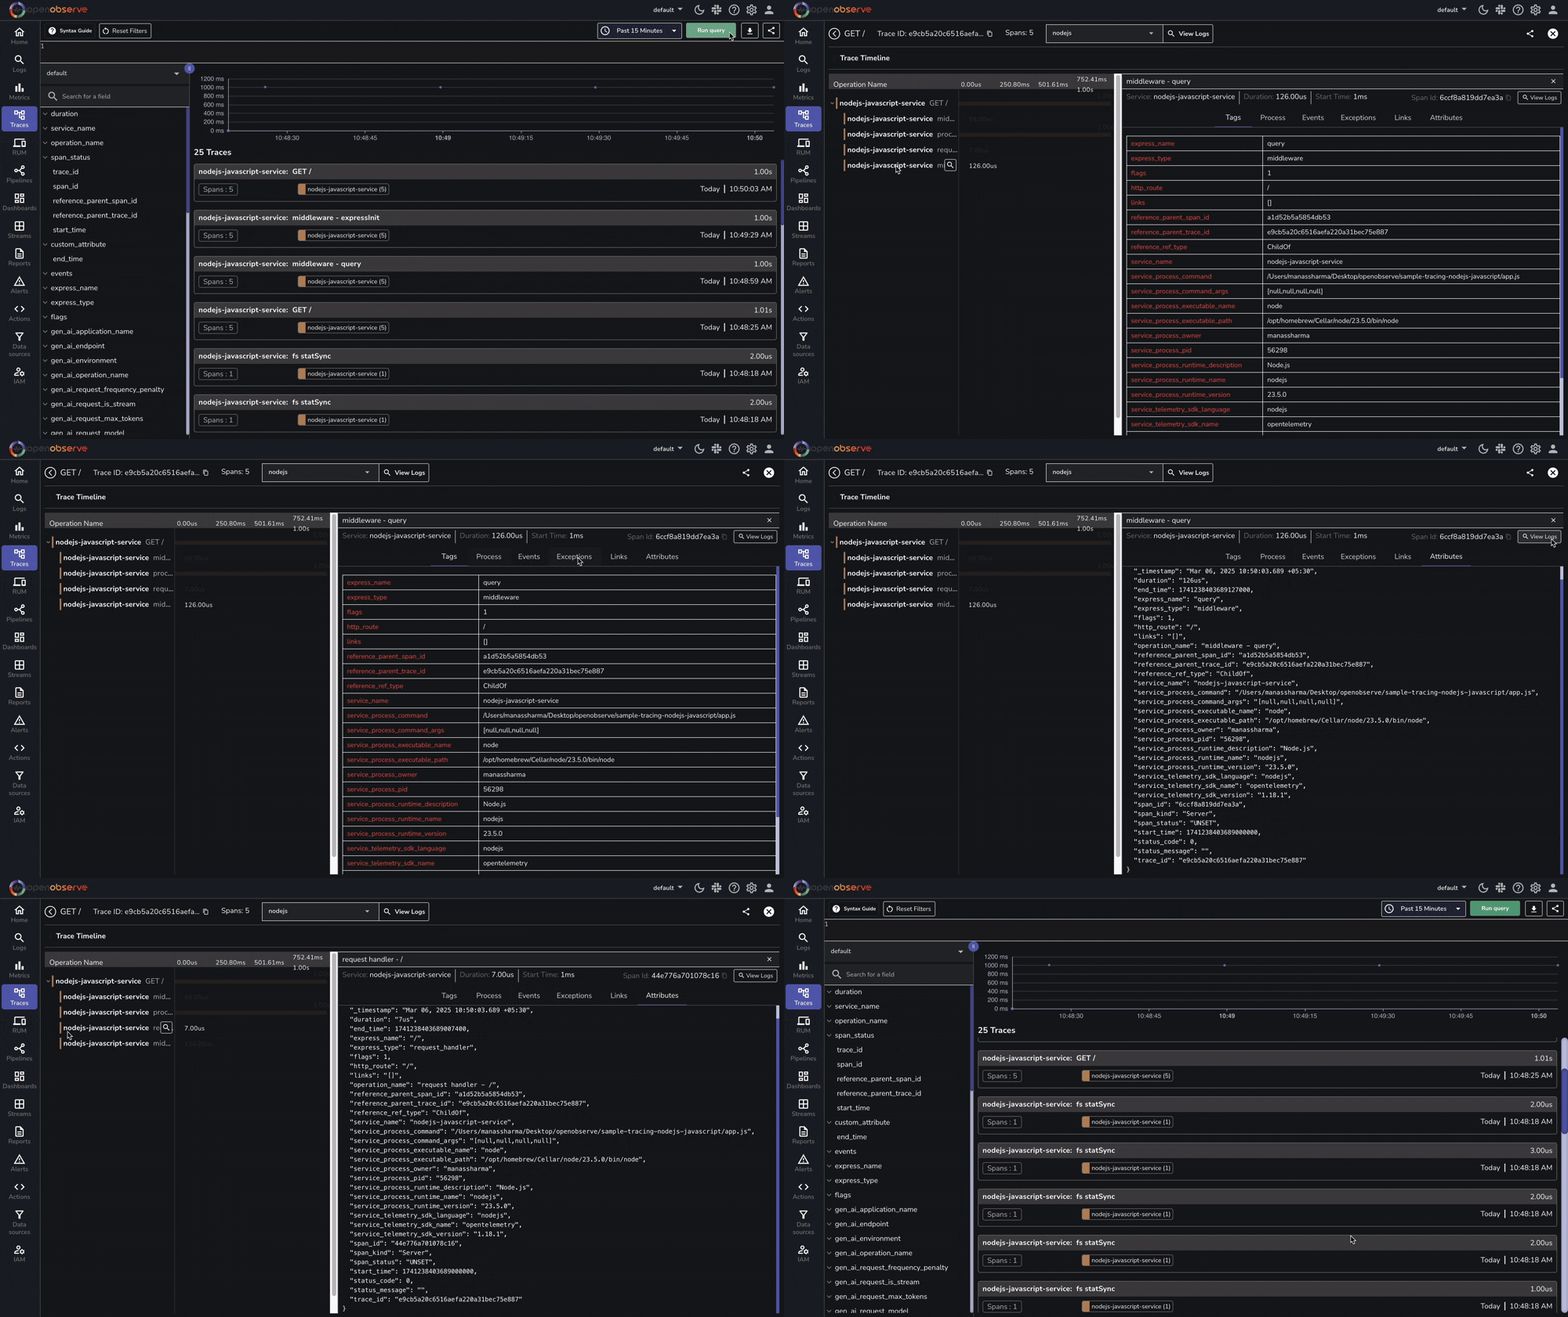
### Viewing Traces
Access your OpenObserve Instance:
1. Navigate to "Traces" section
2. Filter by service name "nodejs-javascript-service"
### Auto-instrumentation Coverage
OpenTelemetry automatically traces:
- HTTP requests/responses
- Express.js routes
- Database queries
- External HTTP calls
- Request timing metrics
### Troubleshooting
Not seeing traces? Check:
- OpenObserve endpoint URL and auth token
- Application logs for errors
- Enable debug logging:
```javascript
diag.setLogger(new DiagConsoleLogger(), DiagLogLevel.DEBUG);
```
## Manual Instrumentation
While auto-instrumentation covers common scenarios, manual instrumentation allows custom tracing of business logic. Here's how you can modify the tracing configuration:
```javascript
const opentelemetry = require("@opentelemetry/sdk-node");
const {
getNodeAutoInstrumentations,
} = require("@opentelemetry/auto-instrumentations-node");
const {
diag,
DiagConsoleLogger,
DiagLogLevel,
trace,
} = require("@opentelemetry/api");
const {
OTLPTraceExporter,
} = require("@opentelemetry/exporter-trace-otlp-http");
// Set logging level
diag.setLogger(new DiagConsoleLogger(), DiagLogLevel.INFO);
// Configure the SDK
const sdk = new opentelemetry.NodeSDK({
traceExporter: new OTLPTraceExporter({
url: "url/v1/traces", // Replace with your OpenObserve endpoint
headers: {
Authorization: "Basic YOUR_AUTH_TOKEN", // Replace with your auth token
},
}),
instrumentations: [getNodeAutoInstrumentations()],
serviceName: "nodejs-javascript-service",
});
// Start the SDK
try {
sdk.start();
console.log("Tracing initialized");
// Export tracer for manual instrumentation
module.exports = {
tracer: trace.getTracer("express-app-tracer"),
};
} catch (error) {
console.log("Error initializing tracing", error);
}
// Graceful shutdown
process.on("SIGTERM", () => {
sdk
.shutdown()
.then(() => console.log("Tracing terminated"))
.catch((error) => console.log("Error terminating tracing", error))
.finally(() => process.exit(0));
});
```
This example demonstrates creating custom spans, adding attributes, and error handling. Modify the `app.js` file like this:
```javascript
const express = require("express");
const { tracer } = require("./tracing");
const PORT = parseInt(process.env.PORT || "8080");
const app = express();
app.get("/", (req, res) => {
// Create a custom span
const span = tracer.startSpan("process-request");
span.setAttribute("custom.attribute", "test-value");
setTimeout(() => {
span.addEvent("sending-response");
res.send("Hello World");
span.end();
}, 1000);
});
app.listen(PORT, () => {
console.log(`Listening for requests on http://localhost:${PORT}`);
});
```
> **Note**: For advanced tracing features like context propagation and custom processors, refer to the OpenTelemetry JavaScript Documentation.
## Next Steps
Now that you have tracing set up in your Express.js application, you can:
1. Explore different [sampling strategies for production environments](https://openobserve.ai/blog/head-and-tail-based-sampling/), head-based, tail-based, or a hybrid of both
2. Combine traces with logs for better debugging - check out our guide on [NodeJS Logging with OpenObserve](https://openobserve.ai/blog/sending-pino-logs-to-openobserve/)
3. Set up alerts based on trace latencies and error rates
The sample code is available in our GitHub repository - feel free to use it as a starting point for your implementation.
Have questions? Join our Slack community for support.
Happy Monitoring! 🚀