# Implementing Distributed Tracing in a Java Application with OpenObserve
> Learn how to implement distributed tracing in a Java Spring Boot microservices application using the OpenTelemetry Java Agent and OpenObserve. Covers zero-code auto-instrumentation, JVM metrics, cross-service trace propagation, flamegraphs, and Gantt charts , with working source code and curl examples.
Source: https://openobserve.ai/blog/distributed-tracing-java/
Published: 2026-03-25
Authors: Simran Kumari
Category: How To
Tags: OpenTelemetry, Application
---
Monitoring microservices is hard. When a user request fans out across multiple services each with its own database, its own logs, and its own failure modes traditional monitoring tools give you a fragmented picture. You see that _something_ is slow, but not _where_ or _why_.
Distributed tracing solves this by tracking a single request as it travels through every service in your system. In this tutorial, we'll implement distributed tracing for a custom-built Java Spring Boot microservices application using two open-source tools: **OpenTelemetry** and **OpenObserve**.
If your stack includes other languages, we also have guides on implementing distributed tracing in [.NET](https://openobserve.ai/blog/distributed-tracing-in-dotnet-application/), [Go](https://openobserve.ai/blog/monitoring-go-with-opentelemetry/), and [Node.js](https://openobserve.ai/blog/distributed-tracing-in-nodejs-with-opentelemetry/) applications with OpenTelemetry.
By the end, you will have:
- A working three-service Spring Boot application with real cross-service HTTP calls
- Zero-code automatic instrumentation via the OpenTelemetry Java Agent
- Traces flowing into OpenObserve with full flamegraph and Gantt chart visualization
## **What is Distributed Tracing?**
In a microservices architecture, a single user action may touch dozens of services. If the request takes 3 seconds, which service is responsible? Which database query is the bottleneck?
[Read our detailed guide on Distributed Tracing and beyond](https://openobserve.ai/blog/distributed-tracing-basics-to-beyond-guide/)
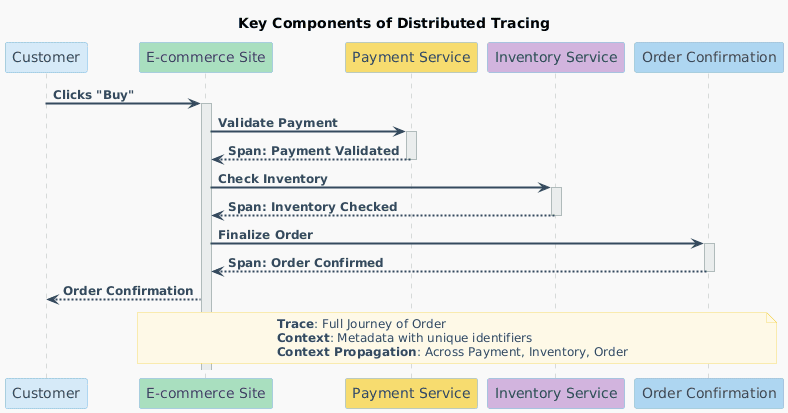
Distributed tracing answers these questions by attaching a **trace context** a `trace_id` and `span_id` to every request at the entry point, then propagating it through every downstream service call via HTTP headers. This produces a **trace**: a complete, end-to-end record of the request's journey through your system.
A trace is composed of **spans** one per operation. Each span records:
- The service and operation name
- Start time and duration
- HTTP method, URL, status code
- Database queries (table, SQL)
- Any errors or exceptions
- Parent-child relationships to other spans
When visualized together, spans form a flamegraph that immediately shows where time was spent and where failures occurred.
## **OpenTelemetry and OpenObserve**
### **OpenTelemetry**
OpenTelemetry is a CNCF project that provides a vendor-agnostic standard for generating and exporting telemetry data (traces, metrics, logs). For Java, it provides a powerful **Java Agent** a single JAR that auto-instruments your application at JVM startup. It detects Spring Boot, JDBC, HTTP clients, and 100+ popular libraries with no code changes required.
OpenTelemetry handles **instrumentation**. It exports data using the OTLP (OpenTelemetry Protocol) to a backend of your choice.
### **OpenObserve**
[OpenObserve](https://openobserve.ai/) is that backend. It is a high-performance open-source observability platform built for logs, metrics, and traces. Written in Rust, it is:
- **Storage-efficient** uses significantly less disk space than legacy alternatives
- **Single binary** runs with a single Docker command in development
- **OTLP-native** accepts traces directly from the OpenTelemetry agent
- **SQL-powered** lets you query trace data using SQL for custom analysis
- **Unified** logs, metrics, and traces all in one interface
### Running a sample Spring Boot Java application with OpenTelemetry
We will build a custom Spring Boot microservices application from scratch with four services:
| Service | Port | Responsibility |
| ------------------- | ---- | ----------------------------------------- |
| `discovery-service` | 8761 | Eureka service registry |
| `user-service` | 8081 | User CRUD, backed by MySQL |
| `order-service` | 8082 | Order management; calls `user-service` |
| `payment-service` | 8083 | Payment processing; calls `order-service` |
The key distributed tracing scenario is triggered when a payment is processed:
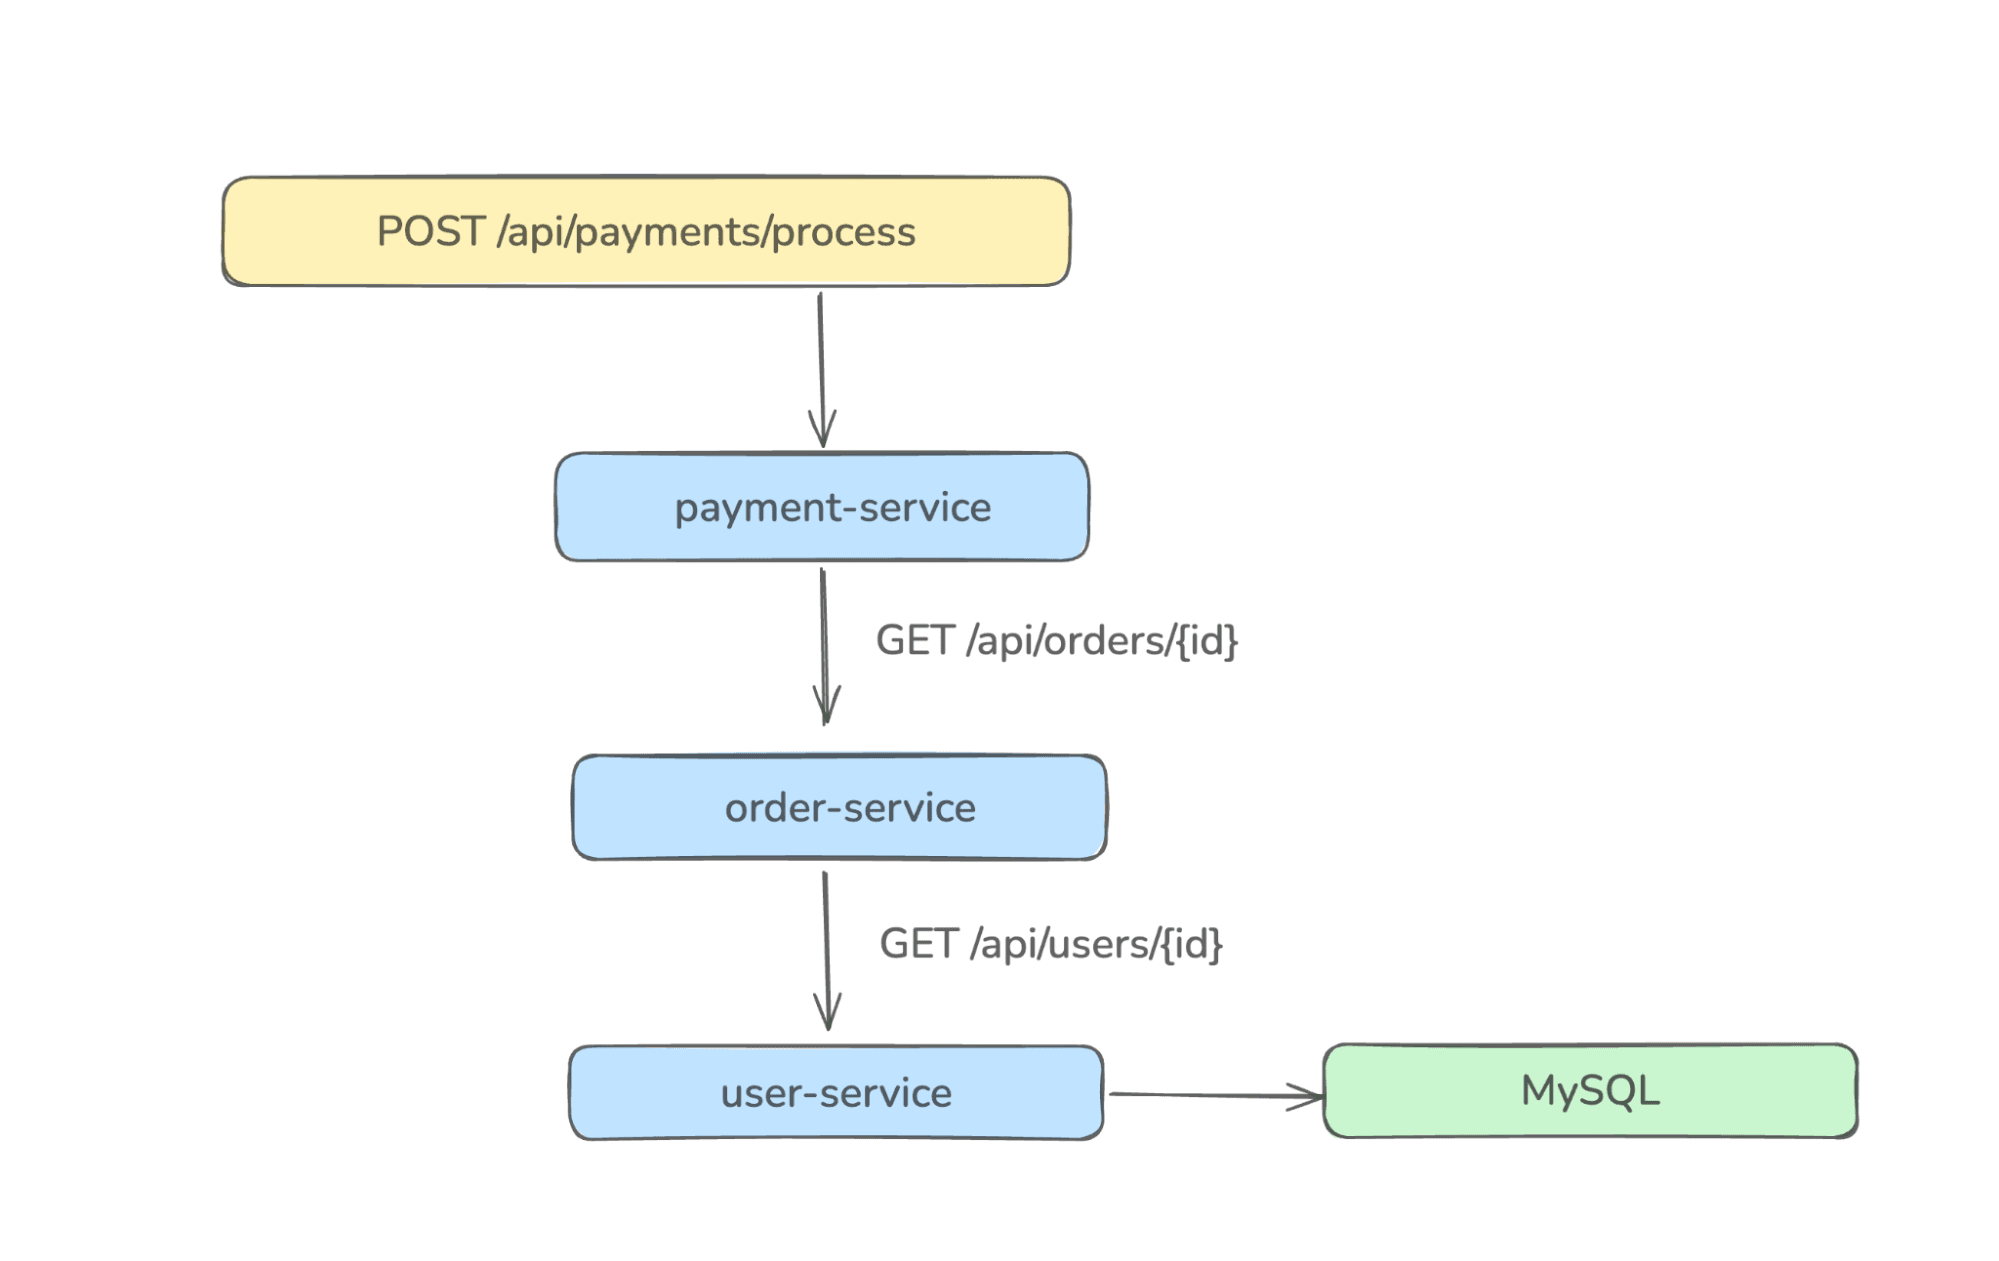This creates a trace with spans spanning three services and one database, which is exactly the kind of request chain that's invisible without distributed tracing.
Each service runs with the **OpenTelemetry Java Agent** attached, which propagates the `trace_id` via `traceparent` HTTP headers automatically.
## **Prerequisites**
- Java 17+
- Maven 3.8+
- Docker and Docker Compose
- MySQL 8 (or use Docker covered below)
## **Step 1 : Clone the Project**
The complete source code for all four services is available in this repository. Clone it and navigate into the project root:
```
git clone https://github.com/openobserve/java-distributed-tracing.git
cd java-distributed-tracing
```
## **Step 2 : Start OpenObserve and MySQL with Docker Compose**
The `docker-compose.yml` in the project root spins up both OpenObserve and MySQL:
```
docker-compose up -d
```

This starts:
- **OpenObserve** on `http://localhost:5080` (UI + OTLP HTTP endpoint)
- **MySQL 8** on `localhost:3306` with a `tracingdb` database
Verify OpenObserve is running by opening http://localhost:5080 in your browser. Log in with:
- **Email:** `admin@example.com`
- **Password:** `Admin123!`
You should see the OpenObserve dashboard.
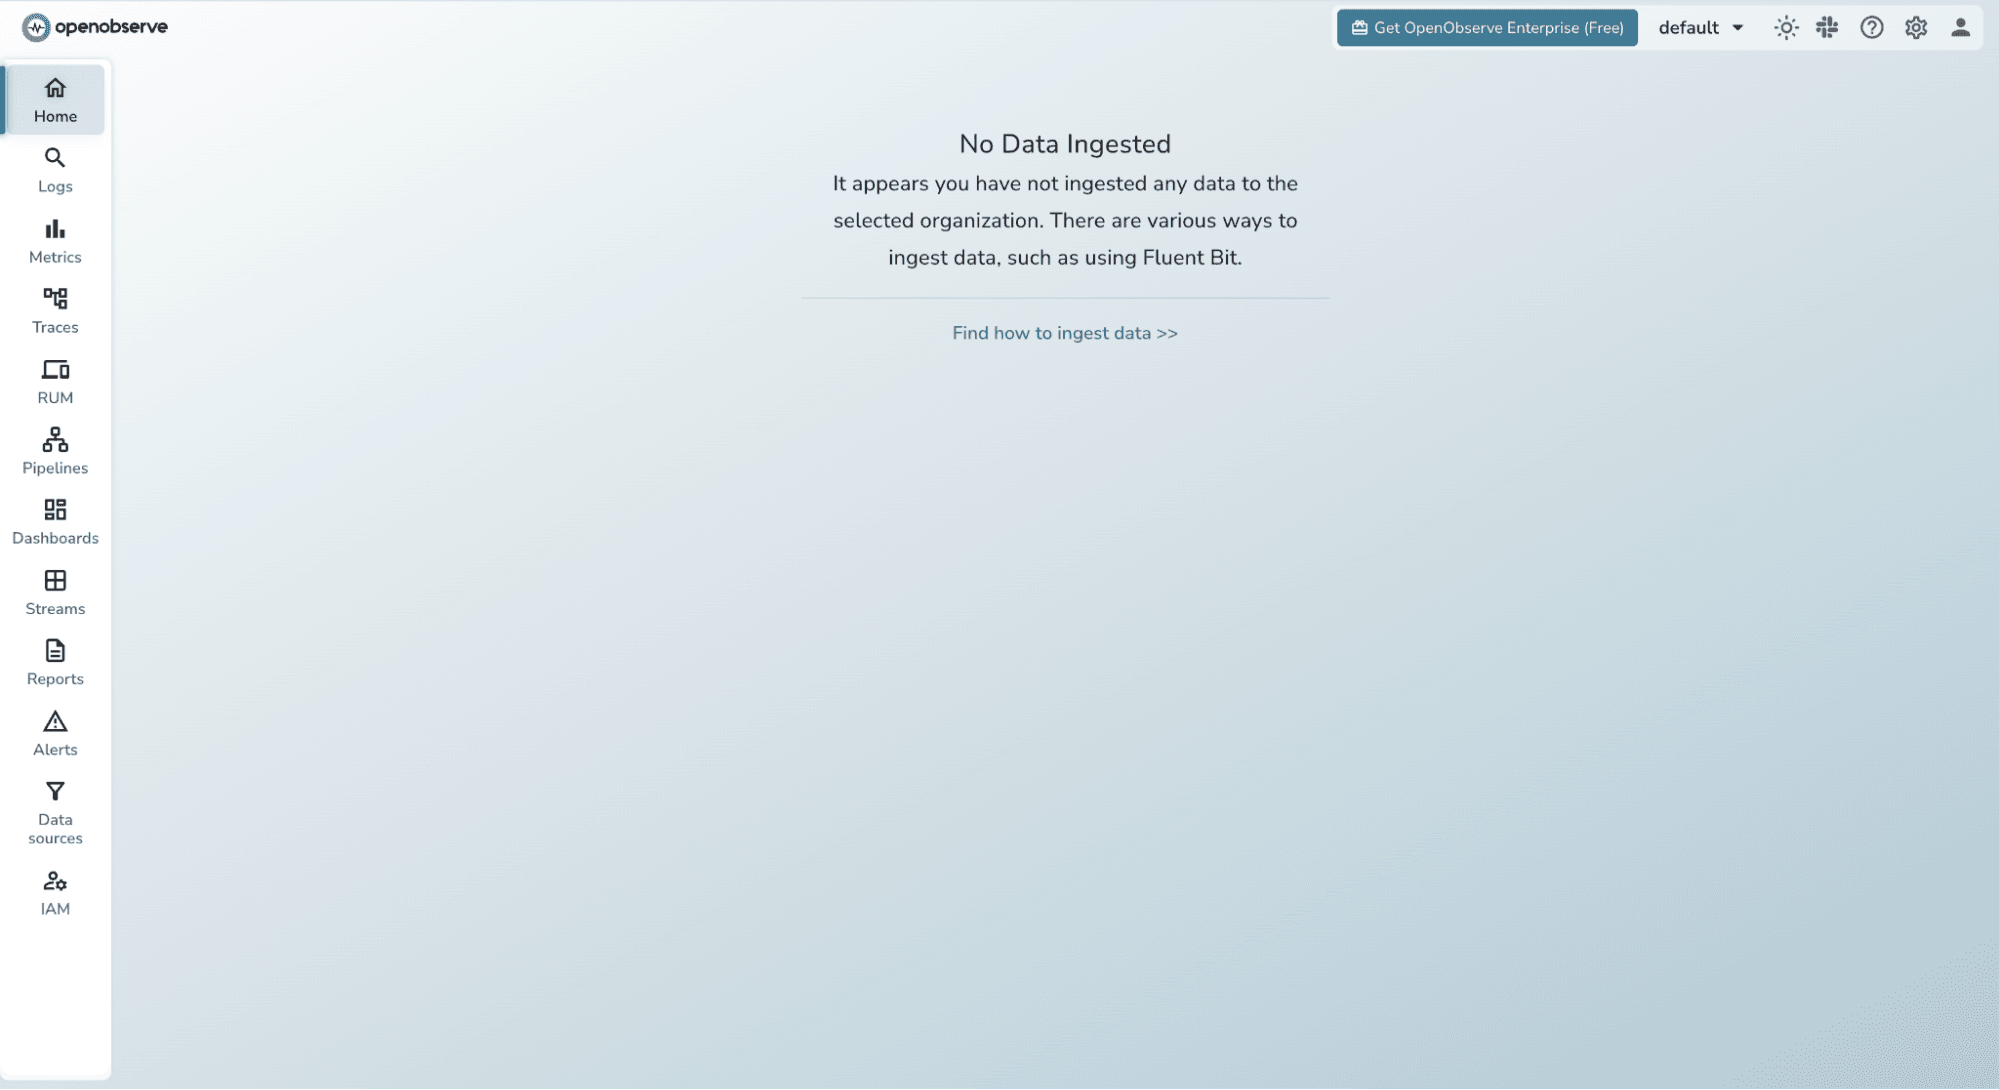
Navigate to **Traces** in the sidebar it will be empty for now, but we'll fix that shortly.
## **Step 3: Download the OpenTelemetry Java Agent**
The OpenTelemetry Java Agent auto-instruments Spring Boot, JDBC, RestTemplate, and more all without touching your source code.
Create an `agents/` folder in the project root and download the latest agent JAR:
```
mkdir agents
curl -L https://github.com/open-telemetry/opentelemetry-java-instrumentation/releases/latest/download/opentelemetry-javaagent.jar \
-o agents/opentelemetry-javaagent.jar
```
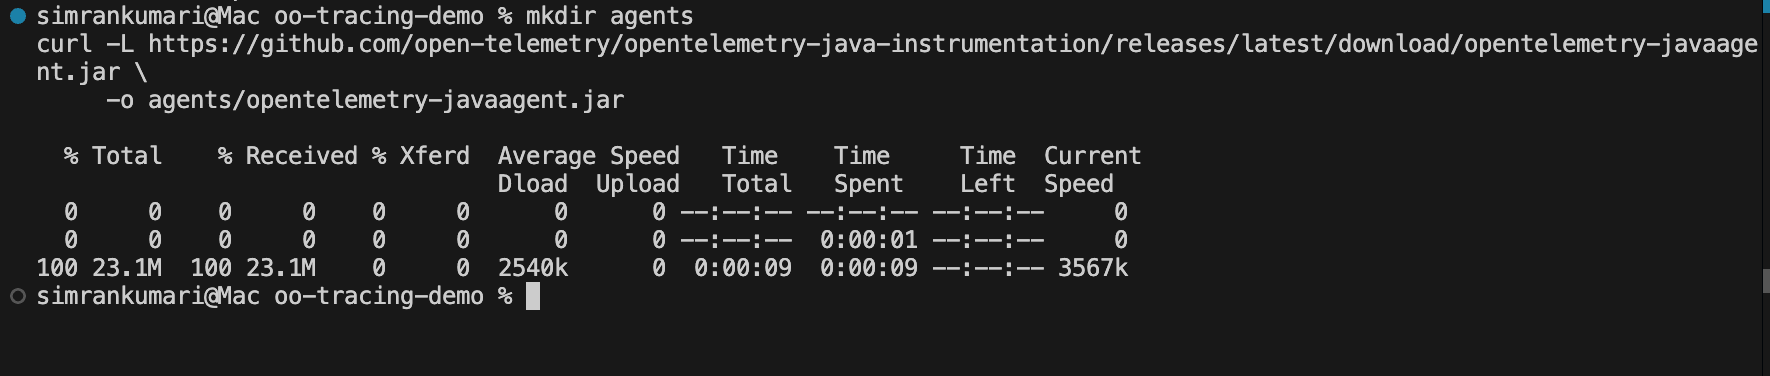
All four service startup scripts reference `../agents/opentelemetry-javaagent.jar`, so this single download covers every service.
## **Step 4: Understand the OpenTelemetry Configuration**
Each service's `scripts/start.sh` configures the OpenTelemetry Java Agent to export traces to OpenObserve. Let's break down what each flag does.
Here is the startup script for user-service (the other services follow the same pattern):
```
export OTEL_SERVICE_NAME=user-service
export OTEL_RESOURCE_ATTRIBUTES=service.name=user-service,deployment.environment=dev
export OTEL_TRACES_EXPORTER=otlp
export OTEL_METRICS_EXPORTER=none
export OTEL_LOGS_EXPORTER=none
export OTEL_EXPORTER_OTLP_TRACES_ENDPOINT=http://localhost:5080/api/default/traces
export OTEL_EXPORTER_OTLP_TRACES_PROTOCOL=http/protobuf
export OTEL_EXPORTER_OTLP_TRACES_HEADERS="Authorization=Basic {token}"
java \
-Xms256m \
-Xmx512m \
-javaagent:../agents/opentelemetry-javaagent.jar \
-jar target/user-service-0.0.1-SNAPSHOT.jar
```
Key variables explained:
| Variable | Value| What it does |
| --------| -------- | ---------- |
| OTEL_SERVICE_NAME| user-service | Labels this service's spans and metrics in OpenObserve|
| OTEL_TRACES_EXPORTER | otlp| Enable trace export via OTLP| |otlpEnable JVM metrics export via OTLP|
| OTEL_EXPORTER_OTLP_TRACES_ENDPOINT| .../traces| OpenObserve OTLP traces endpoint|
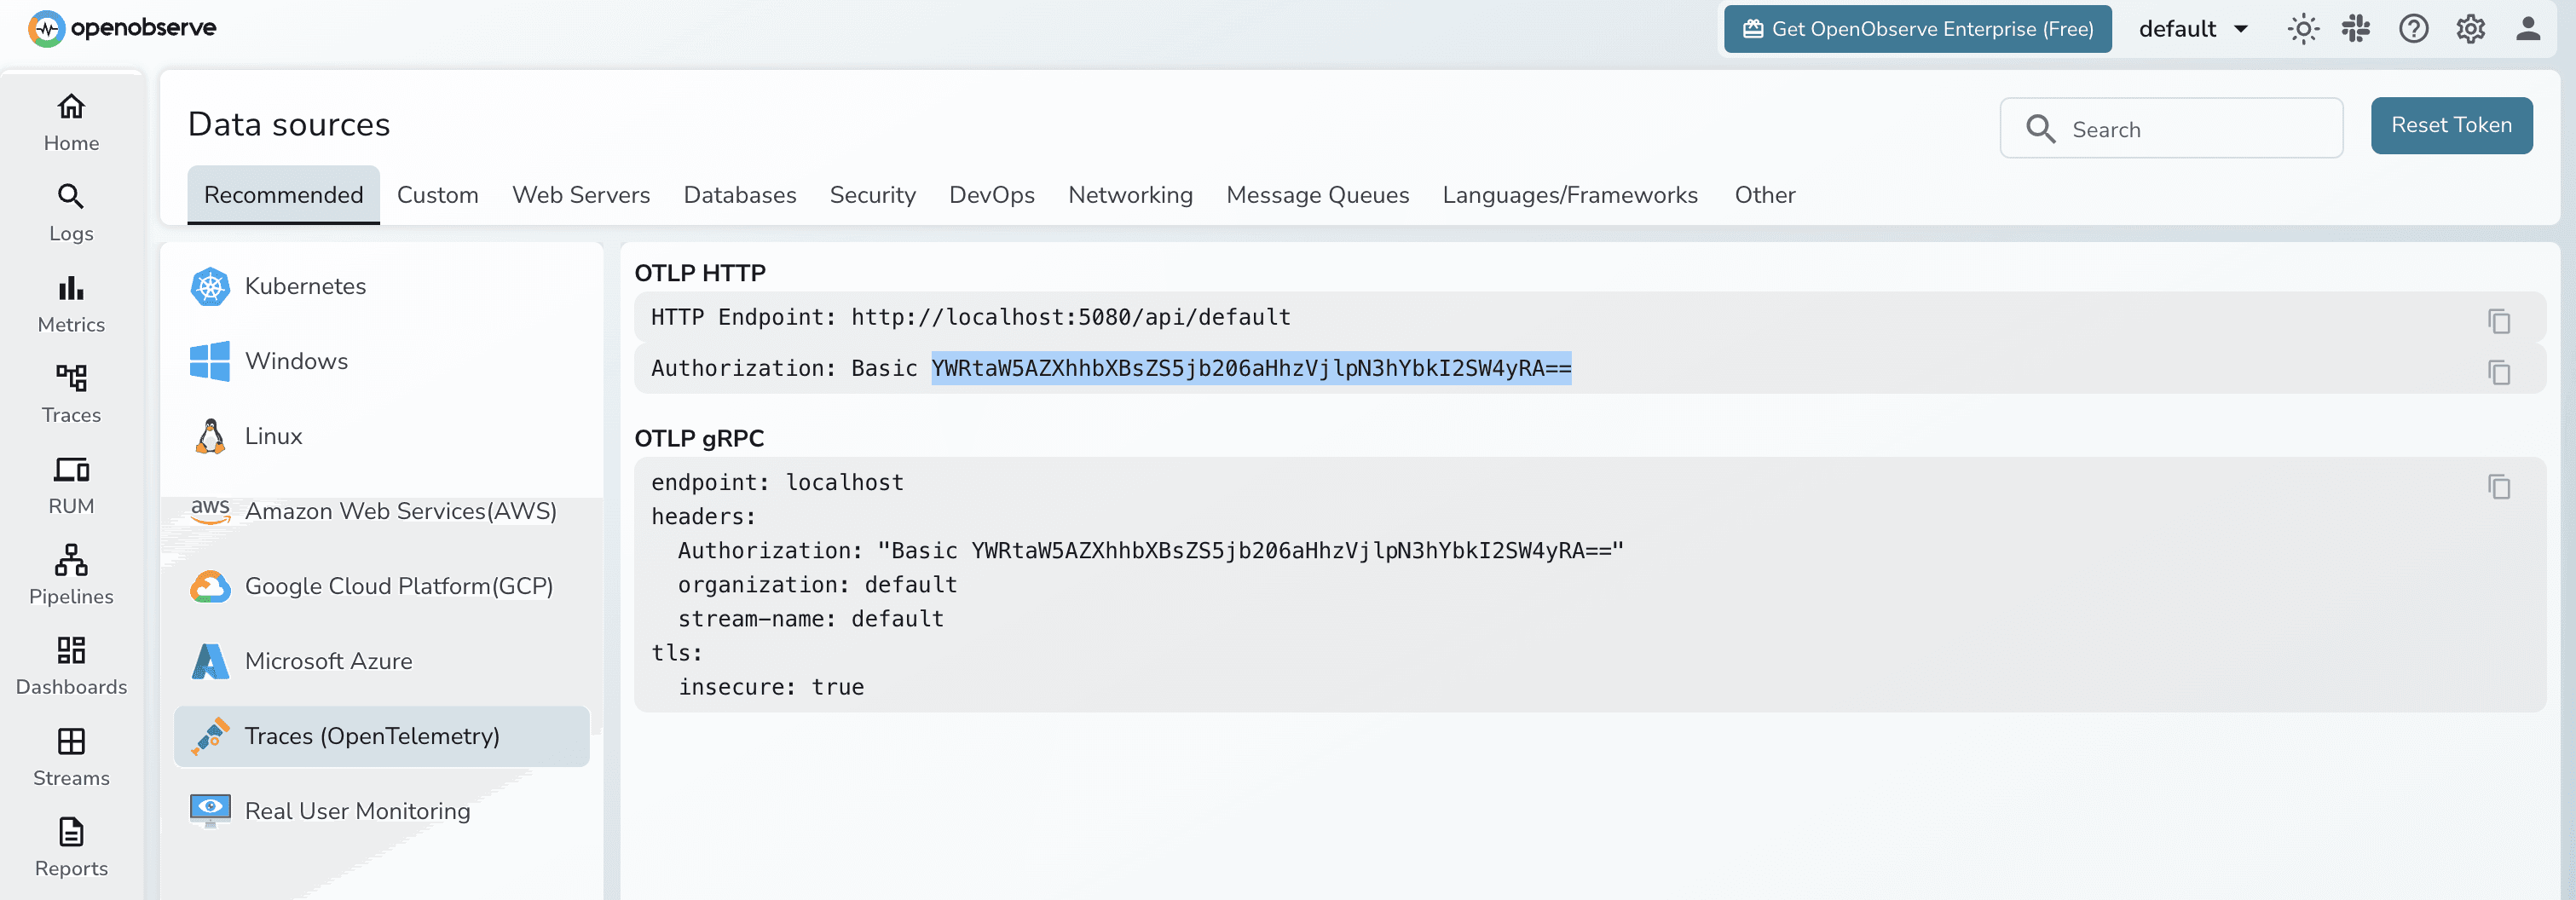
| OTEL_EXPORTER_OTLP_TRACES_HEADERS | Authorization=Basic ...| Basic auth token fetched from OpenObserve|
You can fetch the Header token from OpenObserve UI:
## **Step 5: Start the Discovery Service**
The discovery service is a Eureka server. The other three services register with it on startup.
```
cd discovery-service
mvn clean install -Dmaven.test.skip
sh scripts/start.sh
```
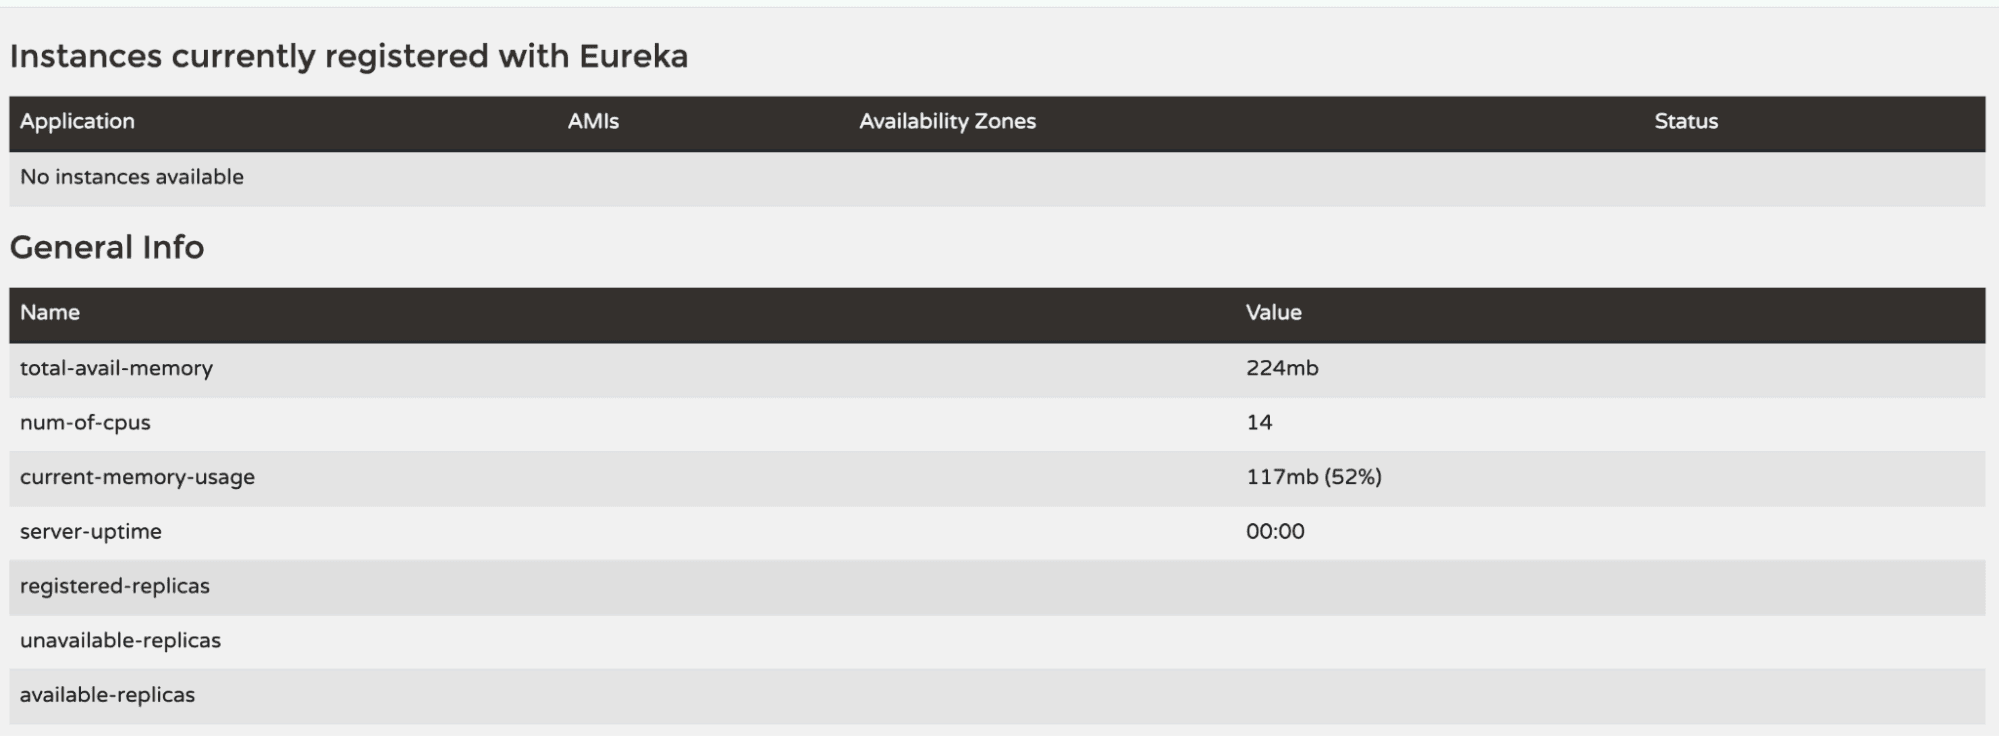
Open http://localhost:8761 to confirm the Eureka dashboard is live. You won't see any registered instances yet.
## **Step 6: Start the Microservices**
Open three separate terminal windows and start each service:
**Terminal 1 user-service:**
```
cd user-service
mvn clean install -Dmaven.test.skip
sh scripts/start.sh
```
**Terminal 2 order-service:**
```
cd order-service
mvn clean install -Dmaven.test.skip
sh scripts/start.sh
```
**Terminal 3 payment-service:**
```
cd payment-service
mvn clean install -Dmaven.test.skip
sh scripts/start.sh
```
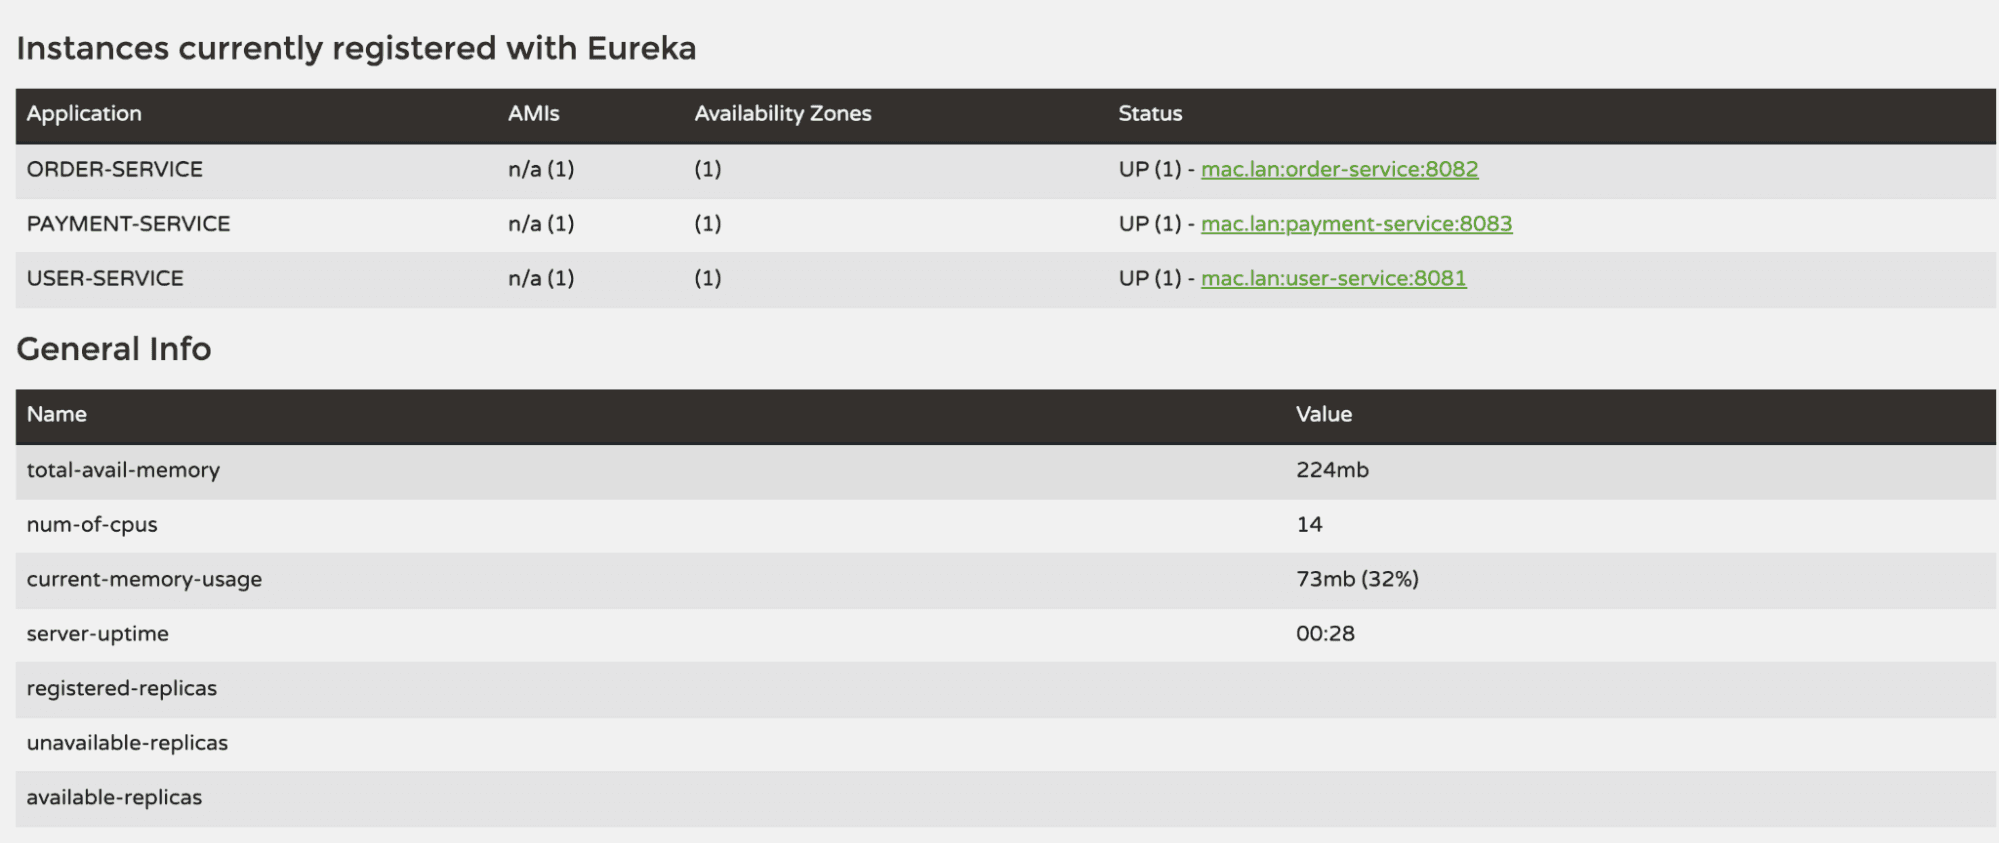
Once all three are running, revisit the Eureka dashboard at http://localhost:8761 you should see all three services listed under "Instances currently registered with Eureka".
## **Step 7: Generate Traces by Calling the APIs**
Now let's create some user requests that will flow across services and produce traces. You can use `curl` or any API client like Postman.
**1\. Create a user:**
```shell
curl -X POST http://localhost:8081/api/users \
-H "Content-Type: application/json" \
-d '{
"name": "Priya Sharma",
"email": "priya@example.com",
"phone": "+91-9876543210"
}'
```
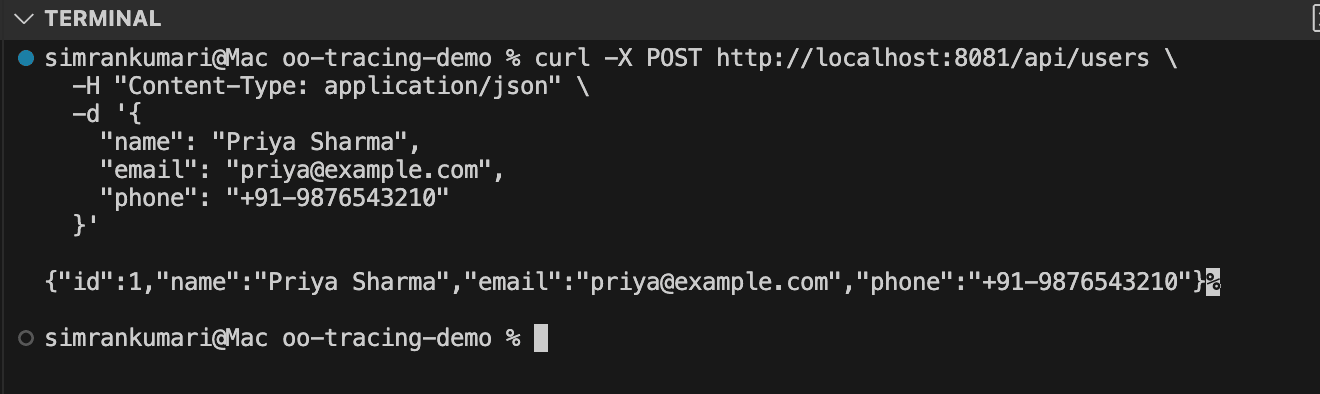
Expected response:
```json
{
"id": 1,
"name": "Priya Sharma",
"email": "priya@example.com",
"phone": "+91-9876543210"
}
```
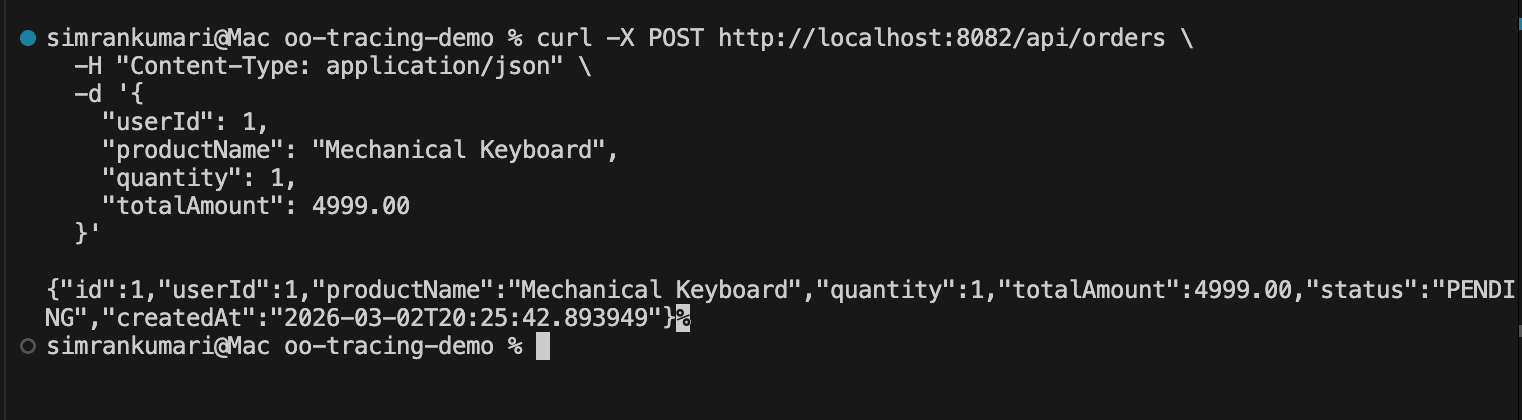
**2\. Create an order for that user:**
```shell
curl -X POST http://localhost:8082/api/orders \
-H "Content-Type: application/json" \
-d '{
"userId": 1,
"productName": "Mechanical Keyboard",
"quantity": 1,
"totalAmount": 4999.00
}'
```
This triggers a cross-service call: `order-service` calls `user-service` to verify the user exists before creating the order. Two services, one trace.
Expected response:
```json
{
"id": 1,
"userId": 1,
"productName": "Mechanical Keyboard",
"quantity": 1,
"totalAmount": 4999.0,
"status": "PENDING",
"createdAt": "2026-02-15T10:30:00"
}
```
**3\. Process a payment (the richest trace):**
```shell
curl -X POST http://localhost:8083/api/payments/process \
-H "Content-Type: application/json" \
-d '{
"userId": 1,
"orderId": 1,
"amount": 4999.00,
"currency": "INR",
"paymentMethod": "UPI"
}'
```
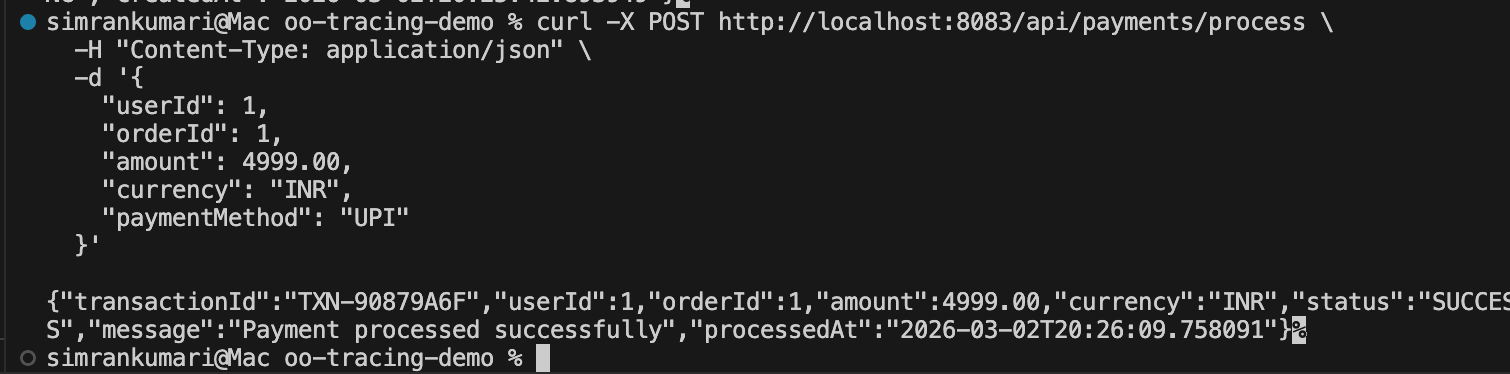
This triggers the full call chain: `payment-service` → `order-service` → `user-service` → MySQL
Expected response:
```json
{
"transactionId": "TXN-A1B2C3D4",
"userId": 1,
"orderId": 1,
"amount": 4999.0,
"currency": "INR",
"status": "SUCCESS",
"message": "Payment processed successfully",
"processedAt": "2026-02-15T10:31:00"
}
```
**4\. Test an error case order for a non-existent user:**
```shell
curl -X POST http://localhost:8082/api/orders \
-H "Content-Type: application/json" \
-d '{
"userId": 9999,
"productName": "Test Product",
"quantity": 1,
"totalAmount": 100.00
}'
```
This will return a `400 Bad Request`. The failed cross-service lookup will appear in OpenObserve as an errored span useful for testing error visibility.

Make several of these requests in different combinations to generate a rich set of trace data.
## **Visualizing Traces in OpenObserve**
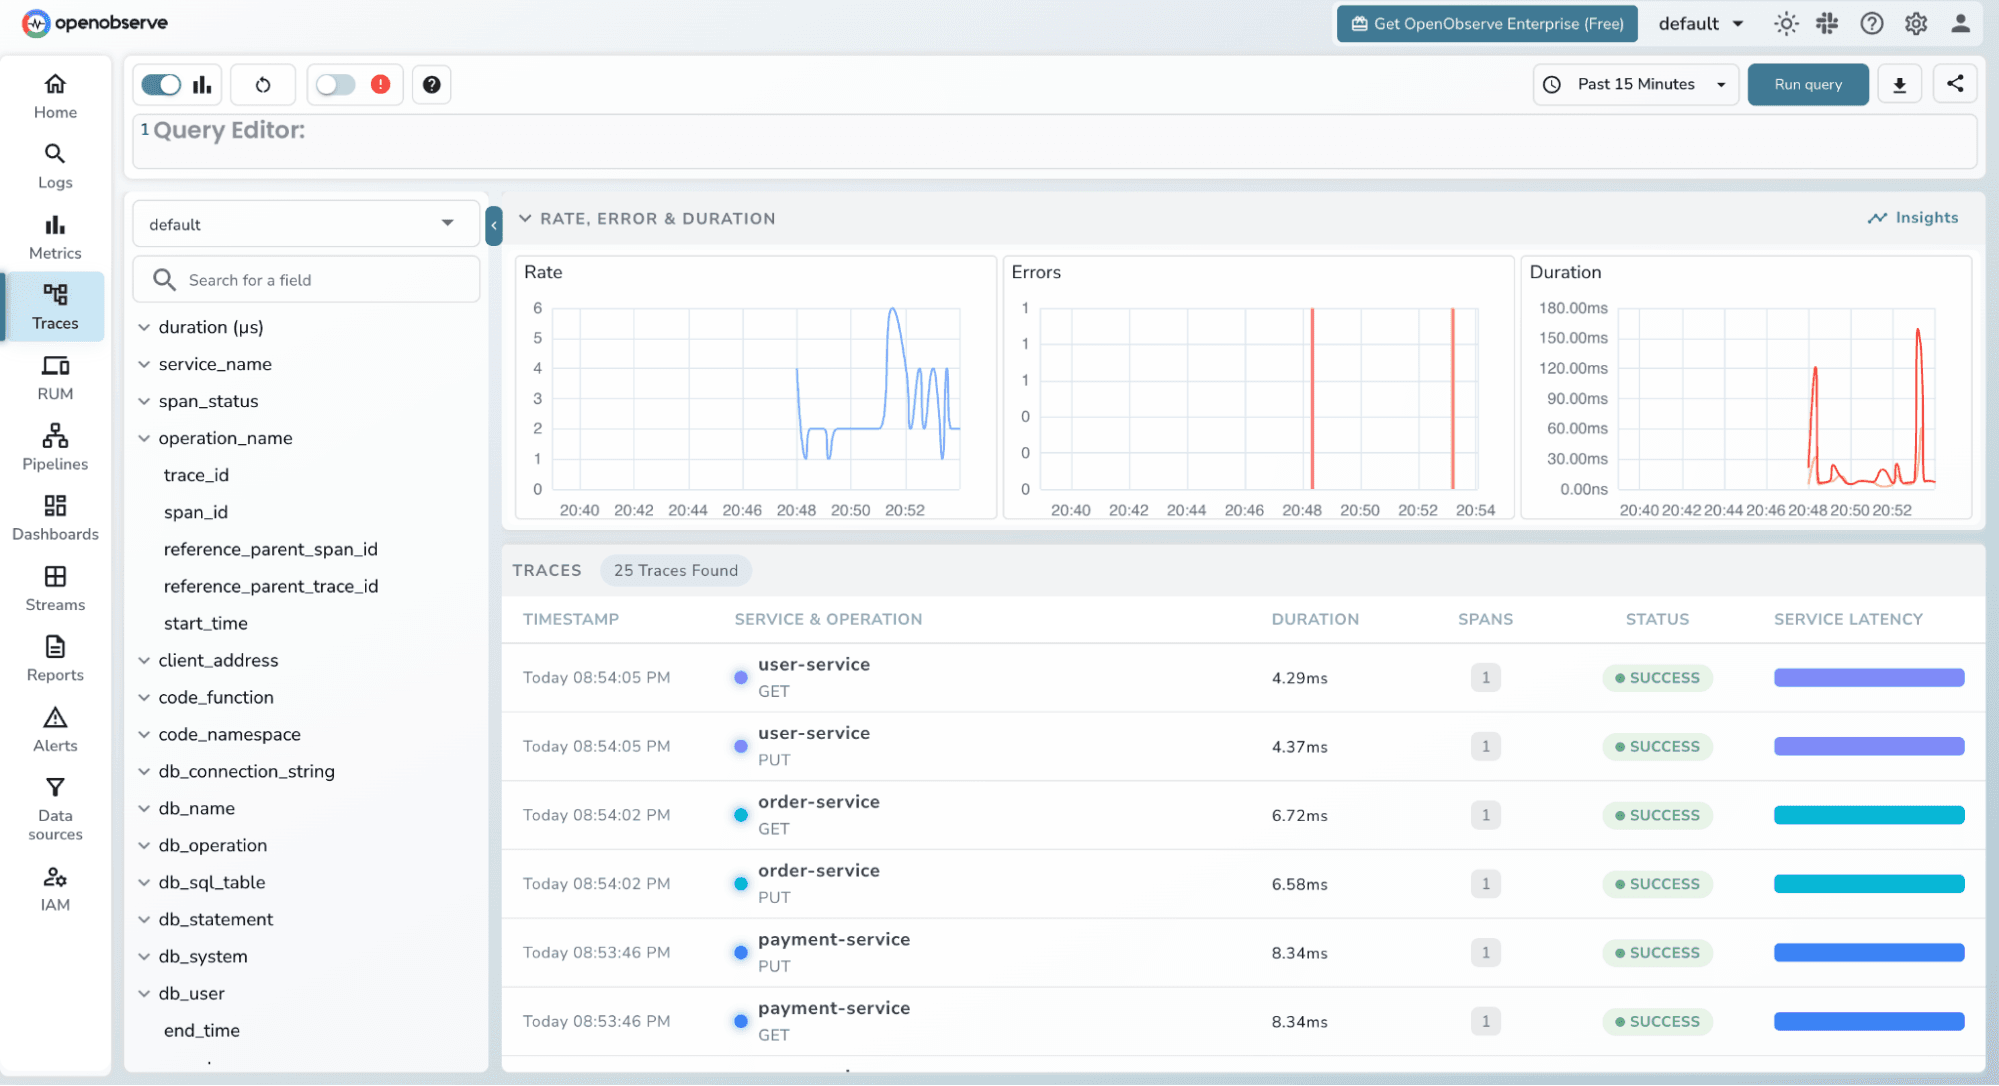
Head to the OpenObserve UI at http://localhost:5080 and click **Traces** in the left sidebar.
### **The Trace Explorer**
The Trace Explorer shows all incoming traces with filters at the top. You should immediately see traces from the three services listed in the service dropdown. The trace list shows:
- **Trace ID** unique identifier for the end-to-end request
- **Root span** the entry point operation (e.g., `POST /api/payments/process`)
- **Service** which service received the request
- **Duration** total time for the end-to-end trace
- **Spans** number of spans in the trace
- **Status** success or error
### **Filtering Traces**
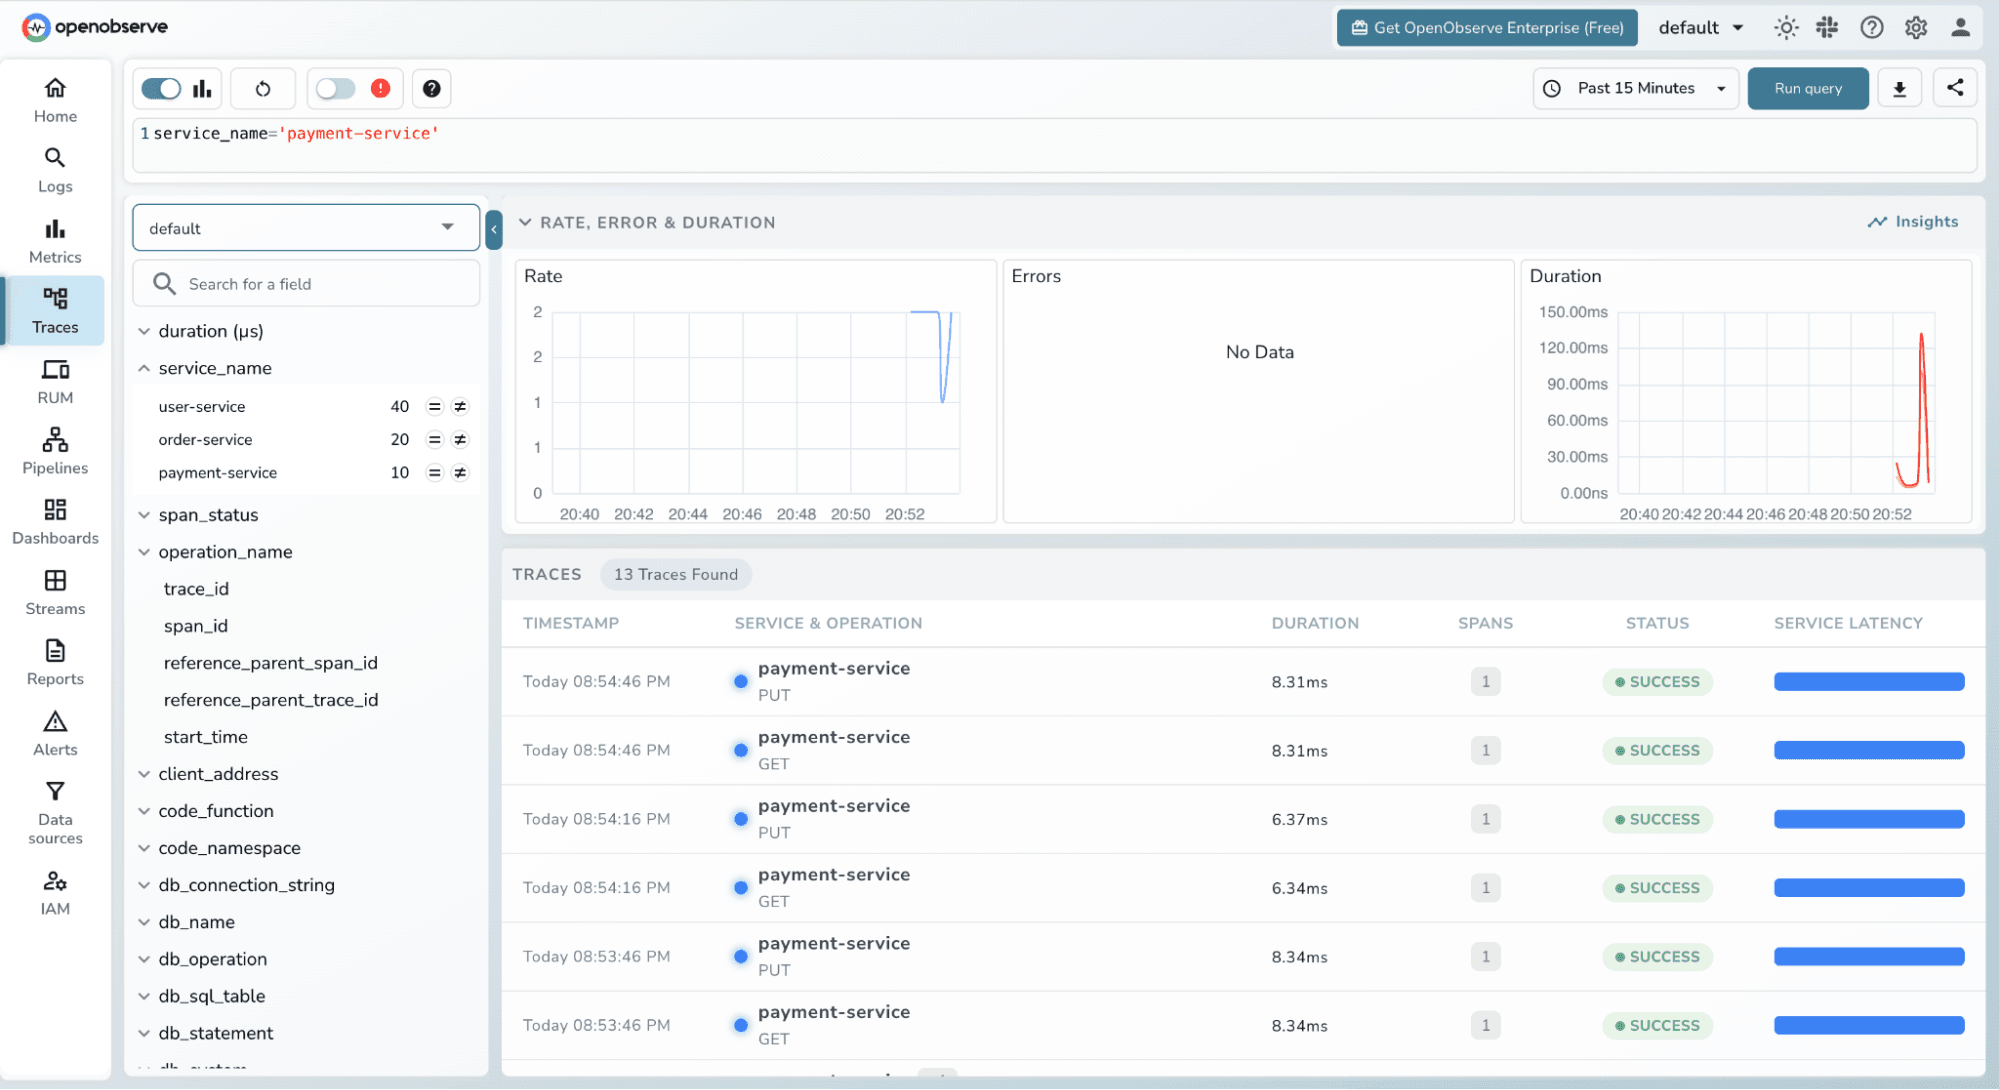
Use the filters to narrow down what you're looking at:
- Filter by `service_name = payment-service` to see only payment requests
- Filter by `status = ERROR` to find failed requests
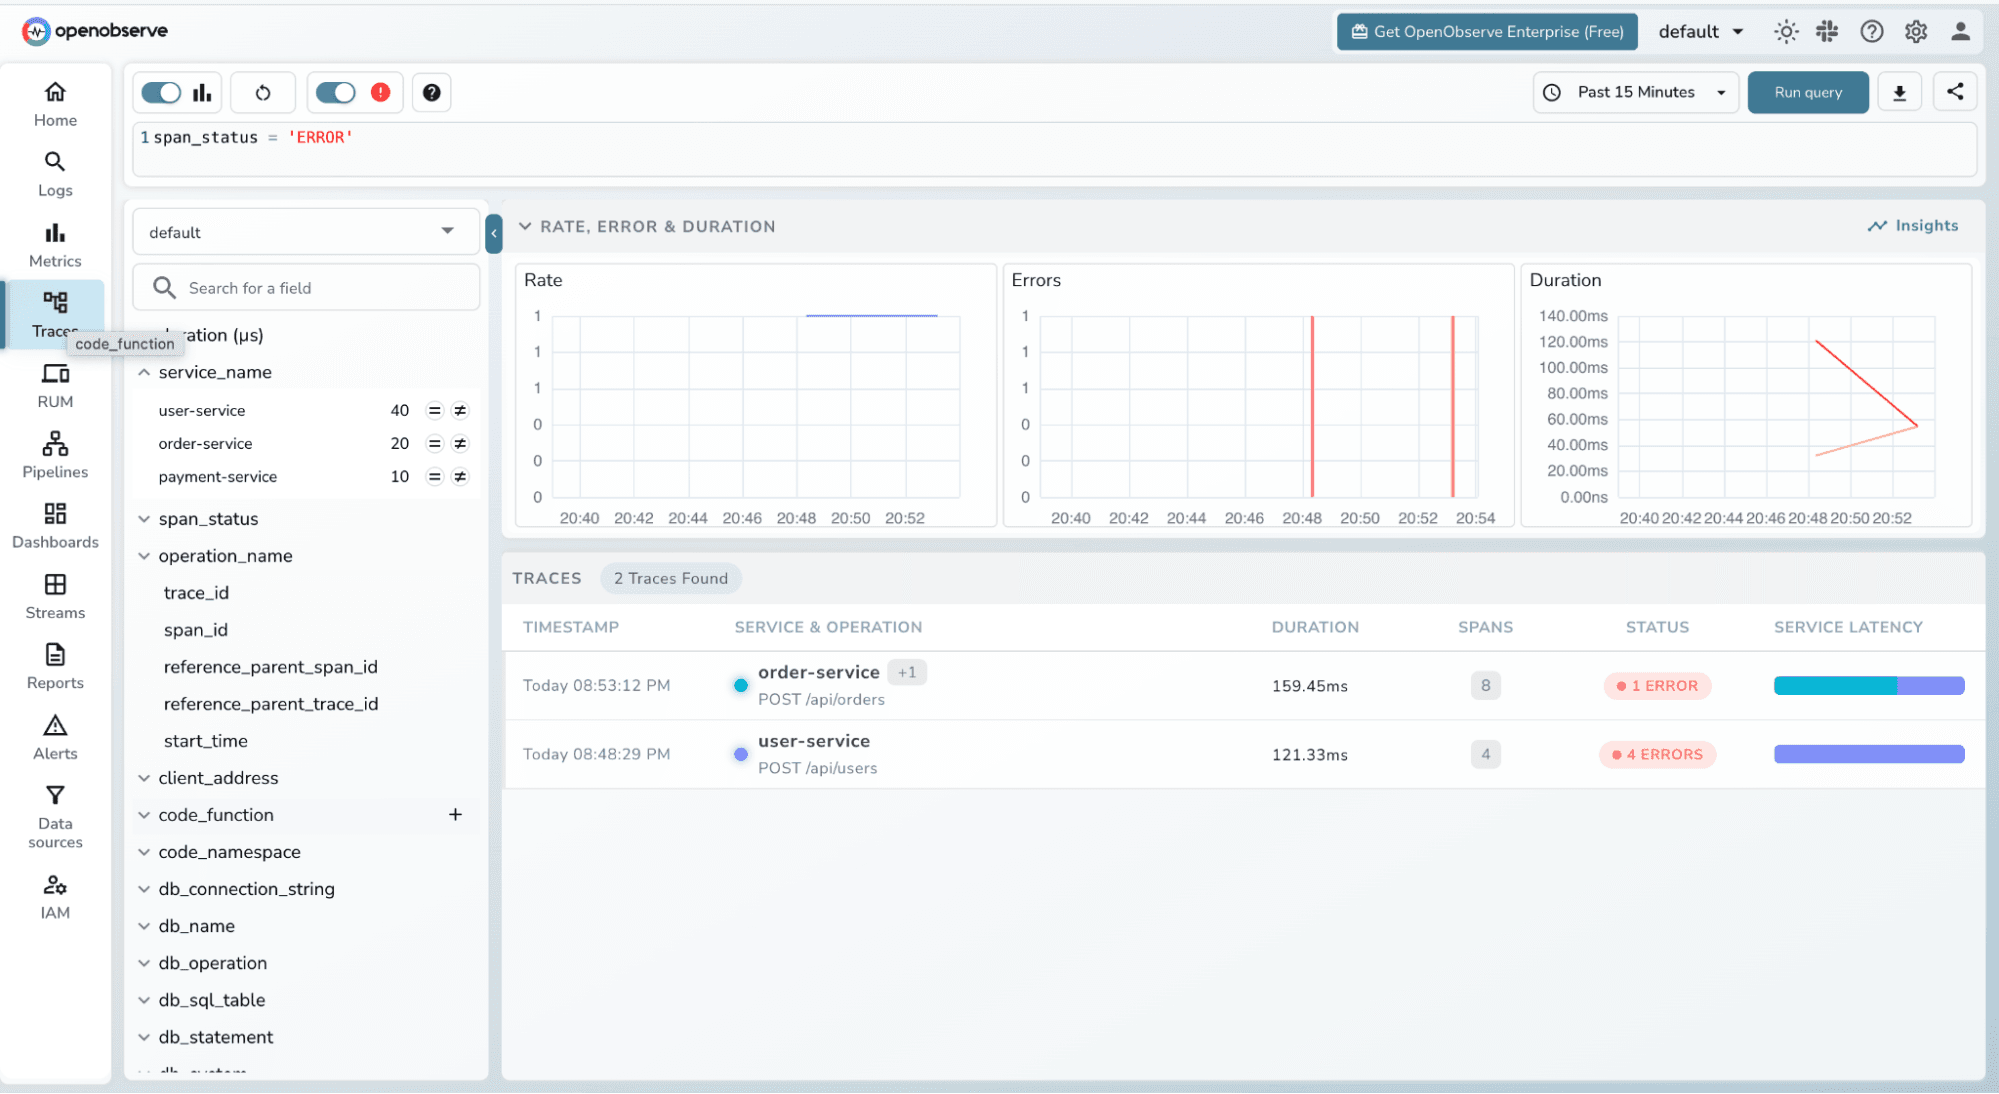
- Use the duration slider to find slow outliers
- Filter by `operation_name` to focus on a specific endpoint
### **Flamegraph and Gantt Chart: The Full Picture**
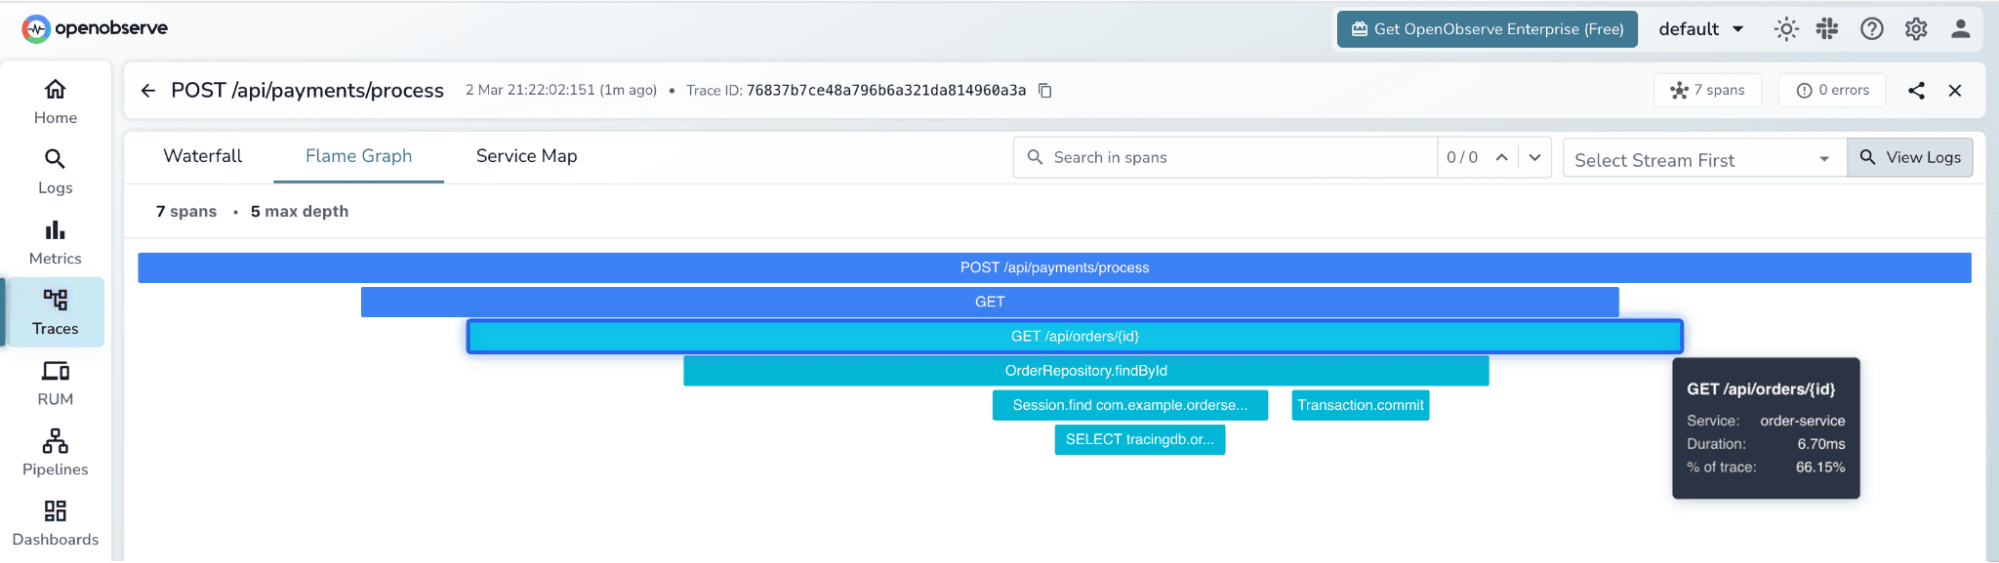
Click on any trace from the `POST /api/payments/process` request. OpenObserve opens the trace detail view, which shows two visualizations:
**Flamegraph** - each span is rendered as a proportionally-sized horizontal block nested under its parent. The payment service span is the root; underneath it you can see the `order-service` span and within that the `user-service` span and its MySQL JDBC span. The width of each block represents time wider means slower. You immediately see which service contributed most to the total latency.
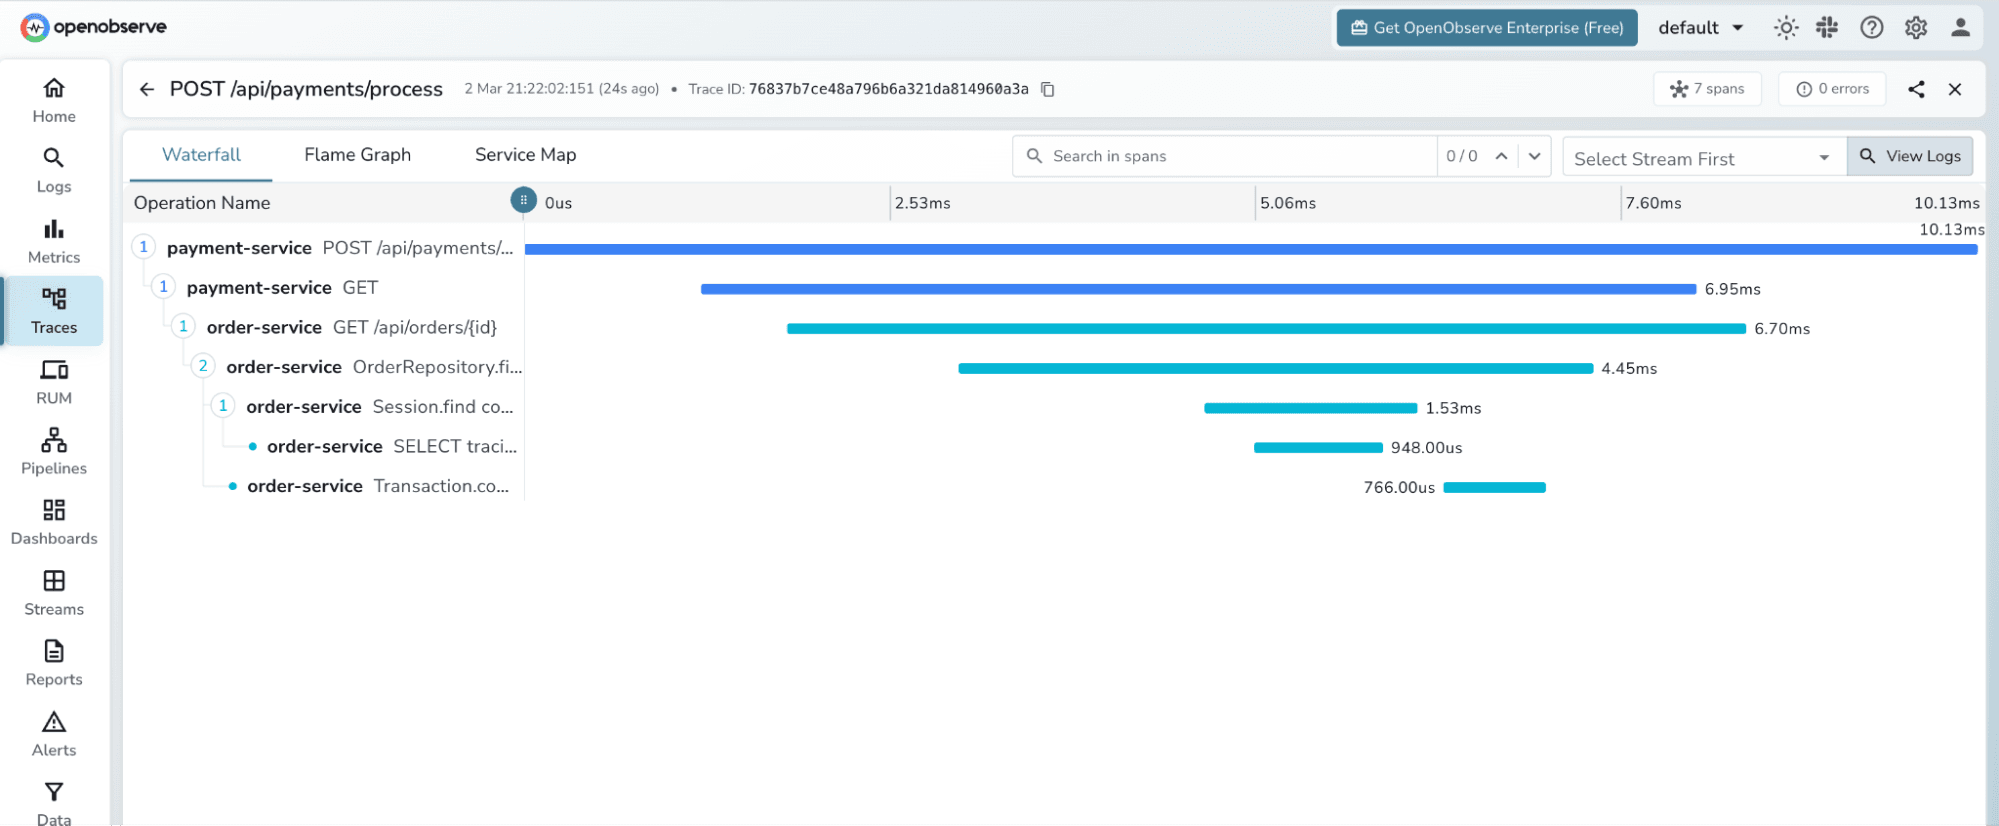
**Gantt Chart** the same spans laid out on a timeline. Each row is one span, with start time and duration shown as a bar. Clicking a span opens its detail panel, which shows:
- HTTP method, URL, response status code
- Database table and SQL query (for JDBC spans)
- Exception message and stack trace (for errored spans)
- `trace_id` and `span_id`
- All OpenTelemetry semantic convention attributes
### **Querying Traces with SQL**
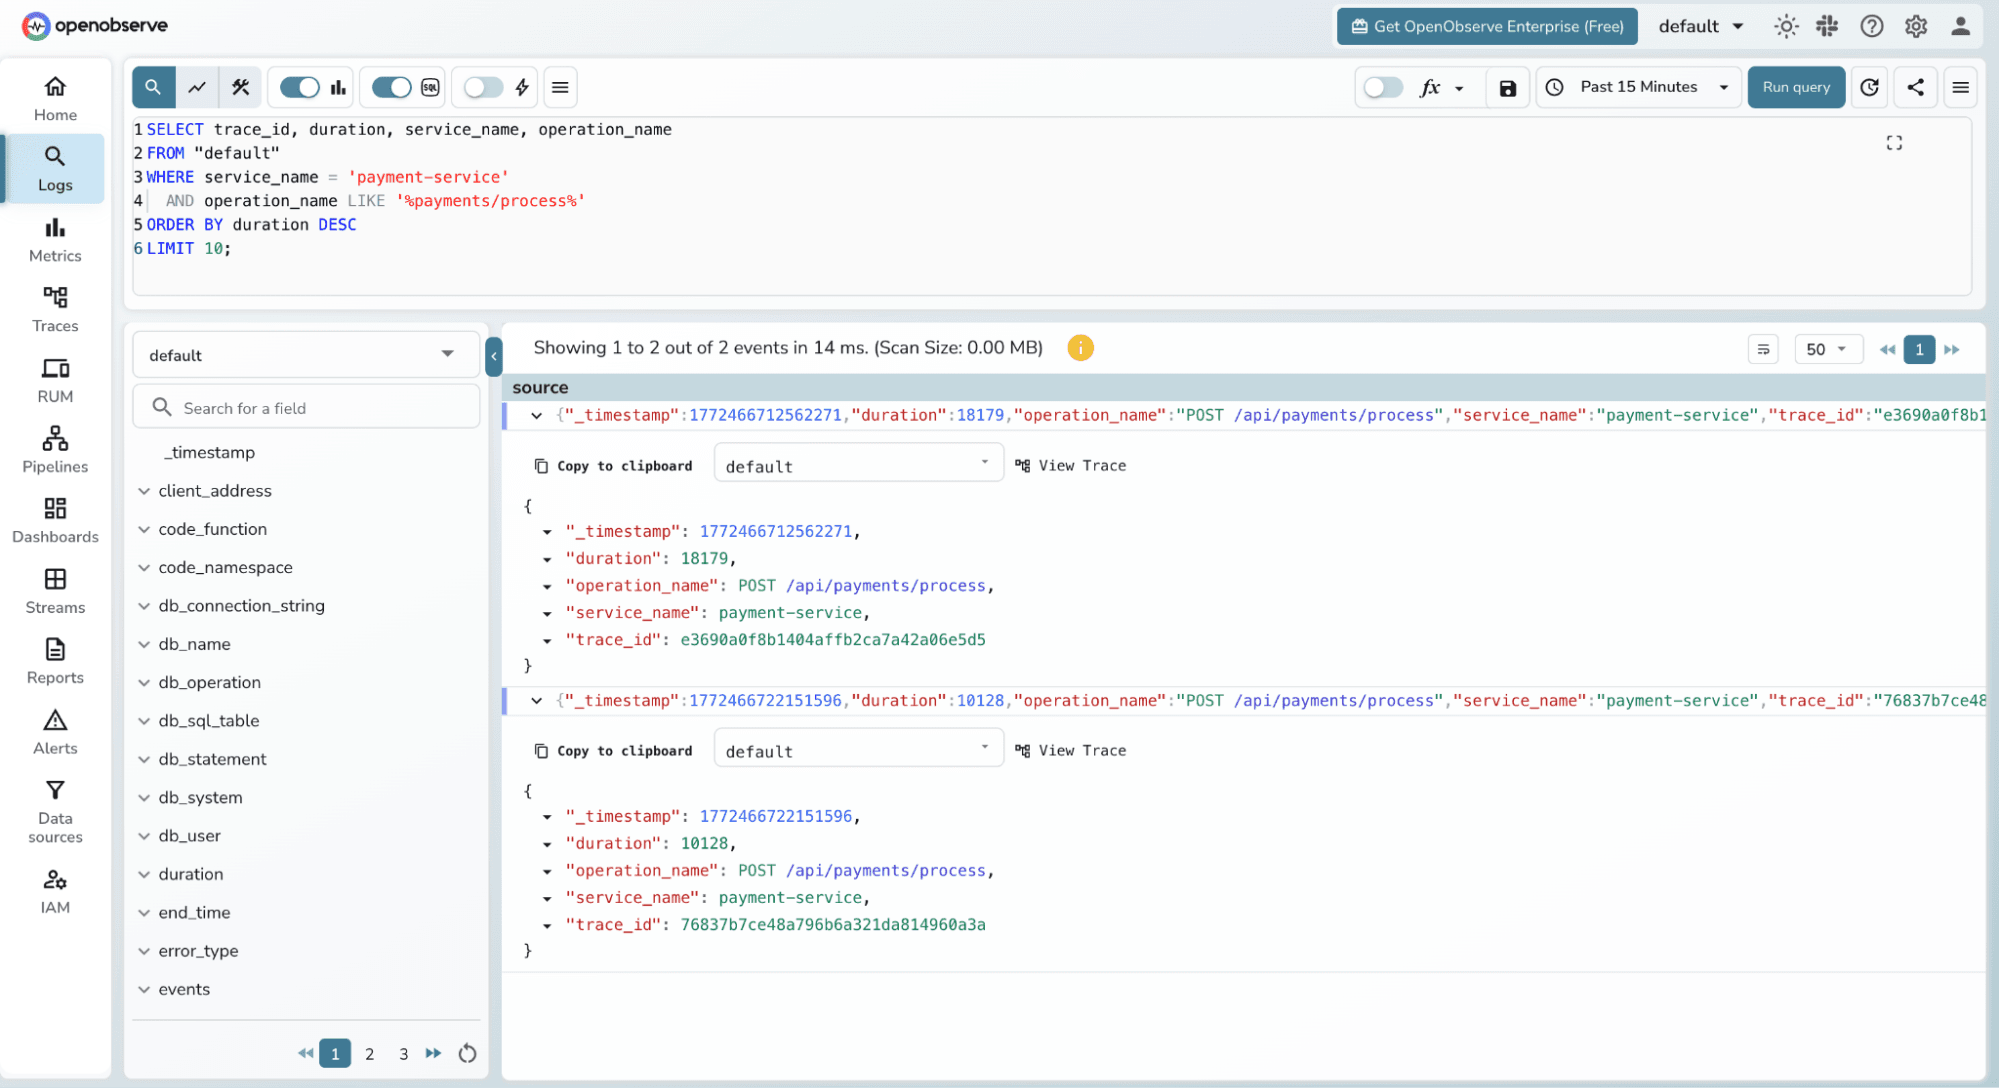
One of OpenObserve's standout features is the ability to query your trace data directly using SQL. Click **Logs** (traces are queryable through the same SQL interface) and select the `default` stream.
**Find the slowest payment traces in the last hour:**
```sql
SELECT trace_id, duration, service_name, operation_name
FROM "default"
WHERE service_name = 'payment-service'
AND operation_name LIKE '%payments/process%'
ORDER BY duration DESC
LIMIT 10;
```
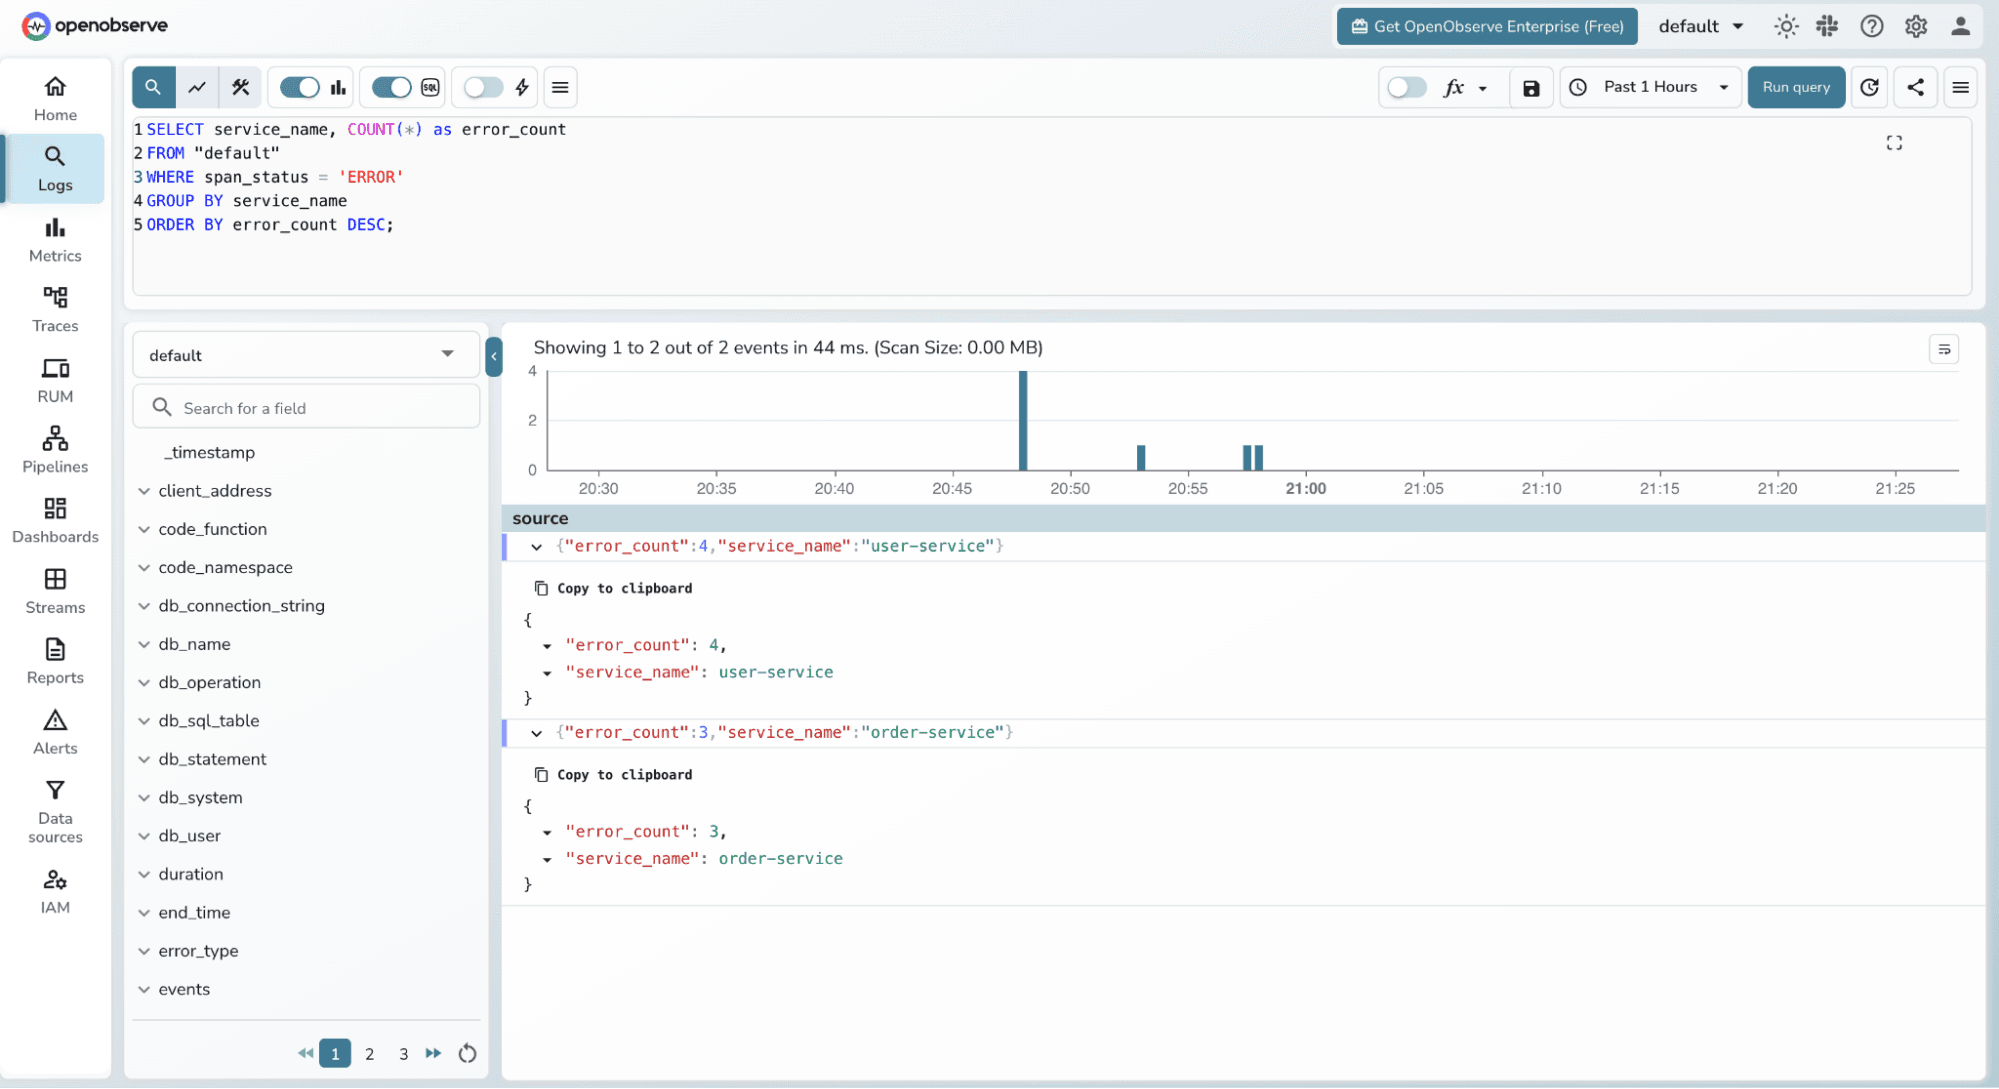
**Count errors by service:**
```sql
SELECT service_name, COUNT(*) as error_count
FROM "default"
WHERE span_status = 'ERROR'
GROUP BY service_name
ORDER BY error_count DESC;
```
**Average latency per service:**
```sql
SELECT service_name,
AVG(duration) as avg_duration_us,
MAX(duration) as max_duration_us,
COUNT(*) as request_count
FROM "default"
GROUP BY service_name;
```
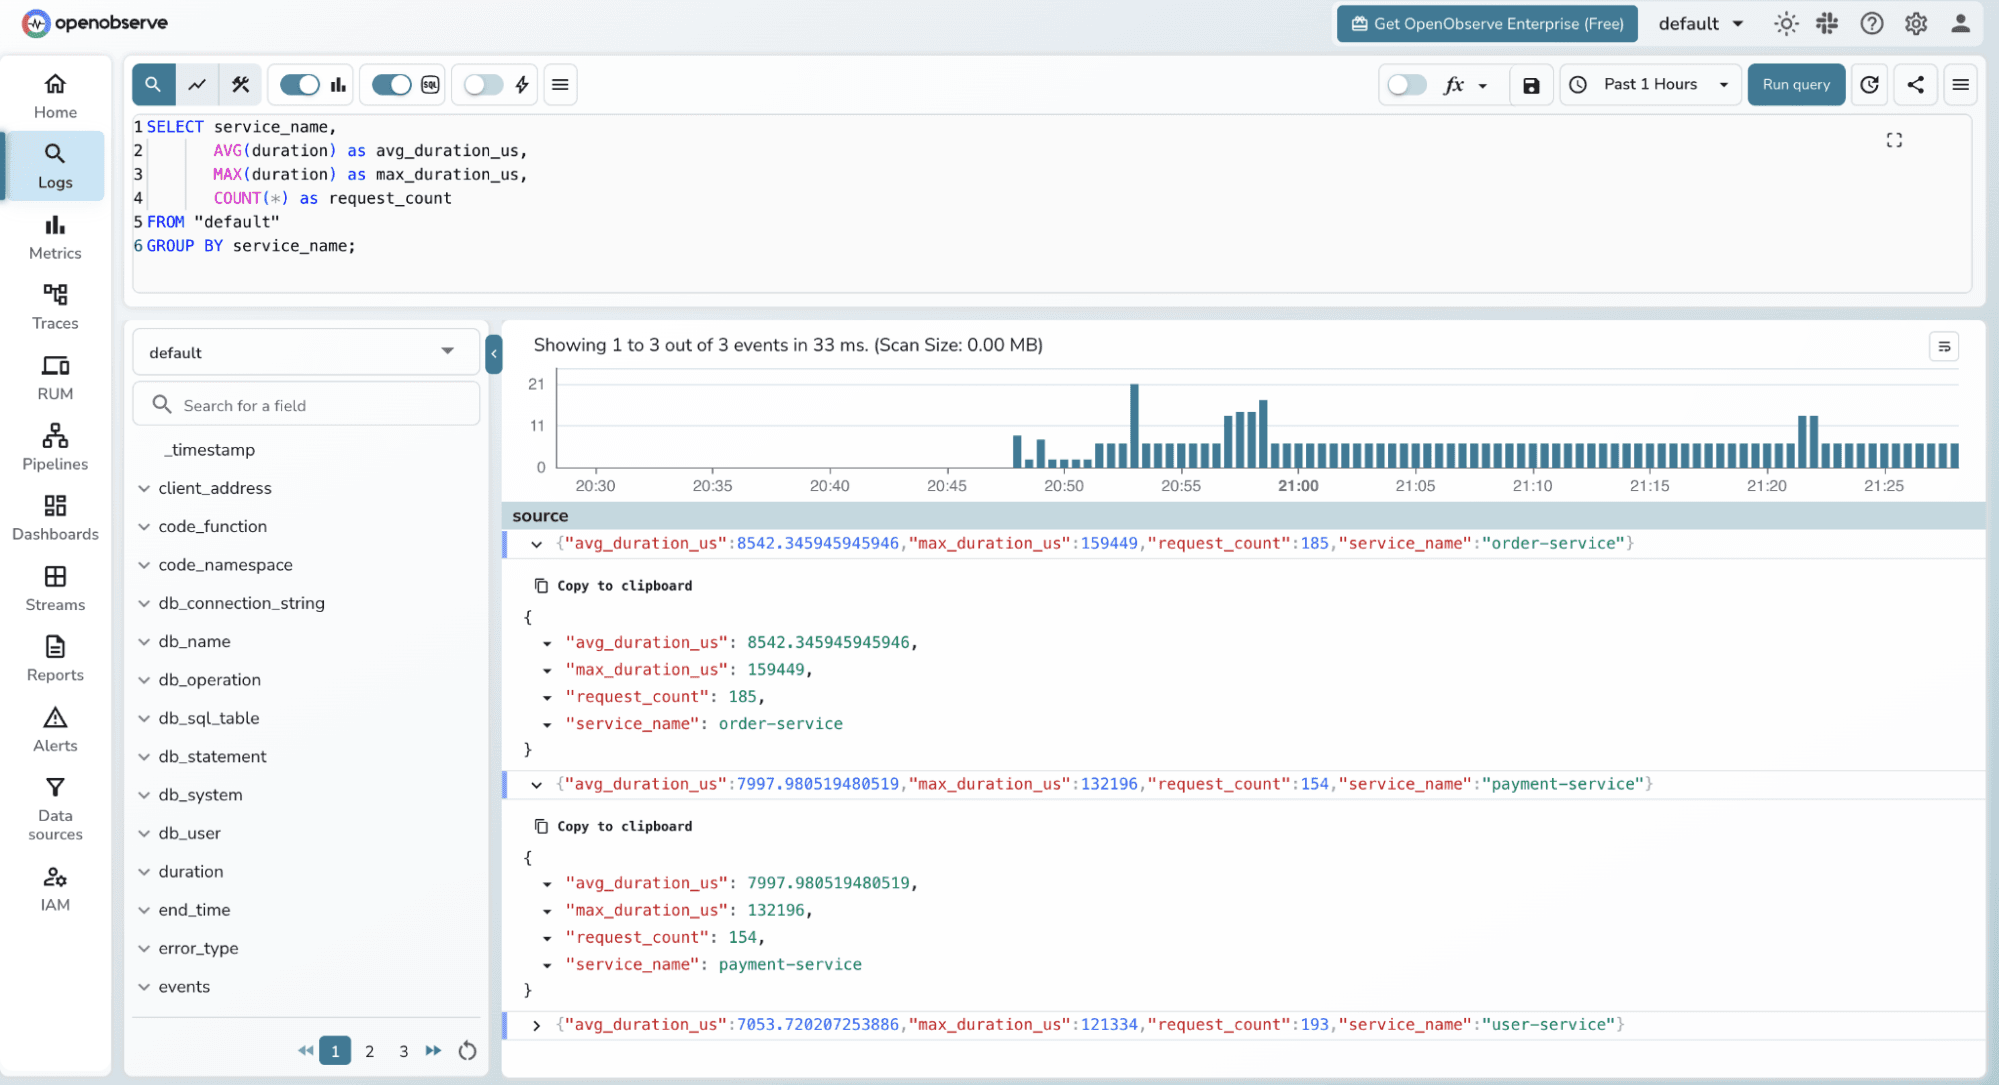
This SQL interface means you can build custom dashboards and alerts on top of your trace data using the same query language you already know.
## **What the OpenTelemetry Agent Captures Automatically**
One thing worth emphasizing: **we wrote zero tracing code** in any of the Spring Boot services. The OpenTelemetry Java Agent detected and instrumented:
- All inbound HTTP requests (Spring Web MVC) creates a server span for each request
- All outbound HTTP calls via `RestTemplate` creates a client span and injects `traceparent` headers
- All JDBC queries (MySQL via Spring Data JPA) creates a DB span with query details
- Context propagation the `trace_id` flows from `payment-service` to `order-service` to `user-service` automatically via the W3C `traceparent` header
The agent supports 100+ libraries and frameworks out of the box, including Kafka, gRPC, Redis, Spring Batch, and more.
## **Conclusion**
In this tutorial, we built a complete Java microservices application from scratch and implemented distributed tracing with zero instrumentation code. The combination of the OpenTelemetry Java Agent and OpenObserve gives you:
- **Automatic** span creation across Spring Boot, JDBC, and RestTemplate
- **Full trace propagation** across service boundaries via W3C `traceparent` headers
- **Rich visualization** flamegraphs, Gantt charts, and span attribute detail in OpenObserve
- **SQL-powered analysis** query your trace data like a database table
- **Unified observability** the same OpenObserve instance can receive your logs and metrics too
The architecture shown here scales directly to production. Swap the single-container OpenObserve setup for a Helm deployment with S3 storage, and you have an enterprise-grade observability stack with no vendor lock-in.
## Further Read
- [Distributed Tracing in .NET Applications using OpenTelemetry](https://openobserve.ai/blog/distributed-tracing-in-dotnet-application/)
- [Distributed Tracing in Go Applications with OpenTelemetry and OpenObserve](https://openobserve.ai/blog/monitoring-go-with-opentelemetry/)
- [Distributed Tracing in Node.js Applications with OpenTelemetry](https://openobserve.ai/blog/distributed-tracing-in-nodejs-with-opentelemetry/)