# High Cardinality in Observability: Causes, Costs & Fixes
> Learn what high cardinality means for metrics, logs, and traces, why it breaks time-series databases and budgets, and how to measure and handle it.
Source: https://openobserve.ai/blog/high-cardinality/
Published: 2026-11-20
Authors: Manas Sharma
Category: Engineering
Tags: OpenObserve, Observability, Metrics, OpenTelemetry, Cost, Monitoring
---
High cardinality is when a field, label, or attribute in your telemetry has a very large number of unique values, such as user IDs, request IDs, or pod names. It makes observability data more useful for debugging, but in metrics it multiplies time series, which drives memory use, slow queries, and per-series bills.
## TL;DR
- **Cardinality is the number of unique values in a field,** and in metrics every unique label combination is a separate time series.
- **A single unbounded label, such as user_id, can turn thousands of series into millions,** a problem known as a cardinality explosion.
- **High-cardinality data is valuable** because it pinpoints the exact customer, request, or container behind an incident.
- **Keep unbounded IDs off metric labels, and put them on traces and logs** in a backend that stores them efficiently.
- **[OpenObserve](https://cloud.openobserve.ai) stores telemetry as columnar Parquet on object storage, uses bloom filters for high-cardinality lookups, and bills per GB** instead of per series.
## What is high cardinality?
Cardinality is the number of distinct values a field can take. A field such as `http_method` has low cardinality (GET, POST, PUT, DELETE, PATCH). A field such as `region` has a few dozen values at most. A field such as `user_id`, `session_id`, `trace_id`, or `container_id` can have millions of values, which is what observability teams call high cardinality. For a one-paragraph definition, see the [high cardinality glossary entry](/glossary/what-is-high-cardinality/).
| Field | Example values | Typical cardinality |
| --- | --- | --- |
| `http_method` | GET, POST, PUT | Low (under 10) |
| `status_code` | 200, 404, 500 | Low (tens) |
| `service_name` | checkout, payments | Medium (tens to hundreds) |
| `k8s_pod_name` | checkout-7d9f-x2k4 | High, and changes with every deploy |
| `user_id` | u_8f2c91 | Very high (users) |
| `trace_id` | 4bf92f3577b34da6 | Unbounded (one per request) |
## What does high cardinality mean in metrics, logs, and traces?
### High cardinality in metrics: one time series per label combination
In a metrics system such as Prometheus, a metric name plus its set of label values identifies one time series. The Prometheus documentation puts it directly: "every unique combination of key-value label pairs represents a new time series, which can dramatically increase the amount of data stored" (Source: Prometheus metric and label naming documentation). That is why cardinality matters most for metrics.
### High cardinality in logs: unique field values
Logs naturally carry high-cardinality fields: request IDs, user IDs, IP addresses, and error messages with embedded values. Logs are stored as events rather than as series, so high cardinality mostly affects how fields are indexed, how large indexes grow, and how fast searches on those fields run.
### High cardinality in traces: span attributes
Every span has a unique span ID and every trace a unique trace ID, so trace data is high cardinality by design. Spans also carry attributes such as `user.id`, `tenant.id`, and `http.route`, which are exactly the fields you filter on during an investigation. For more on how traces are structured, see the [distributed tracing guide](/blog/distributed-tracing-basics-to-beyond-guide/).
## Why does high cardinality matter in observability?
### Why high cardinality data is valuable for debugging
The questions asked during an incident are high-cardinality questions: which customer is seeing errors, which request was slow, which pod restarted, which build introduced the regression. Aggregated, low-cardinality metrics tell you that something is wrong; high-cardinality fields tell you where and for whom.
### Why high cardinality breaks time-series databases
A time-series database keeps an index entry and in-memory state for every active series. Each new label multiplies the series count, and a label with unbounded values multiplies it by the number of values. The result, a cardinality explosion, shows up as rising memory use, slower queries, longer restarts, and in the worst case an out-of-memory crash. Our [Prometheus cardinality bomb guide](/blog/prometheus-data-cardinality/) walks through that failure in detail.
### How fast does a cardinality explosion grow?
Take one counter, `http_requests_total`, in a service with 5 HTTP methods, 10 status codes, 50 endpoints, and 20 pods. Each label multiplies the series count:
Adding a `user_id` label for 10,000 active users would multiply 50,000 series by 10,000, to 500 million series for a single metric. No label-indexed time-series database is sized for that.
### How high cardinality drives observability costs
Many vendors bill metrics per series, so cardinality is also a pricing problem. Datadog bills custom metrics at $5 per 100 custom metrics per month (Source: Datadog pricing page, November 2026), and a Datadog custom metric is a unique combination of metric name and tag values. Grafana Cloud bills metrics from $6.50 per 1,000 active series on the Pro plan (Source: Grafana Cloud pricing page, November 2026).
## What causes a cardinality explosion?
| Cause | Example | Why it explodes |
| --- | --- | --- |
| Unbounded IDs as labels | `user_id`, `session_id`, `request_id` | One series per user, session, or request |
| Ephemeral infrastructure | `pod`, `container_id` | New values on every deploy, restart, and scale-out |
| Raw URLs as labels | `/orders/84712/items` | One series per resource ID in the path |
| Error messages as labels | `error="timeout after 3021ms"` | Values embed numbers and IDs |
| Auto-generated metrics | OpenTelemetry instrumentation defaults | Libraries may add attributes you didn't plan for |
| Histogram buckets | `le` on many histograms | Each bucket is its own series per label set |
Ephemeral infrastructure is the cause teams most often miss: a pod label is bounded at any moment, but every rollout creates a new set of values, so the number of series stored over a retention window keeps growing.
## How do you measure cardinality?
### How to measure cardinality in Prometheus with PromQL
```promql
# Total active series
count({__name__=~".+"})
# Top 10 metrics by series count
topk(10, count by (__name__)({__name__=~".+"}))
# Distinct values of one label on one metric
count(count by (pod) (http_requests_total))
```
Prometheus also exposes per-metric and per-label series counts on the **Status > TSDB Status** page.
### How to measure field cardinality with SQL in OpenObserve
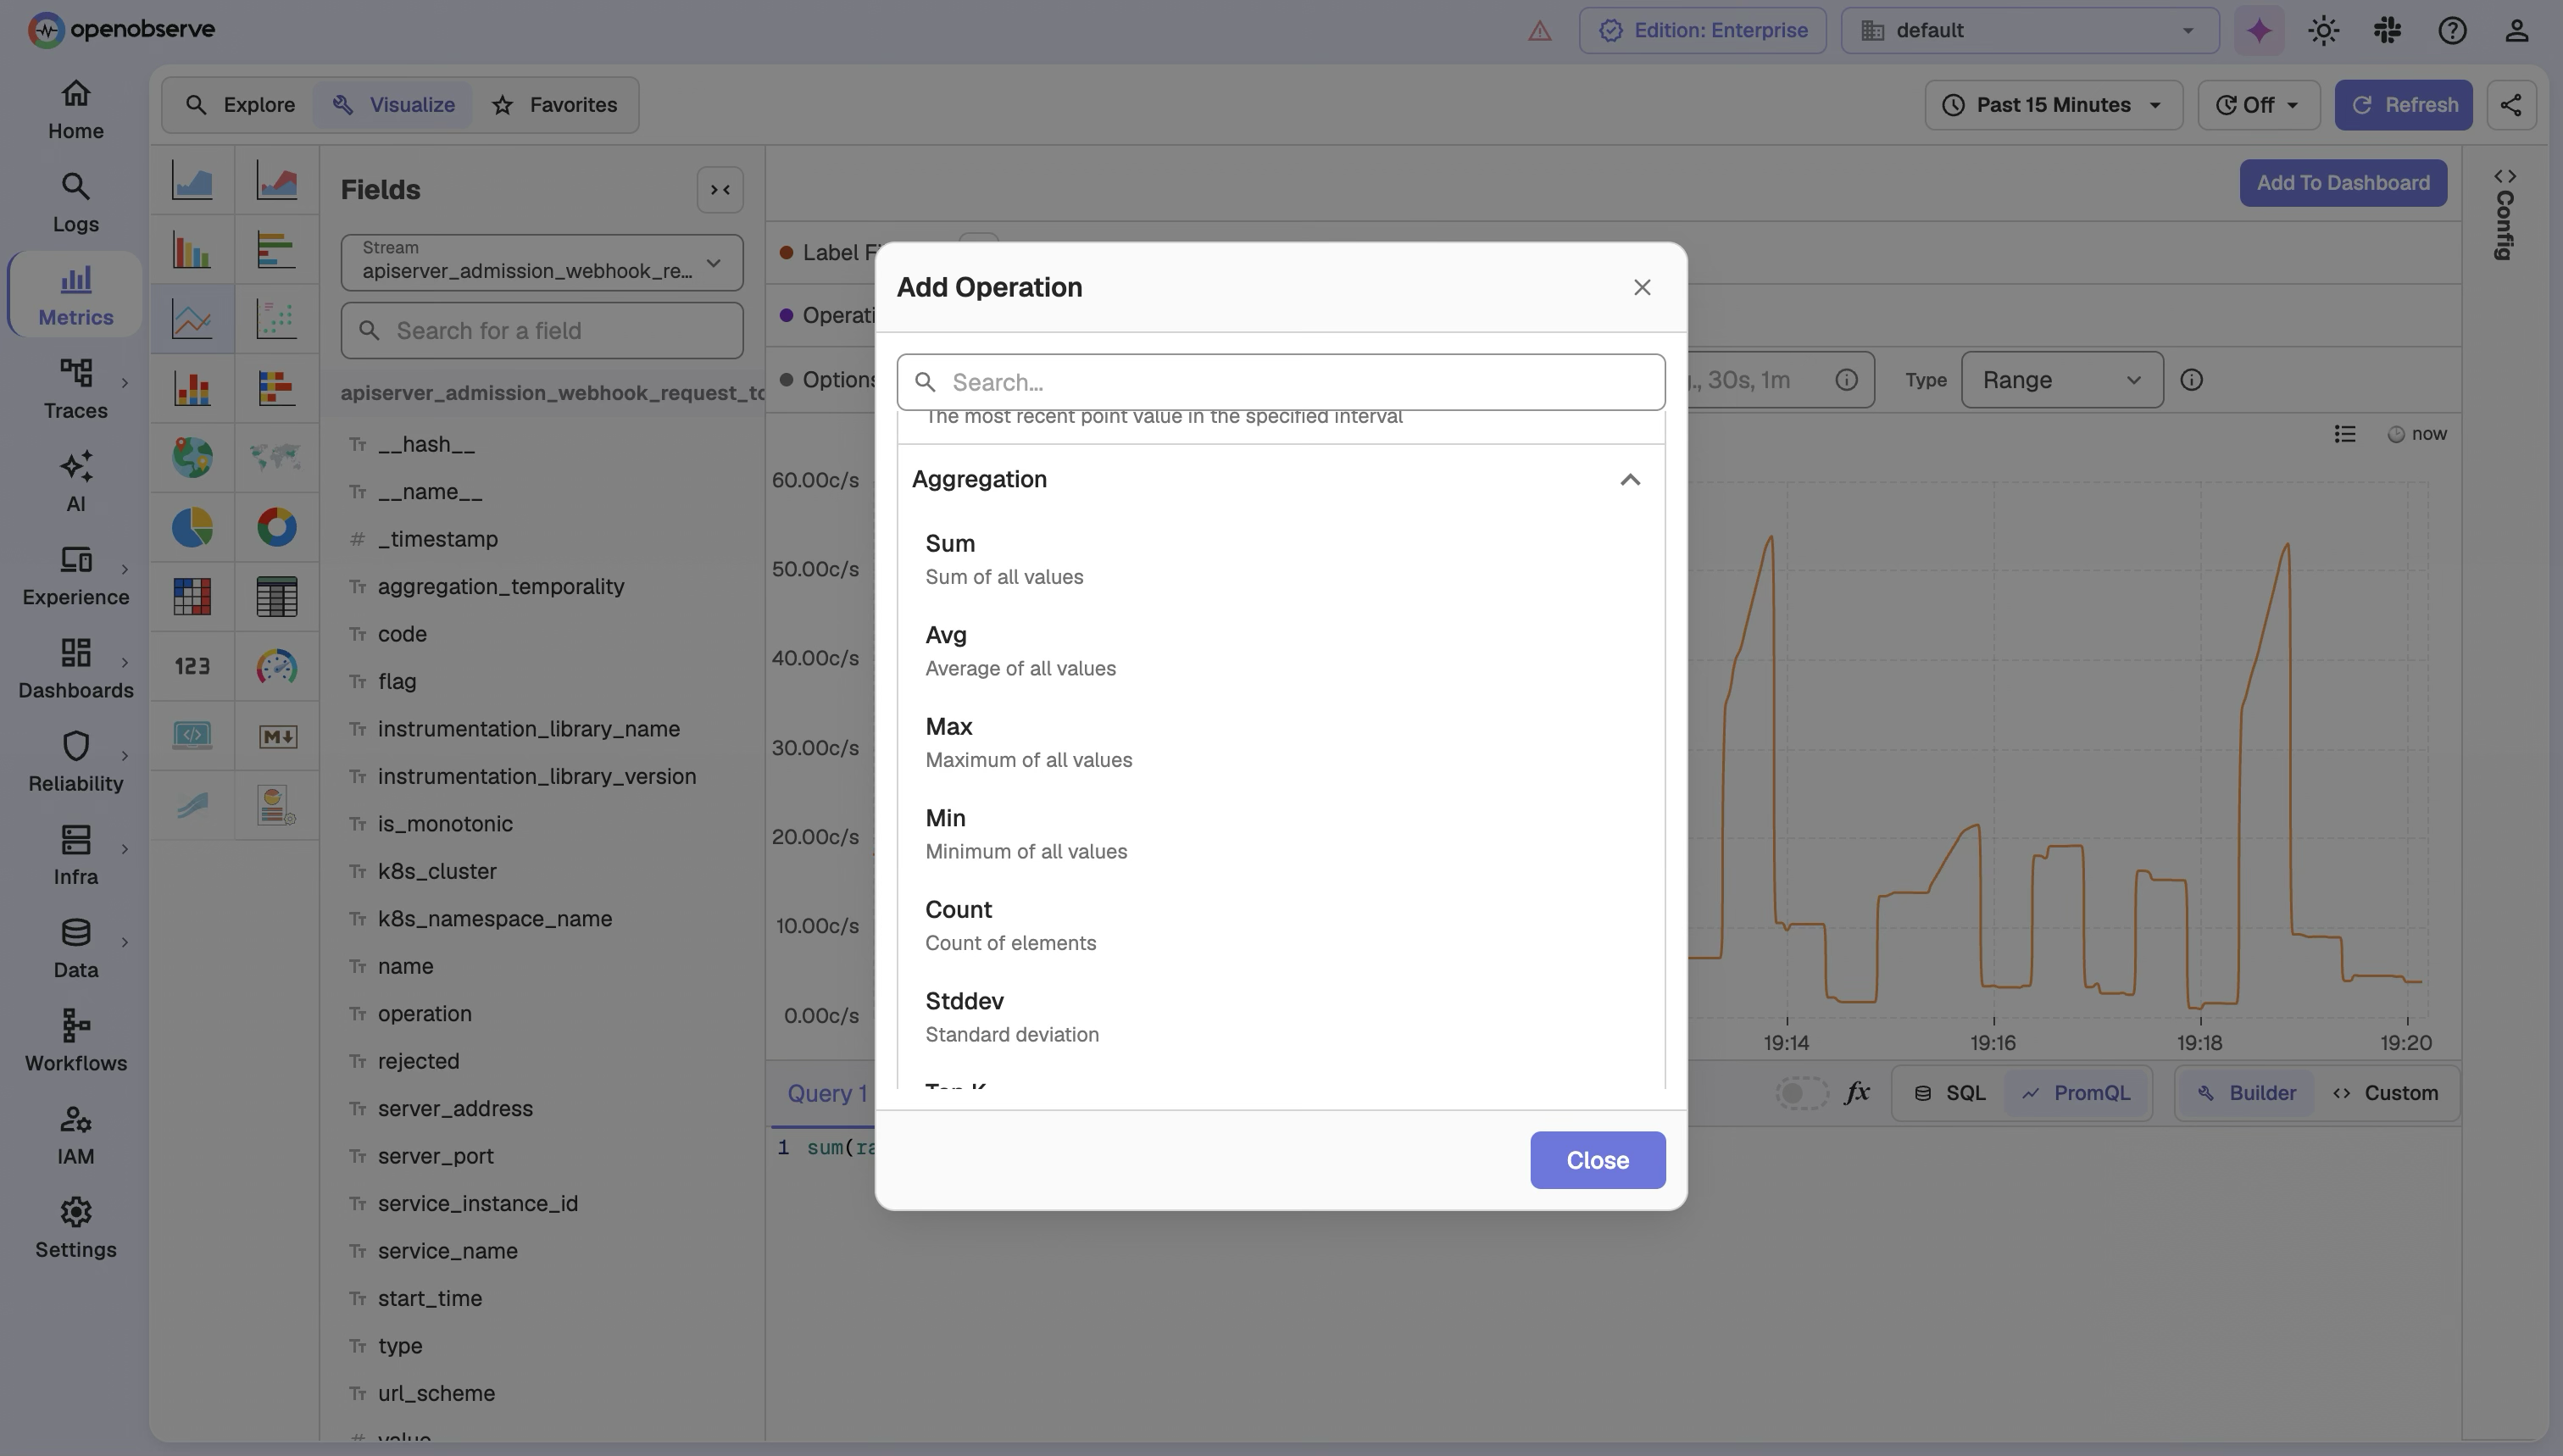
In OpenObserve, logs, traces, and metrics are queryable with SQL, so you can measure the cardinality of any field directly:
```sql
SELECT approx_distinct(user_id) AS users,
approx_distinct(k8s_pod_name) AS pods,
approx_distinct(trace_id) AS traces
FROM "default"
```
Run it over the last 24 hours and the last 7 days. A field whose distinct count keeps growing with the time window is unbounded and doesn't belong on a metric label.
## How do you handle high cardinality data?
### Keep unbounded IDs out of metric labels
Use metric labels for low and medium cardinality dimensions you aggregate by: service, method, status class, region. Never put user IDs, email addresses, request IDs, or raw URLs on a metric label; template routes instead (`/orders/{id}`).
### Put high cardinality context on traces and logs
Record `user.id`, `tenant.id`, and `request.id` as span attributes and log fields. Traces and logs are stored as events, so a unique value costs only the bytes it adds, and you can still aggregate them with SQL when you need counts per customer.
### Drop or rewrite labels at the OpenTelemetry Collector
Stop high-cardinality attributes before they reach a metrics backend. This OpenTelemetry Collector transform processor deletes a `user_id` attribute from metric data points:
```yaml
processors:
transform/drop-high-cardinality:
metric_statements:
- context: datapoint
statements:
- delete_key(attributes, "user_id")
```
In Prometheus, `metric_relabel_configs` does the same at scrape time:
```yaml
metric_relabel_configs:
- action: labeldrop
regex: user_id
```
The [OpenTelemetry Collector configuration guide](/blog/opentelemetry-collector-configuration-guide/) covers processors in more depth.
### Pre-aggregate and downsample long-term metrics
Recording rules turn expensive high-cardinality queries into small aggregated series, and downsampling keeps long-term metrics at lower resolution. OpenObserve supports [metrics downsampling](https://openobserve.ai/docs/user-guide/data-exploration/metrics/downsampling-metrics/) for older data.
### Index high cardinality fields with bloom filters, not partitions
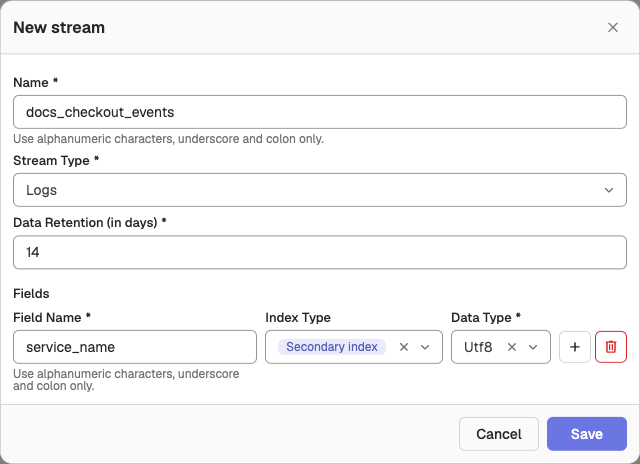
In columnar stores, partitioning a high-cardinality field creates huge numbers of tiny files. OpenObserve's documentation recommends key-value and hash partitions for low-cardinality fields such as environment or namespace, and bloom filters for very high-cardinality fields such as `trace_id`, `request_id`, and UUIDs, with negligible storage overhead (Source: OpenObserve [performance](https://openobserve.ai/docs/enterprise-setup/performance/) and [stream index type](https://openobserve.ai/docs/user-guide/data-processing/streams/data-type-and-index-type-in-streams/) documentation).
### Alert on cardinality growth
Treat series count like any other resource. Alert when total active series or the distinct count of a key label grows faster than traffic, so a bad deploy is caught in minutes rather than when the database runs out of memory.
## High cardinality vs high dimensionality: what is the difference?
Cardinality describes how many unique values one field has. Dimensionality describes how many fields each event carries. A wide event with 200 attributes is high dimensional; a `user_id` field with 5 million values is high cardinality. Modern observability data, especially traces with rich attributes, is both, which is why backends designed around a few low-cardinality labels struggle with it.
| | High cardinality | High dimensionality |
| --- | --- | --- |
| Definition | Many unique values in one field | Many fields per event |
| Example | `user_id` with millions of values | A span with 150 attributes |
| Main risk | Series explosion in metrics | Wide schemas and storage growth |
| Best storage | Columnar events with bloom filters | Columnar storage that reads only queried columns |
## How does OpenObserve handle high cardinality?
OpenObserve is an open-source (AGPL-3.0) observability platform that stores logs, metrics, and traces as compressed Parquet files on object storage. Because data is stored by column rather than as one indexed entry per series, adding unique values grows storage by the bytes they add, not by an index entry per series. In typical log workloads this design delivers approximately 140x lower storage costs compared to Elasticsearch-based stacks; actual results vary based on data entropy and cardinality.
### Columnar storage instead of a per-series index
Queries read only the columns they need and skip files using time partitions and statistics, so a high-cardinality column doesn't slow queries that don't touch it. In our [metrics benchmark against Prometheus and Mimir](/blog/openobserve-vs-prometheus-mimir-metrics-benchmark/), OpenObserve answered `irate` queries over a 1.09-million-series dataset about 15x faster than Prometheus, ran the million-series histogram query about 6x faster, and used about half of Prometheus's memory during ingestion.
### Bloom filters for trace_id and request_id lookups
Bloom filters let OpenObserve skip files that can't contain a given `trace_id` or `request_id`, which keeps needle-in-a-haystack lookups fast across billions of events.
### PromQL and SQL on the same data
Query metrics with PromQL for dashboards and alerts, and with SQL when you need `approx_distinct` or grouping by high-cardinality fields. See how this compares with Datadog in [Datadog vs OpenObserve: metrics](/blog/datadog-vs-openobserve-part-2-metrics/).
### Pricing that doesn't charge per series
OpenObserve bills per GB ingested, with no per-series, per-custom-metric, per-host, or per-user fees. OpenObserve Cloud costs $0.50 per GB on an annual contract or $0.70 per GB pay-as-you-go, plus $0.01 per GB queried ([pricing](https://openobserve.ai/pricing/)).
OpenObserve covers far more than metrics:
- **Telemetry:** logs, metrics, traces with a service graph and service catalog, and continuous profiling.
- **Frontend:** RUM, session replay, and error tracking.
- **Synthetic monitoring:** browser tests and HTTP, TCP, TLS, and SSH checks.
- **AI:** the AI Assistant, the SRE Agent with AI root cause analysis, an MCP server, LLM observability and evaluations, anomaly detection, log patterns, and insights.
- **Alerting and reliability:** scheduled, real-time, composite, and anomaly alerts; incident management; SLOs with burn-rate alerts.
- **Dashboards and reports**, including scheduled PDF, PNG, or CSV reports.
- **Data processing:** pipelines, VRL functions, enrichment tables, and downsampling.
- **Storage and cost:** object storage, bring your own bucket, extended retention, and ingest-based pricing.
- **Security and governance:** SSO, RBAC, multi-tenancy, sensitive data redaction, audit trail, cipher keys, and federated search.
- **Compliance:** SOC 2 Type II, ISO 27001, and GDPR via the EU region.
## Get started with OpenObserve
Start a 14-day free trial on [OpenObserve Cloud](https://cloud.openobserve.ai), or [run OpenObserve self-hosted](https://openobserve.ai/docs/getting-started/). Send your highest-cardinality metrics and traces to it with Prometheus remote write or the OpenTelemetry Collector, and run the `approx_distinct` query above to see where your cardinality comes from. If you are outgrowing Prometheus, our [Prometheus alternatives list](/blog/prometheus-alternatives/) compares the options.