# Auto-Instrumenting Microservices: A Practical Demo with OpenTelemetry and OpenObserve
> Learn how to add complete observability to your microservices for distributed tracing without changing a single line of code. This hands-on demo shows auto-instrumentation across Go, Node.js, Java, Python, and .NET using OpenTelemetry and OpenObserve.
Source: https://openobserve.ai/blog/how-to-auto-instrument-distributed-services/
Published: 2025-10-30
Authors: Chaitanya Sistla
Category: Engineering
Tags: Application, OpenTelemetry, Tracing
---
Understanding how your services interact, where bottlenecks occur, and how requests flow through your architecture can mean the difference between a smooth user experience and production chaos. If you're running microservices across multiple languages, manually instrumenting each one is time consuming and error-prone. Auto-instrumentation with OpenTelemetry solves this problem by giving you complete observability without touching your application code. In this blog, we'll walk through a practical example that demonstrates how to implement auto-instrumentation across five different programming languages for distributed traces in a Kubernetes environment.
## The Magic of Auto-Instrumentation
Distributed Traces implementation requires developers to manually add instrumentation code throughout their applications. This approach is time-consuming, error-prone, and creates technical debt that must be maintained across application updates.
Auto-instrumentation flips this paradigm. With OpenTelemetry's automatic instrumentation, you can gain comprehensive observability by simply adding annotations to your Kubernetes deployments. No code changes required.
## Demonstrating Auto-Instrumentation
To show you exactly how this works, we've built a sample e-commerce application specifically for this purpose. This example application simulates a typical microservices architecture with five distinct services, each written in a different language to demonstrate the versatility of OpenTelemetry's auto-instrumentation capabilities.
### Service Breakdown
**Frontend Service (Go)**: The entry point for all user requests. This service handles the user interface and routes requests to the shop service.
**Shop Service (Node.js)**: Acts as the business logic layer, coordinating between the frontend and product services. When a user requests item information, the shop service orchestrates the entire workflow.
**Product Service (Java)**: The core product catalog service that manages product information. It calls both the review and price services to enrich product data.
**Review Service (Python)**: Handles product reviews and ratings, providing social proof for products.
**Price Service (.NET)**: Manages pricing information, potentially handling dynamic pricing, discounts, and currency conversions.
### How It Works
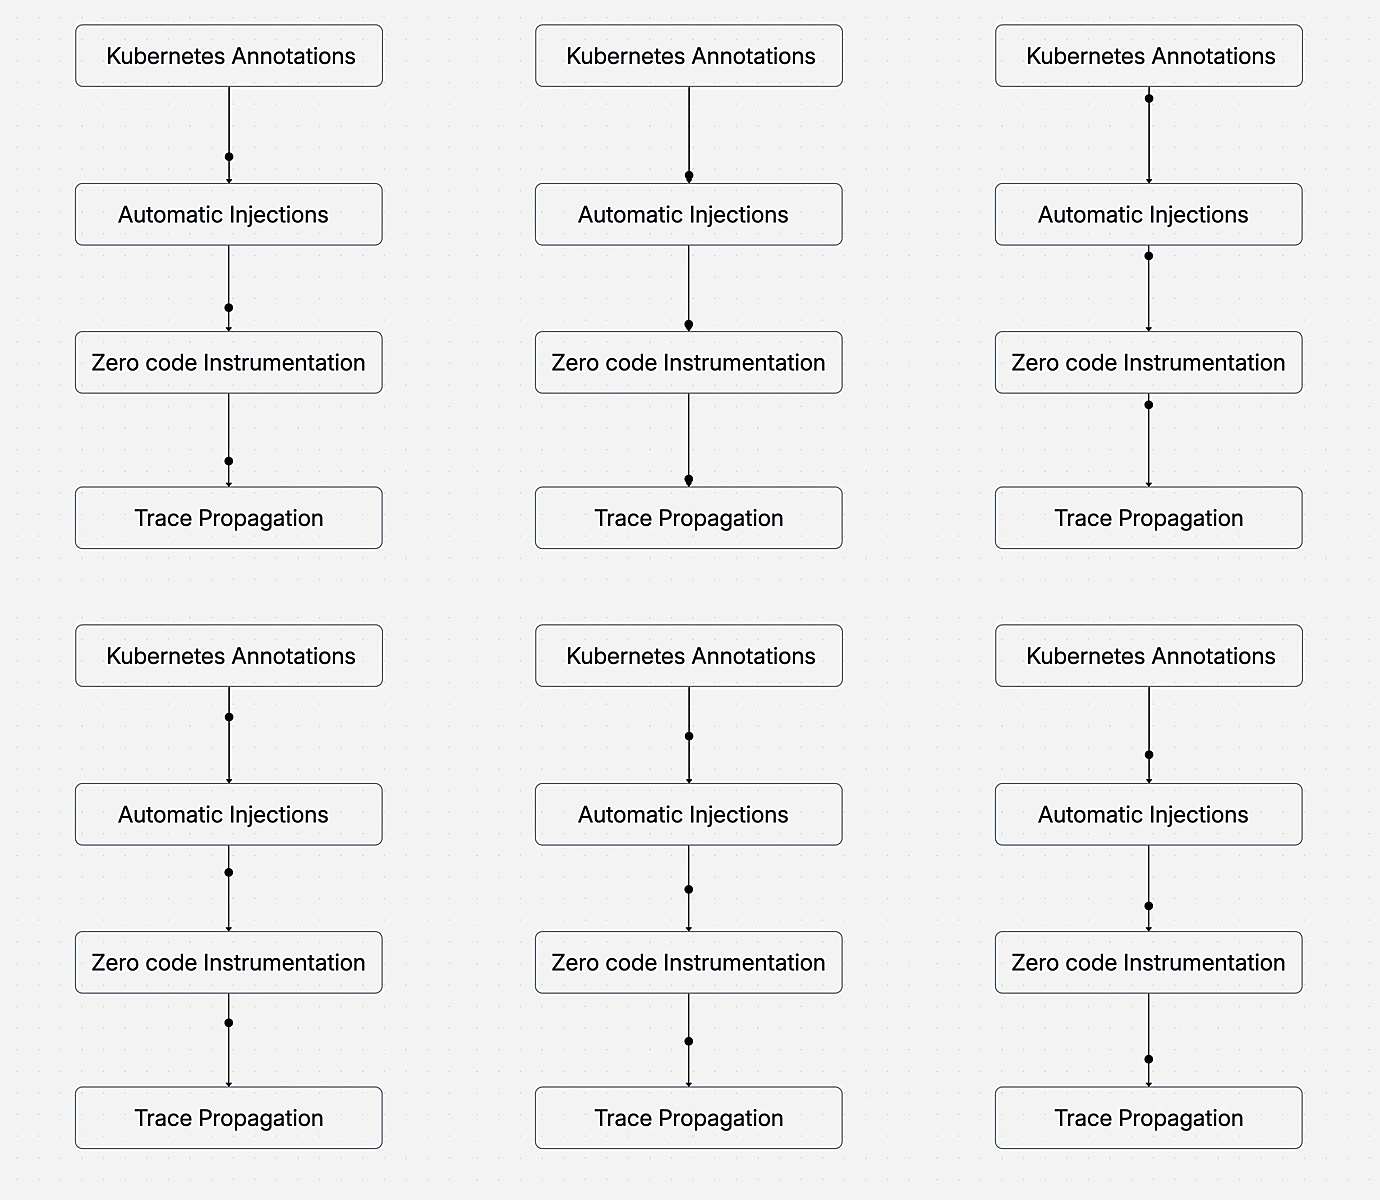
The secret lies in the OpenTelemetry Operator and language-specific instrumentation libraries. Here's what happens behind the scenes:
**Kubernetes Annotations**: Each deployment includes a special annotation that tells the OpenTelemetry Operator which language-specific instrumentation to inject.
**Automatic Injection**: The operator automatically injects the necessary OpenTelemetry agents and libraries into your containers at runtime.
**Zero-Code Instrumentation**: Your application code remains untouched. The instrumentation happens at the runtime level, capturing HTTP requests, database calls, and inter-service communication automatically.
**Trace Propagation**: Context is automatically propagated across service boundaries, creating complete distributed traces that show the entire request journey.
## Language-Specific Implementation Details
Let's examine how auto-instrumentation works for each language in HotCommerce:
### Go (Frontend Service)
```yaml
annotations:
instrumentation.opentelemetry.io/inject-go: "openobserve-collector/openobserve-go"
instrumentation.opentelemetry.io/otel-go-auto-target-exe: "/app"
```
Go uses eBPF (extended Berkeley Packet Filter) technology for auto-instrumentation. This kernel-level instrumentation captures network calls and system events without requiring SDK integration, making it particularly powerful for compiled languages.
### Node.js (Shop Service)
```yaml
annotations:
instrumentation.opentelemetry.io/inject-nodejs: "openobserve-collector/openobserve-nodejs"
```
Node.js instrumentation leverages the dynamic nature of JavaScript, monkey-patching popular libraries and frameworks to capture telemetry data automatically.
### Java (Product Service)
```yaml
annotations:
instrumentation.opentelemetry.io/inject-java: "openobserve-collector/openobserve-java"
```
Java auto-instrumentation uses bytecode manipulation to inject tracing logic into your application at class-loading time, providing comprehensive coverage without performance penalties.
### Python (Review Service)
```yaml
annotations:
instrumentation.opentelemetry.io/inject-python: "openobserve-collector/openobserve-python"
```
Python's dynamic runtime makes it ideal for auto-instrumentation. The instrumentation library wraps common frameworks like Flask, Django, and FastAPI automatically.
### .NET (Price Service)
```yaml
annotations:
instrumentation.opentelemetry.io/inject-dotnet: "openobserve-collector/openobserve-dotnet"
```
.NET instrumentation uses CLR profiling APIs to inject telemetry collection without modifying the application code.
## Getting Started with HotCommerce
Setting up HotCommerce is remarkably straightforward. Here's what you need and how to deploy it.
### Prerequisites
Before you begin, ensure you have:
- A running Kubernetes cluster (local or cloud-based)
- kubectl configured to communicate with your cluster
- OpenObserve-collector and Otel Operator installed in your cluster
### Deployment Steps
**Create the Namespace**
```bash
kubectl create ns hotcommerce
```
This isolates all HotCommerce resources in a dedicated namespace, following Kubernetes best practices.
**Deploy the Application**
```bash
kubectl apply -f https://raw.githubusercontent.com/openobserve/hotcommerce/main/deployment.yaml
```
This single command deploys all five microservices with their respective auto-instrumentation configurations.
**Access the Application**
```bash
kubectl -n hotcommerce port-forward svc/frontend 8001:80
```
Port-forwarding makes the frontend service accessible on your local machine.
**Generate Traces**
Open your browser and navigate to `http://localhost:8001/item/1`. This triggers a cascade of requests through all services, generating rich distributed traces that flow to OpenObserve.
## Understanding the Traces
Once you've generated some traffic, open the OpenObserve traces UI. Here's what you'll see:
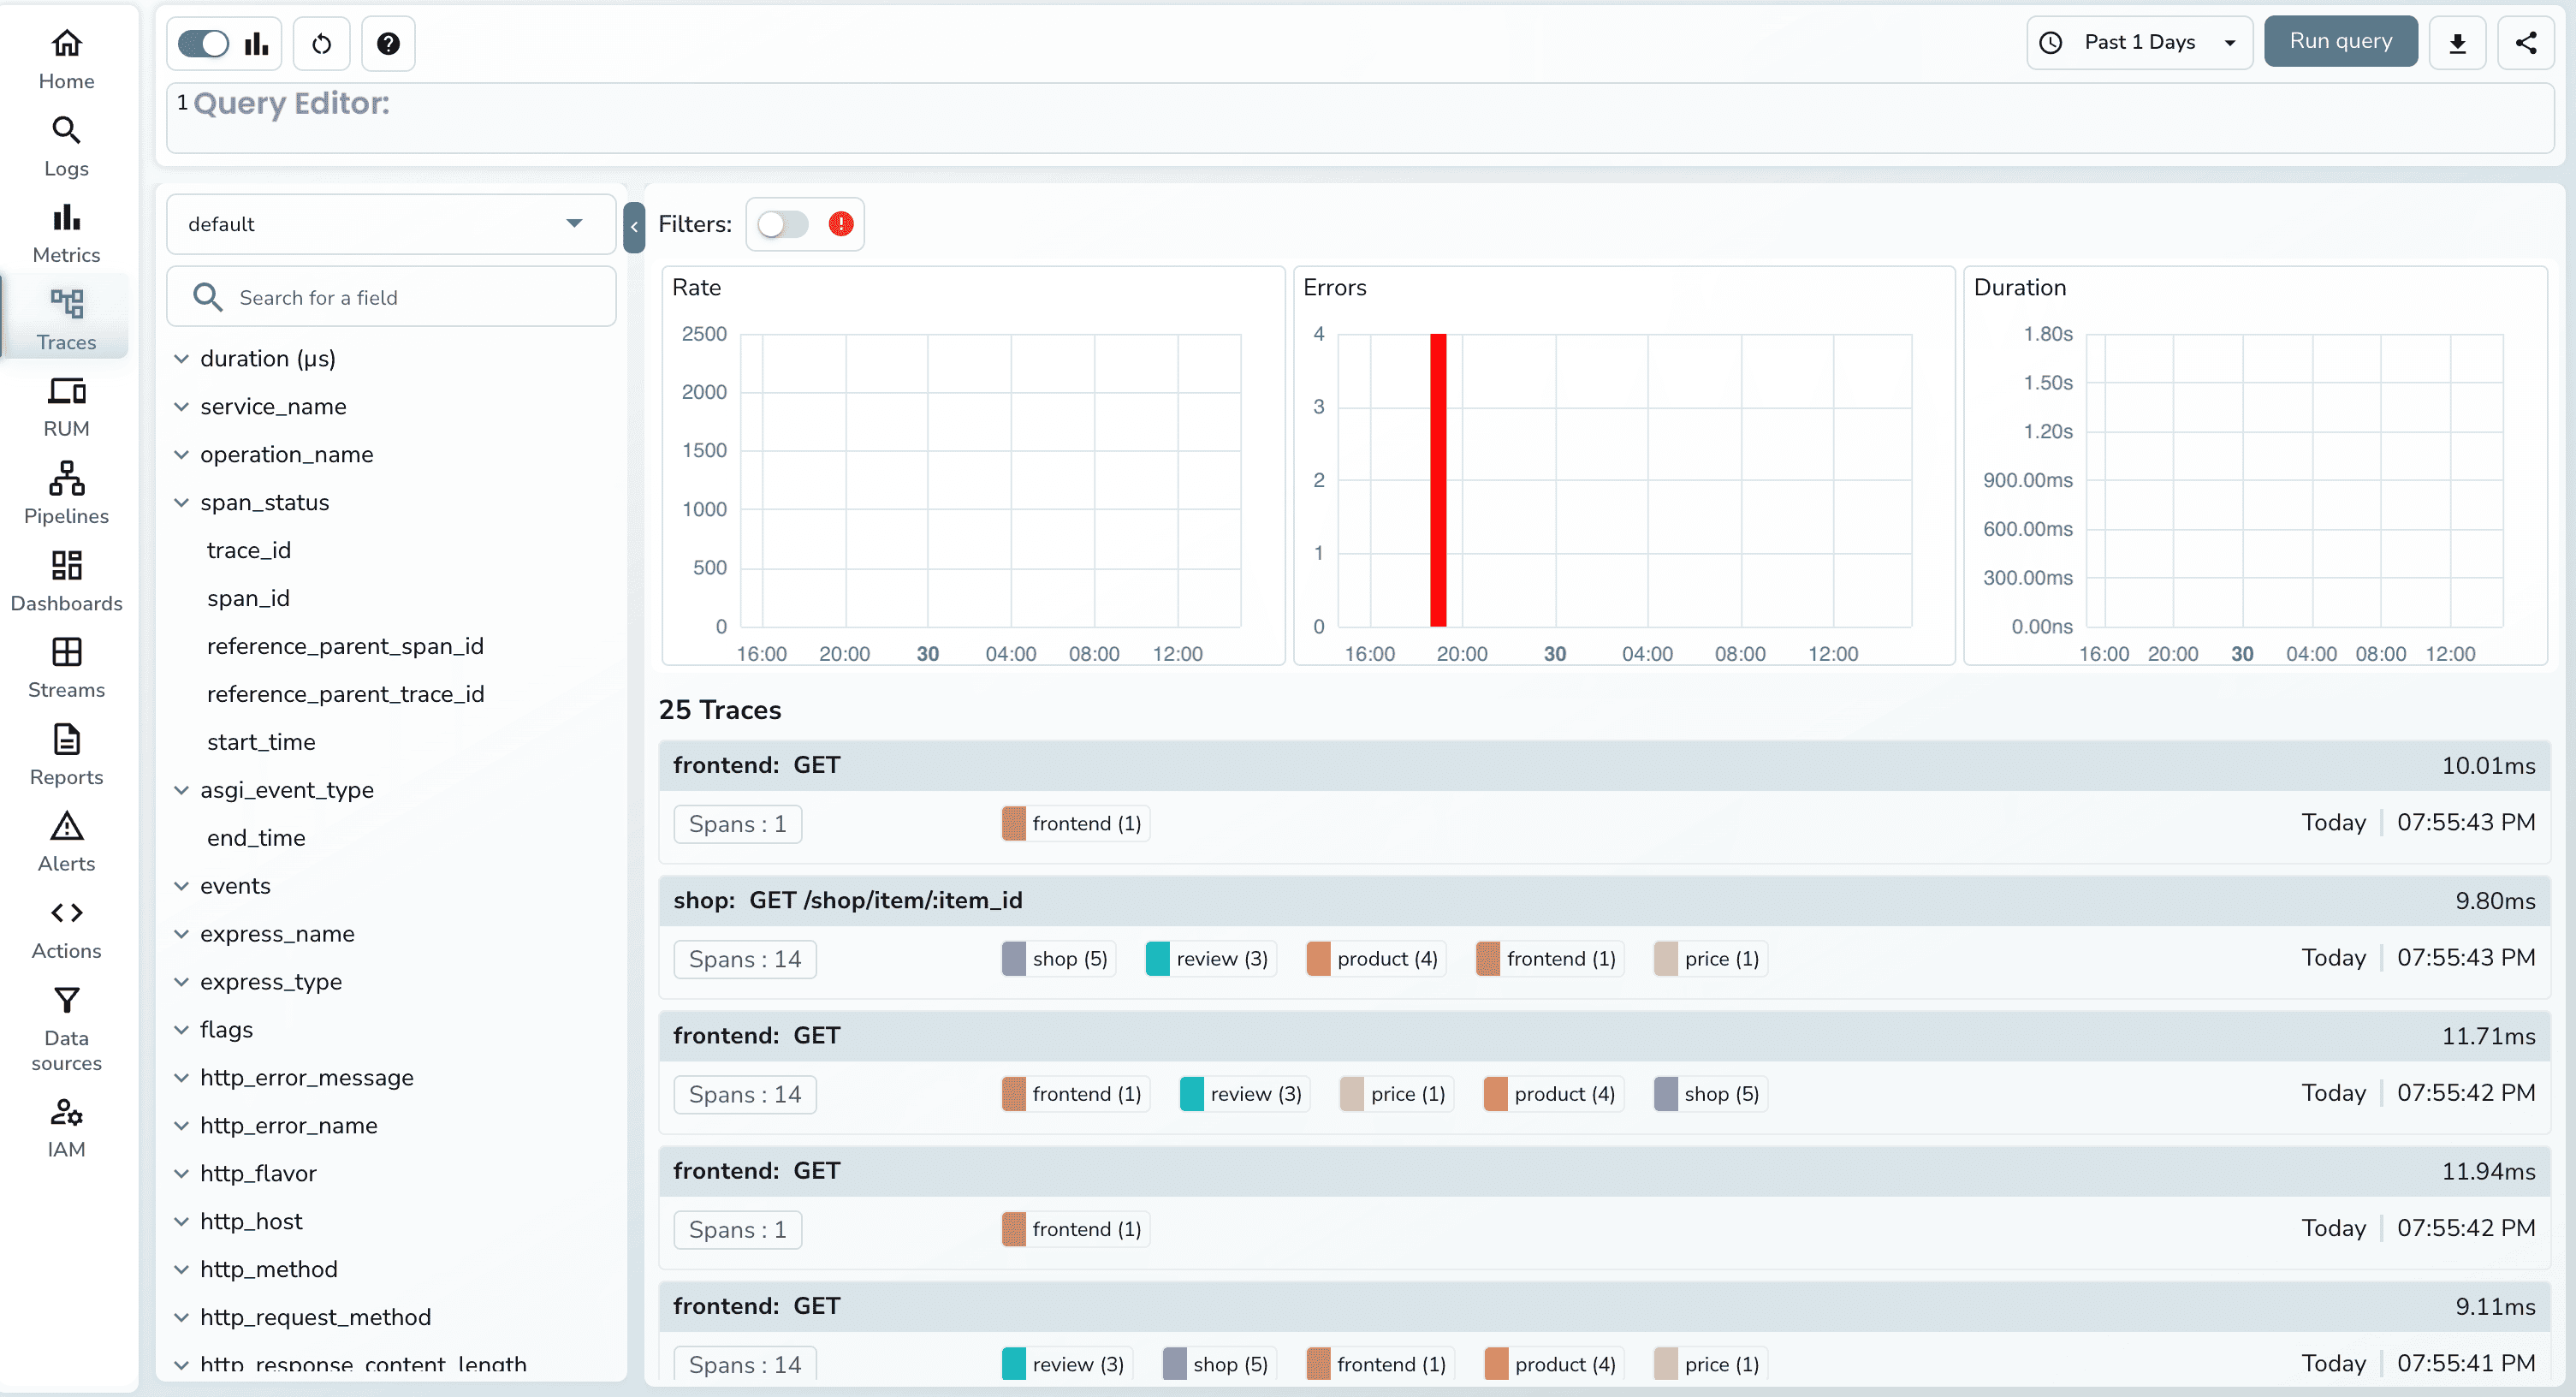
### Complete Request Journey
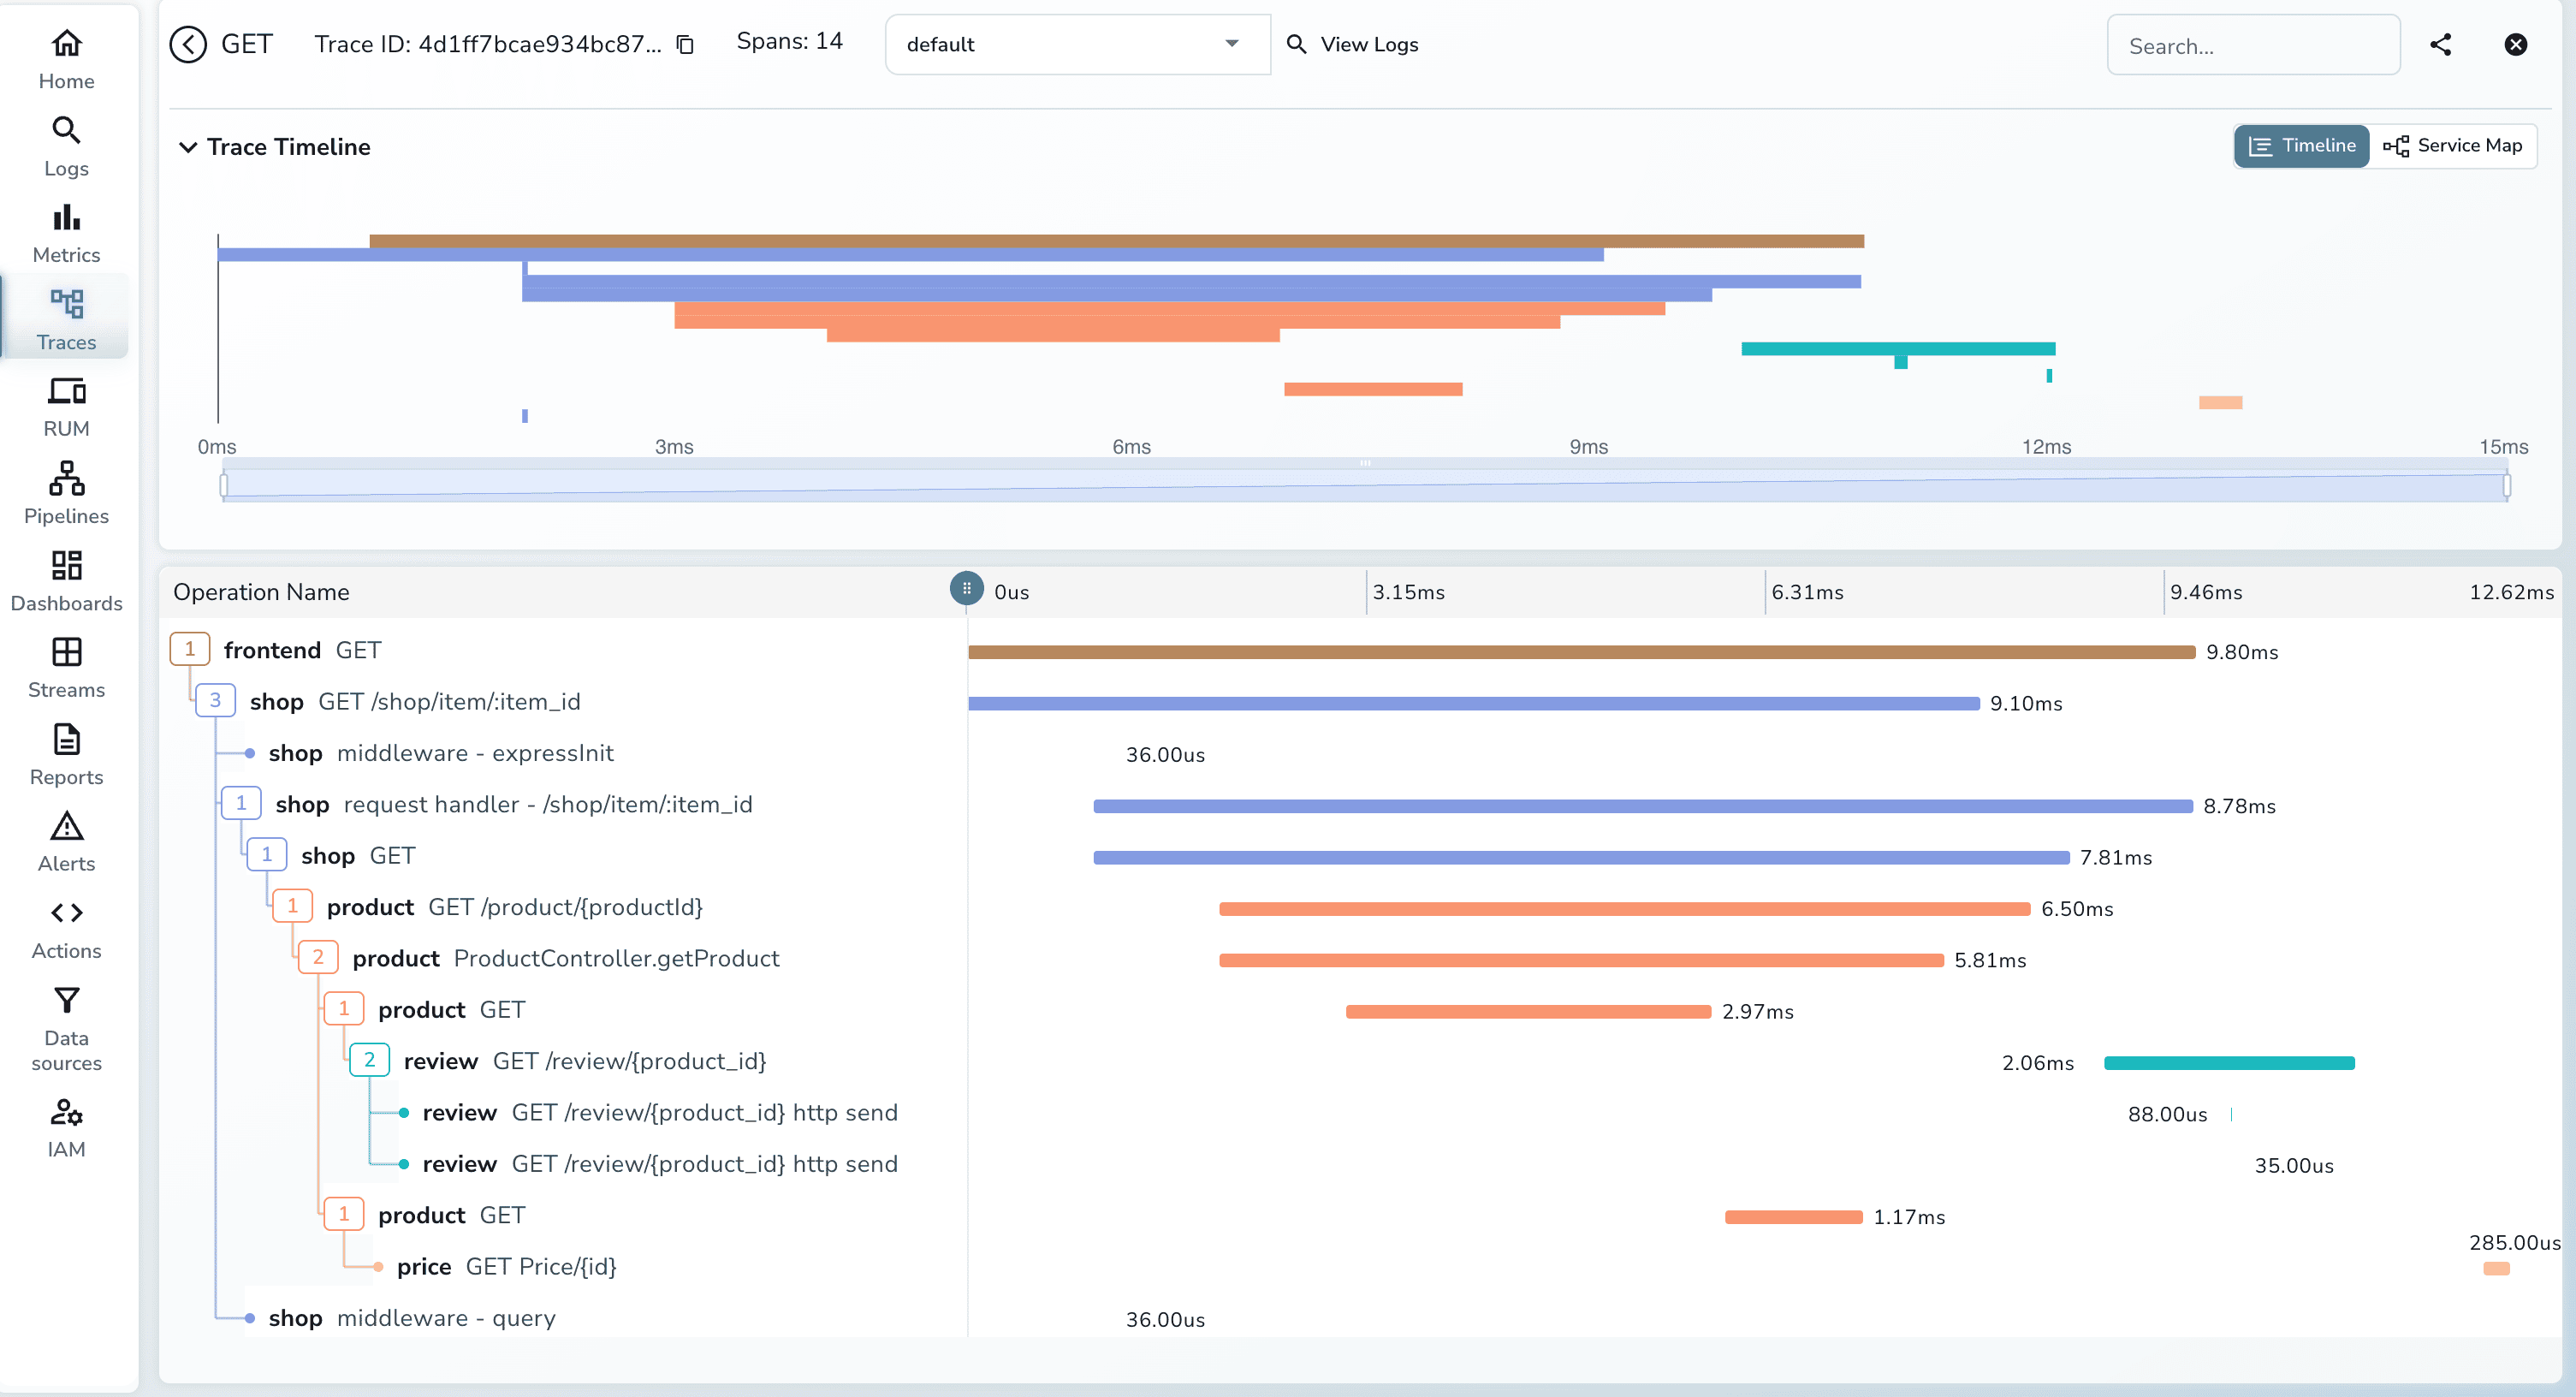
Each trace shows the entire lifecycle of a request:
- Frontend receives the initial request
- Shop service is called to fetch item details
- Product service retrieves product information
- Simultaneously, review and price services are called
- All responses are aggregated and returned to the user
### Service Dependencies
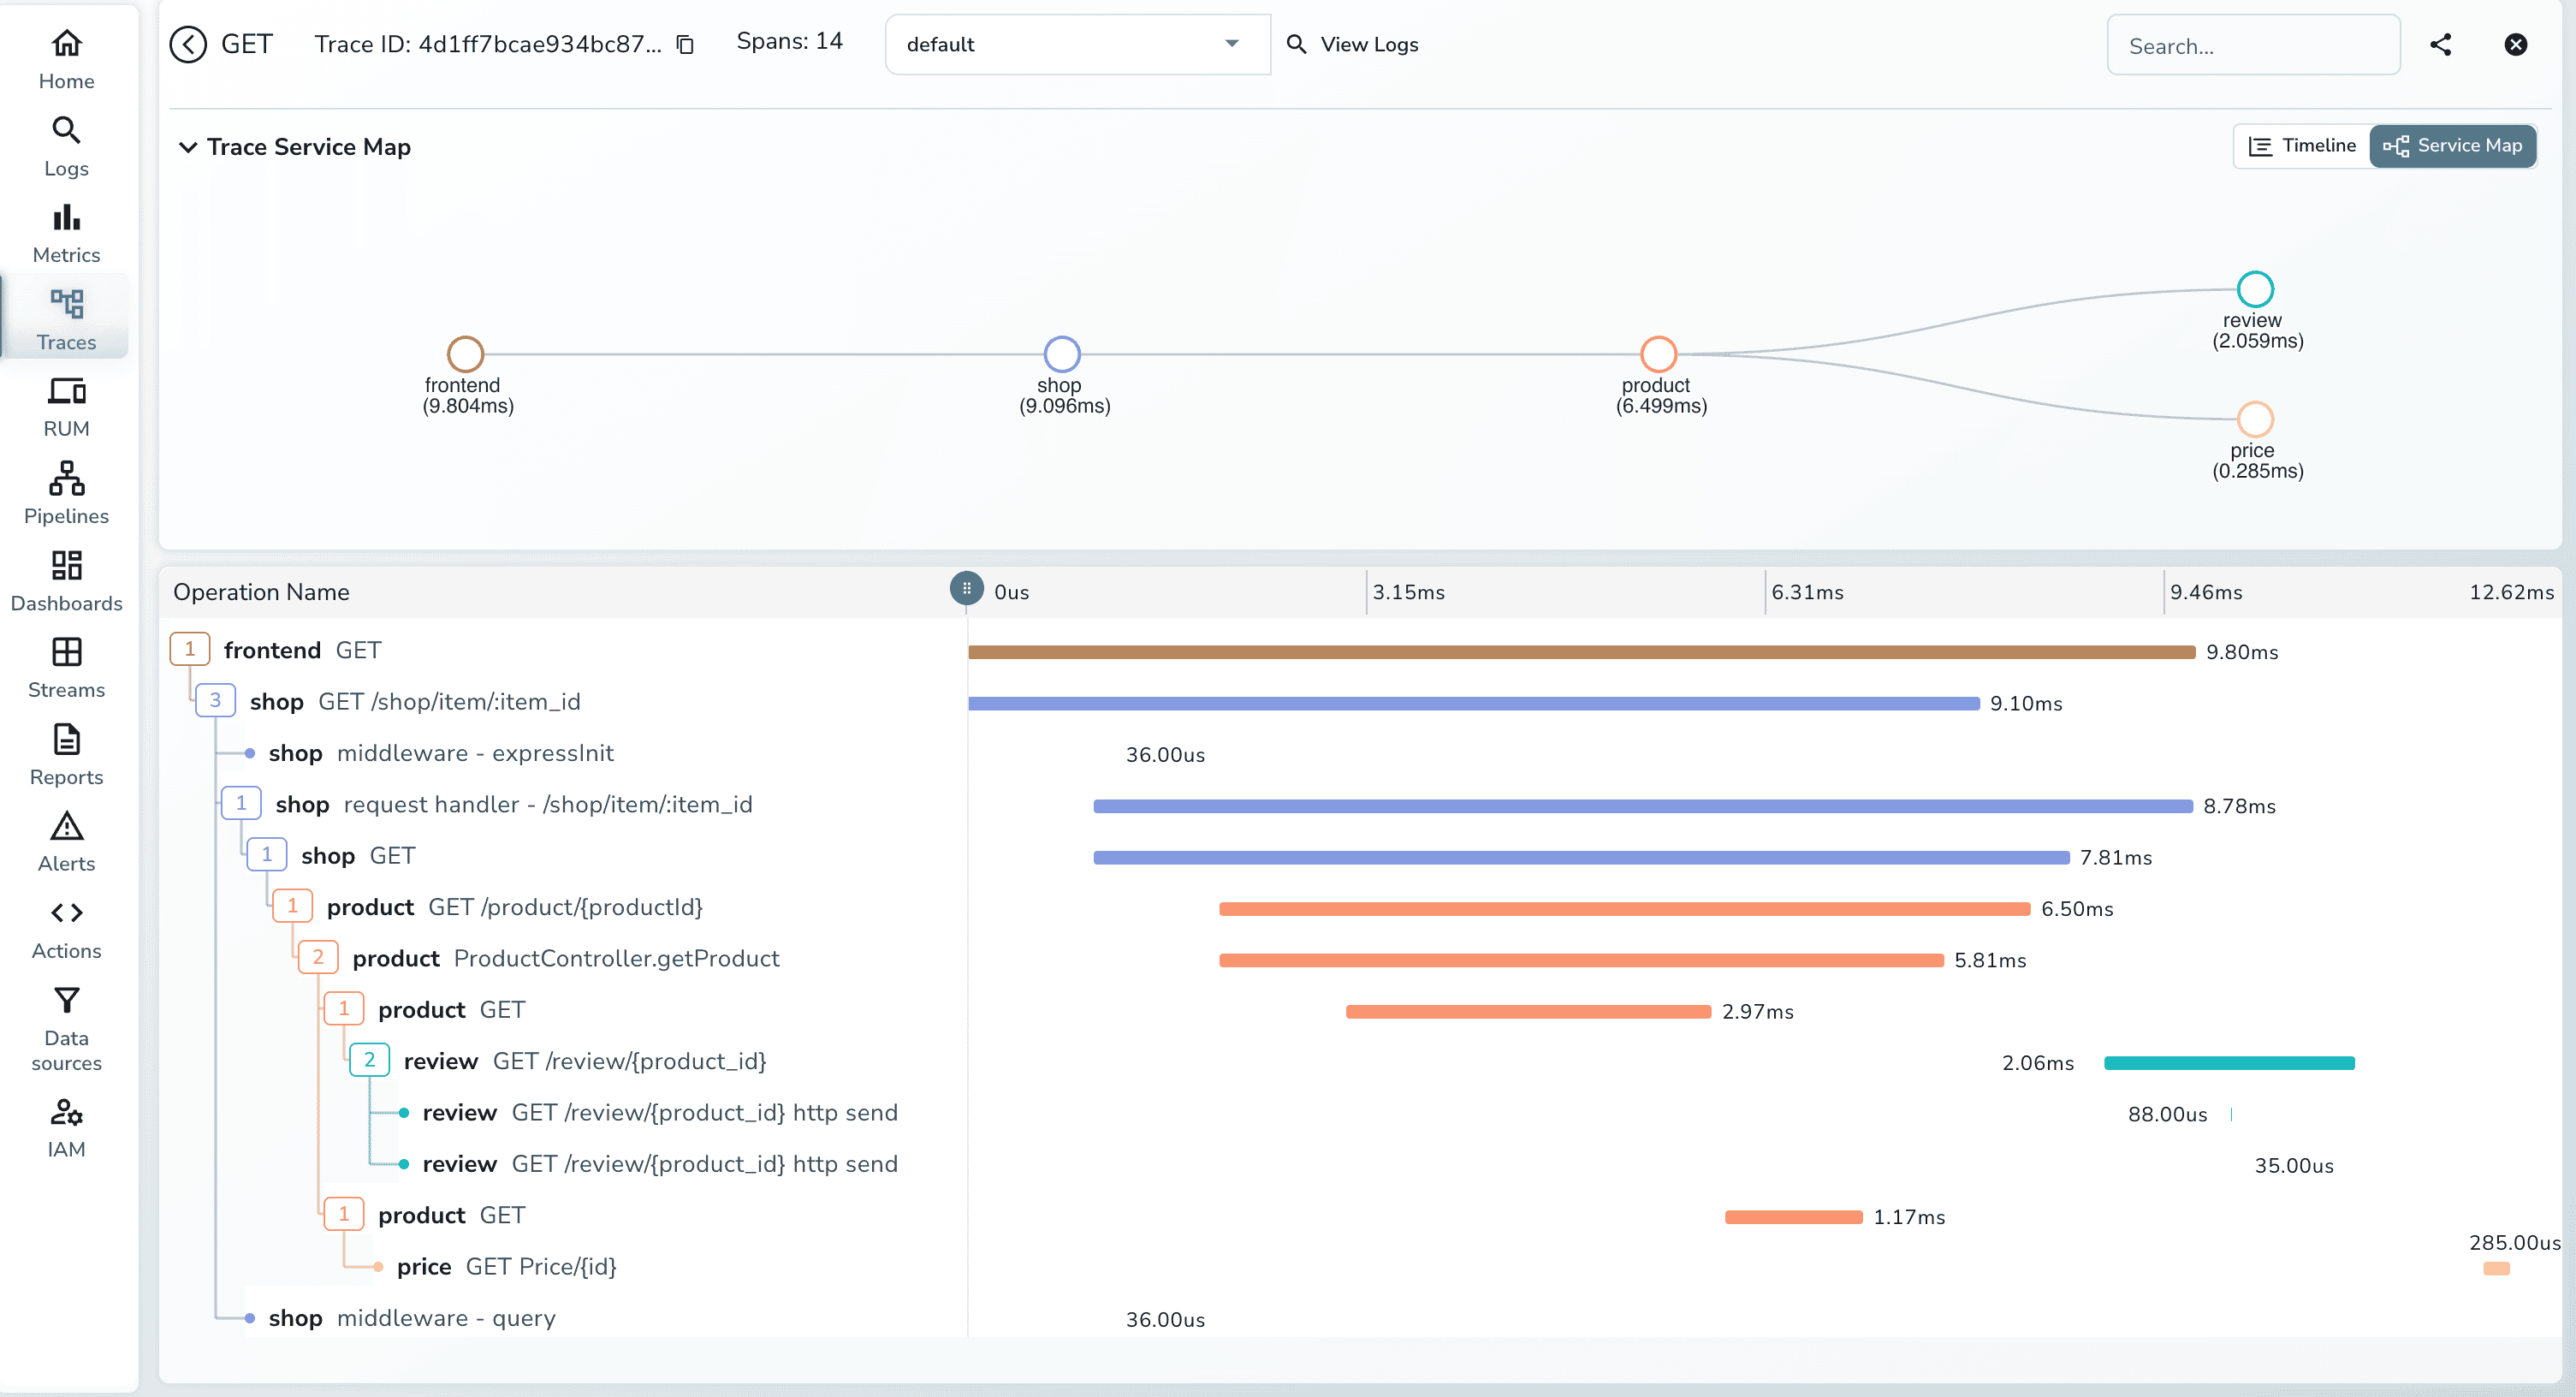
The trace visualization clearly shows which services depend on others, helping you understand:
- Service coupling and dependencies
- Parallel vs. sequential operations
- Critical paths in request processing
### Error Tracking
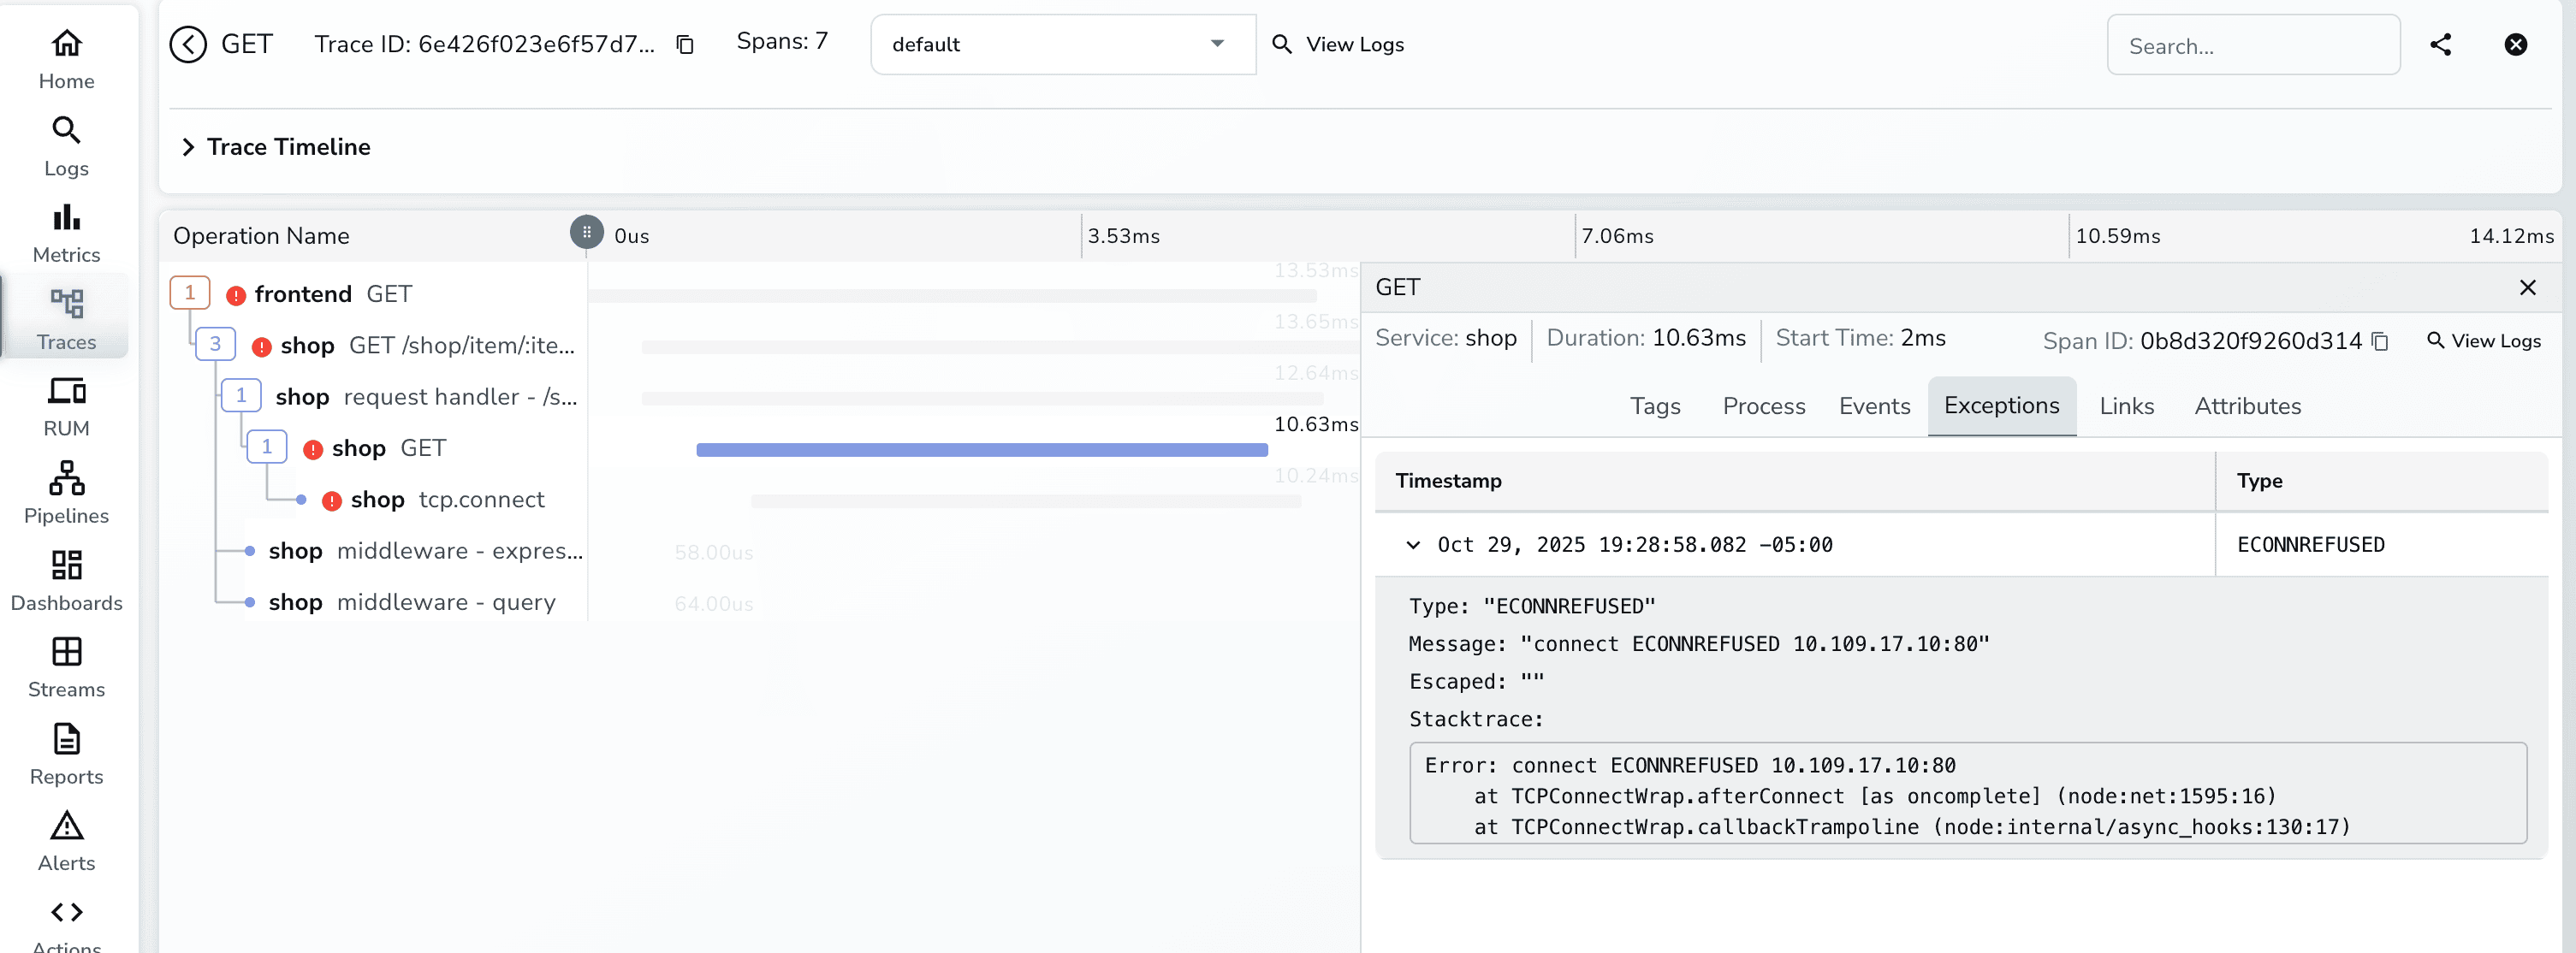
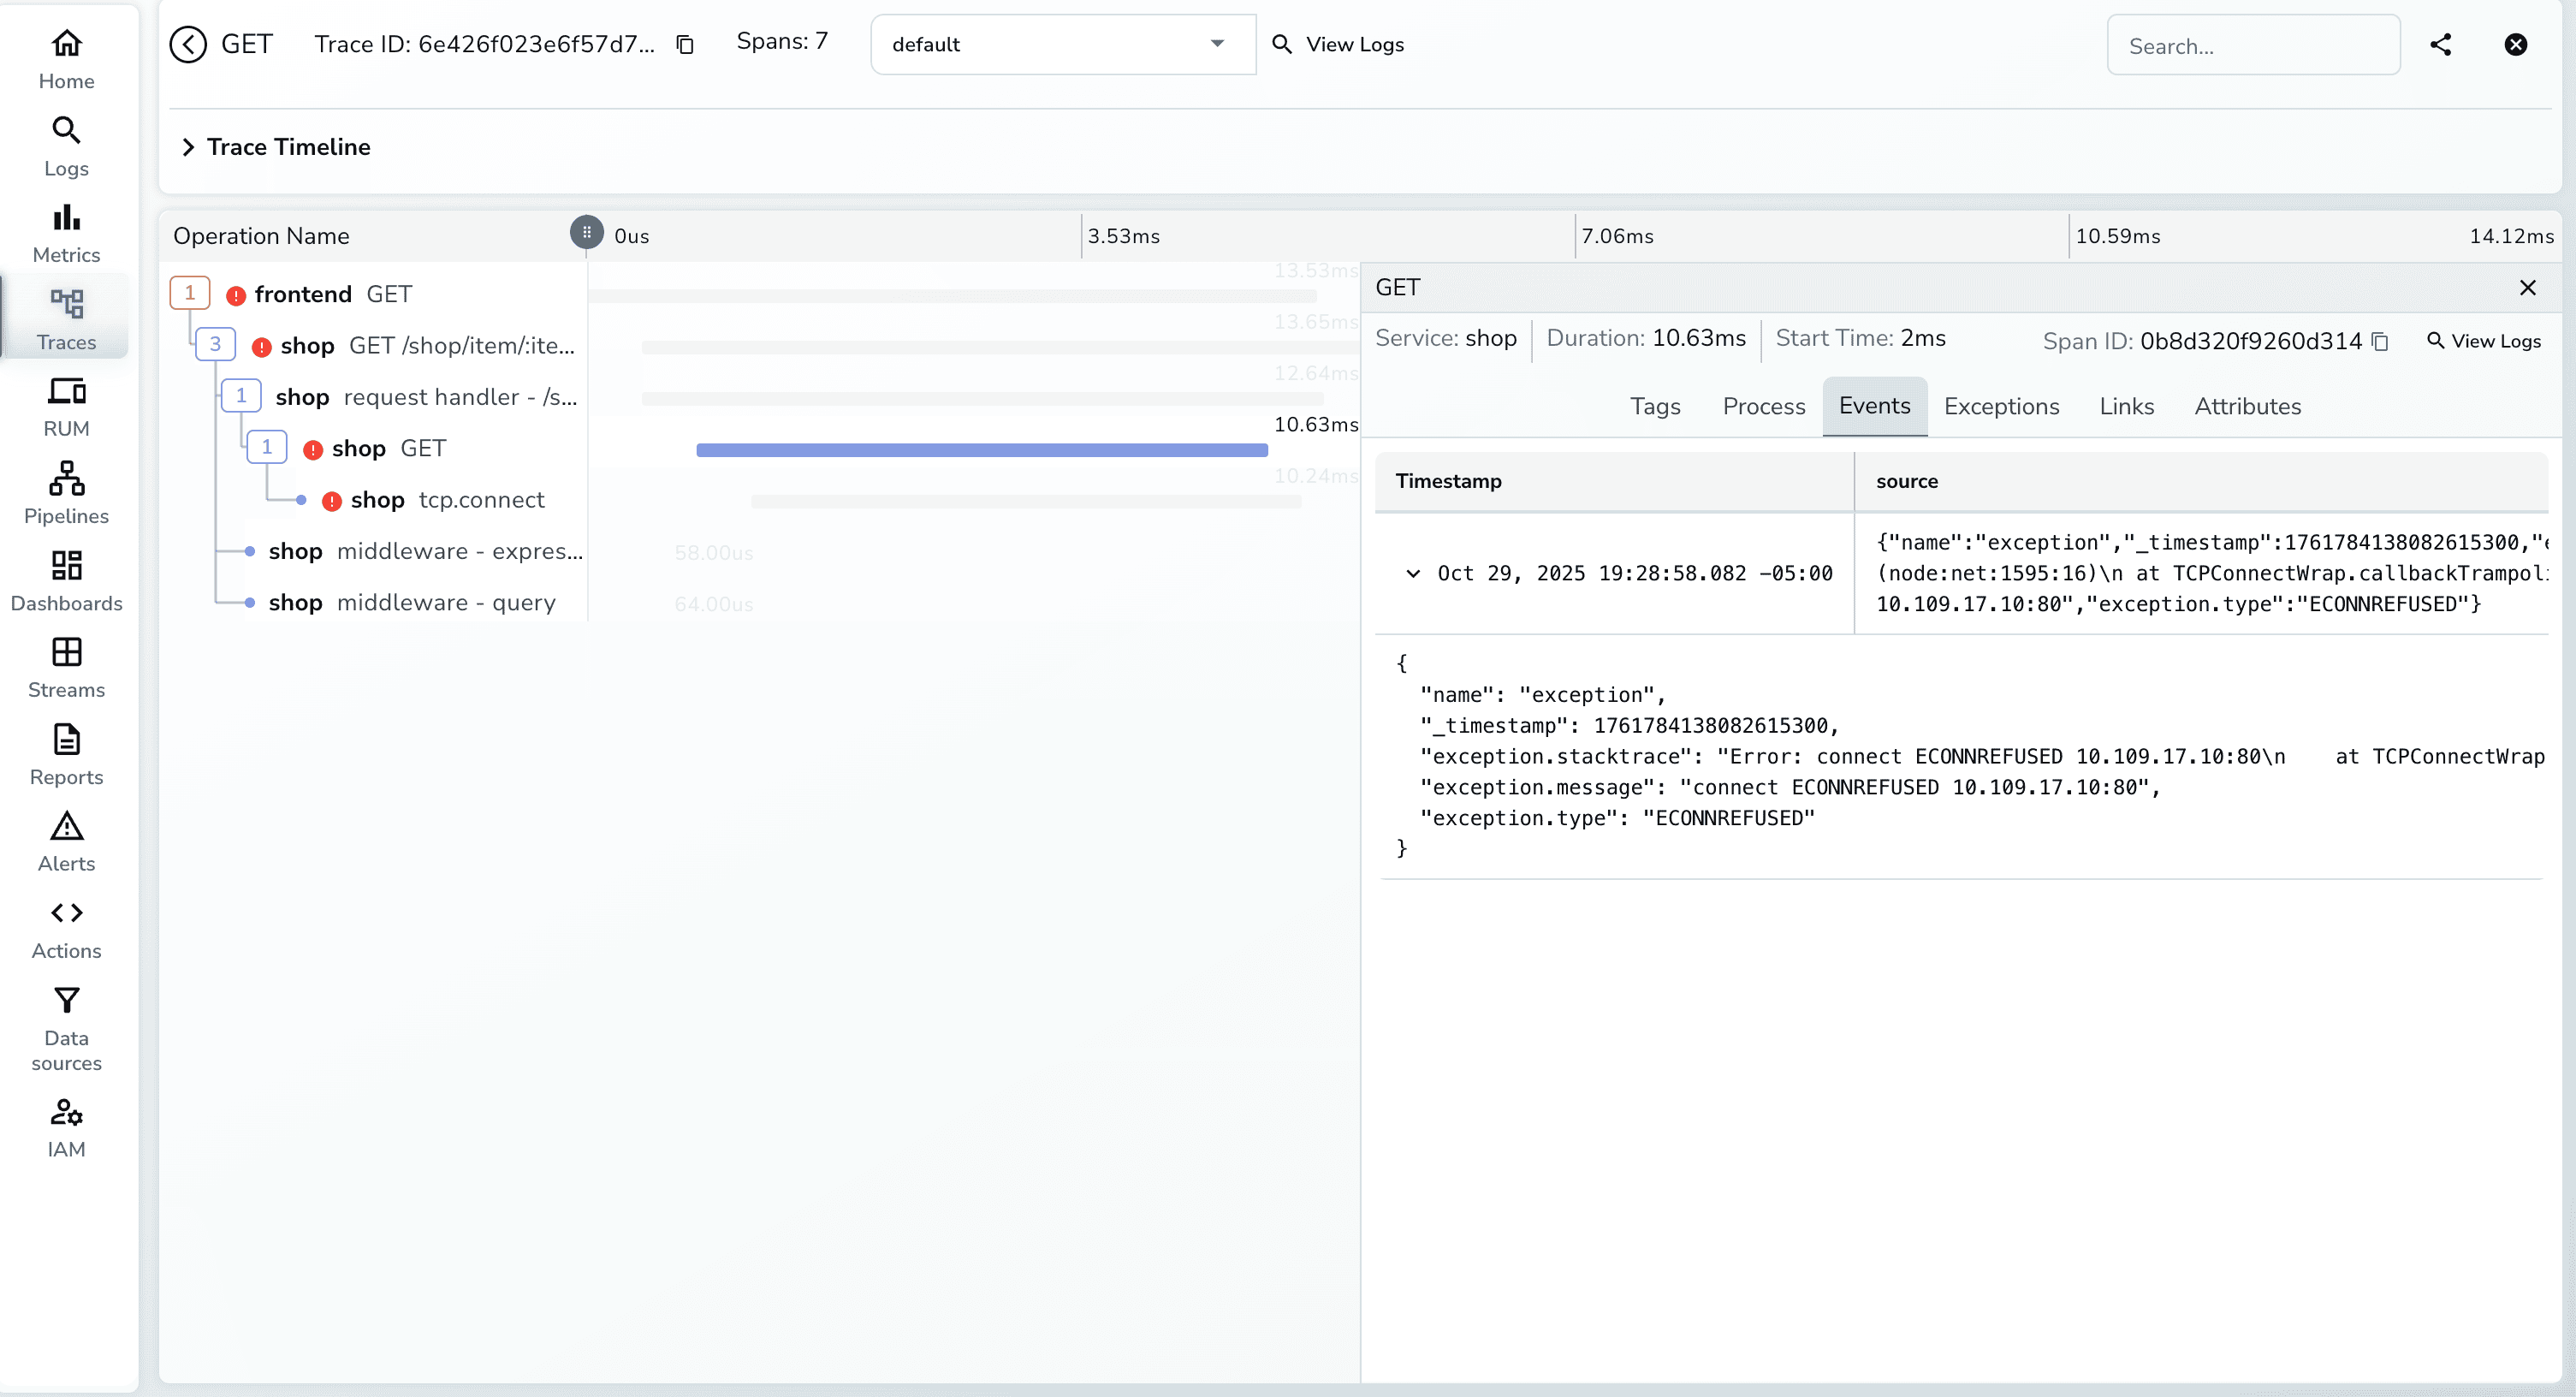
When errors occur, traces show exactly where they happened and how they propagated through the system.
## Real-World Applications: With vs. Without Auto-Instrumentation
| Scenario | Without Auto-Instrumentation | With Auto-Instrumentation |
| ------------------------------- | ----------------------------------------------------------------------------------------------------------------------------------------------------------------------------------------- | ---------------------------------------------------------------------------------------------------------------------------------------------------------------------------------------------- |
| **Migration Path** | • Refactor existing code to add tracing
• Risk breaking production services
• Weeks/months of development time
• Each service needs custom implementation | • Add a single annotation to deployment
• Zero code changes required
• Deploy and start collecting traces immediately
• Gradual rollout without risk |
| **Multi-Language Environments** | • Maintain separate SDKs for each language
• Different trace formats and standards
• Inconsistent data across services
• Team training for each language stack | • Consistent instrumentation across all languages
• Same annotation pattern for Go, Java, Python, .NET, Node.js
• Unified trace format (OTLP)
• No language-specific expertise needed |
| **Rapid Prototyping** | • Developers split focus between business logic and observability
• Instrumentation becomes technical debt
• Miss early performance issues
• Observability added as afterthought | • Focus purely on business logic
• Observability from day one
• Catch performance issues during development
• Production-ready traces immediately |
| **Cost Optimization** | • Blind spots in service performance
• Over-provision resources "just in case"
• Can't identify slow dependencies
• Guesswork for scaling decisions | • Pinpoint exact bottlenecks with traces
• Right-size resources based on data
• See which services need optimization
• Make informed scaling decisions |
| **Debugging Production Issues** | • Correlate logs manually across services
• Hours of investigation for root cause
• Reproduce issues in staging to understand flow
• "It works on my machine" syndrome | • See complete request path in one trace
• Identify failing service in seconds
• Understand exact failure point
• MTTR reduced by 70-80% |
| **Team Onboarding** | • New devs must learn observability SDKs
• Different patterns per service/language
• High cognitive load
• Mistakes lead to gaps in visibility | • New devs deploy with annotations
• Same pattern everywhere
• Can't forget instrumentation
• Complete visibility guaranteed |
## Troubleshooting Common Issues
When working with HotCommerce, you might encounter these scenarios:
### Traces Not Appearing
- Verify OpenObserve-collector and Operator are running
- Ensure pods have restarted after applying instrumentation
- Validate network policies allow communication to the collector
- Enable go auto instrumentation by running the below command.
`kubectl set env deployment/opentelemetry-operator-controller-manager -n opentelemetry-operator-system ENABLE_GO_AUTO_INSTRUMENTATION=true`
## Why This Matters
HotCommerce demonstrates a critical capability for modern cloud-native applications: the ability to gain deep observability without sacrificing development velocity. In production environments, this translates to:
**Faster Debugging**: When issues arise, traces provide immediate insight into where things went wrong.
**Better Architecture Decisions**: Visualizing service dependencies helps identify over-coupling and opportunities for optimization.
**Improved User Experience**: Understanding request flows helps you optimize the critical paths that impact user satisfaction.
**Reduced MTTR**: Mean time to resolution drops dramatically when you can see the exact request path and timing information.
## Next Steps and Exploration
After getting HotCommerce running, consider these experiments:
**Load Testing**: Use tools like Locust or K6 to generate realistic traffic patterns and observe how traces help identify bottlenecks.
**Failure Injection**: Introduce artificial delays or errors in services to see how failures propagate and appear in traces.
**Custom Metrics**: Extend the demo to include custom business metrics alongside traces.
**Service Mesh Integration**: Combine auto-instrumentation with a service mesh like Istio for additional observability layers.
**Multi-Cluster Scenarios**: Deploy services across multiple clusters and observe trace propagation across cluster boundaries.
## Conclusion
Observability doesn't require extensive code changes or architectural overhauls. With OpenTelemetry's auto-instrumentation and OpenObserve's powerful trace visualization, you can gain deep insights into your microservices architecture with minimal effort.
Whether you're building new services or adding observability to existing systems, the patterns demonstrated in HotCommerce provide a practical blueprint for success. The future of observability is automatic, language-agnostic, and developer-friendly-and HotCommerce shows us exactly how it works.
Ready to dive in? Clone the repository, spin up the services, and start exploring the fascinating world of distributed tracing.
**Resources:**
Learn more about [Openobserve and OpenTelemetry](https://openobserve.ai/opentelemetry/) and explore our other OTel blogs, including:
- [Simplifying Kubernetes Monitoring with OpenTelemetry and OpenObserve](https://openobserve.ai/blog/monitoring-kubernetes-with-opentelemetry/)
- [Implementing OpenTelemetry Logging in .NET Applications](https://openobserve.ai/blog/opentelemetry-logging-in-dotnet-applications/)
- [Distributed Tracing in Node.js Applications with OpenTelemetry](https://openobserve.ai/blog/distributed-tracing-in-nodejs-with-opentelemetry/)
> #### Get Started with OpenObserve Today!
>
> Sign up for a [14 day trial](https://cloud.openobserve.ai)
> Check out our GitHub repository for self-hosting and contribution opportunities