# How to Monitor AWS API Gateway Access Logs via Kinesis Data Firehose and Openobserve
> Discover the importance of log monitoring for API performance, step-by-step instructions on setting up a Lambda function, creating a REST API, and configuring Kinesis Firehose for seamless log streaming.
Source: https://openobserve.ai/blog/how-to-monitor-api-access-logs/
Published: 2025-08-12
Authors: Manas Sharma
Category: How To
Tags: AWS, Logging
---
## Introduction
Monitoring AWS API Gateway access logs is super important for keeping an eye on how your APIs are performing, spotting issues, and making sure you're using resources efficiently. By connecting AWS API Gateway directly to Amazon Kinesis Data Firehose, you can easily stream your access logs straight to OpenObserve. This setup not only makes it simple to analyze your logs but also helps you uncover trends and detect any anomalies, so you can make informed decisions to boost your API’s reliability and performance.
### What Is Amazon Kinesis Data Firehose?
Amazon Kinesis Data Firehose is a fantastic, fully managed service that lets you load real-time data streams into AWS storage services like Amazon S3, Amazon Redshift, or Amazon Elasticsearch. With Firehose, capturing and streaming your log data is a breeze-no complicated setup required! This means you can focus on monitoring and improving your APIs without getting bogged down in the technical details.
So, let’s dive in and get started!
## Prerequisites
Before we start, ensure you have the following:
- An AWS account
- Basic understanding of AWS services (API Gateway, Lambda, Kinesis Firehose, CloudWatch)
- OpenObserve set up and running
## Step 1: Create a Lambda Function
We will be creating a sample lambda function that will accept HTTP request events from API gateway and process them.
### Navigate to the AWS Lambda Console
1. Go to the AWS Lambda console.
### Create a New Function
1. Click on **Create function**.
2. Choose **Author from scratch**.
3. Function name: `ApiLogFunction`
4. Runtime: `Python 3.x` (or your preferred language).
5. Click **Create function**.
### Add Code to the Lambda Function
In the Lambda function's code editor, implement a demo function that will serve as the backend for our REST API
- 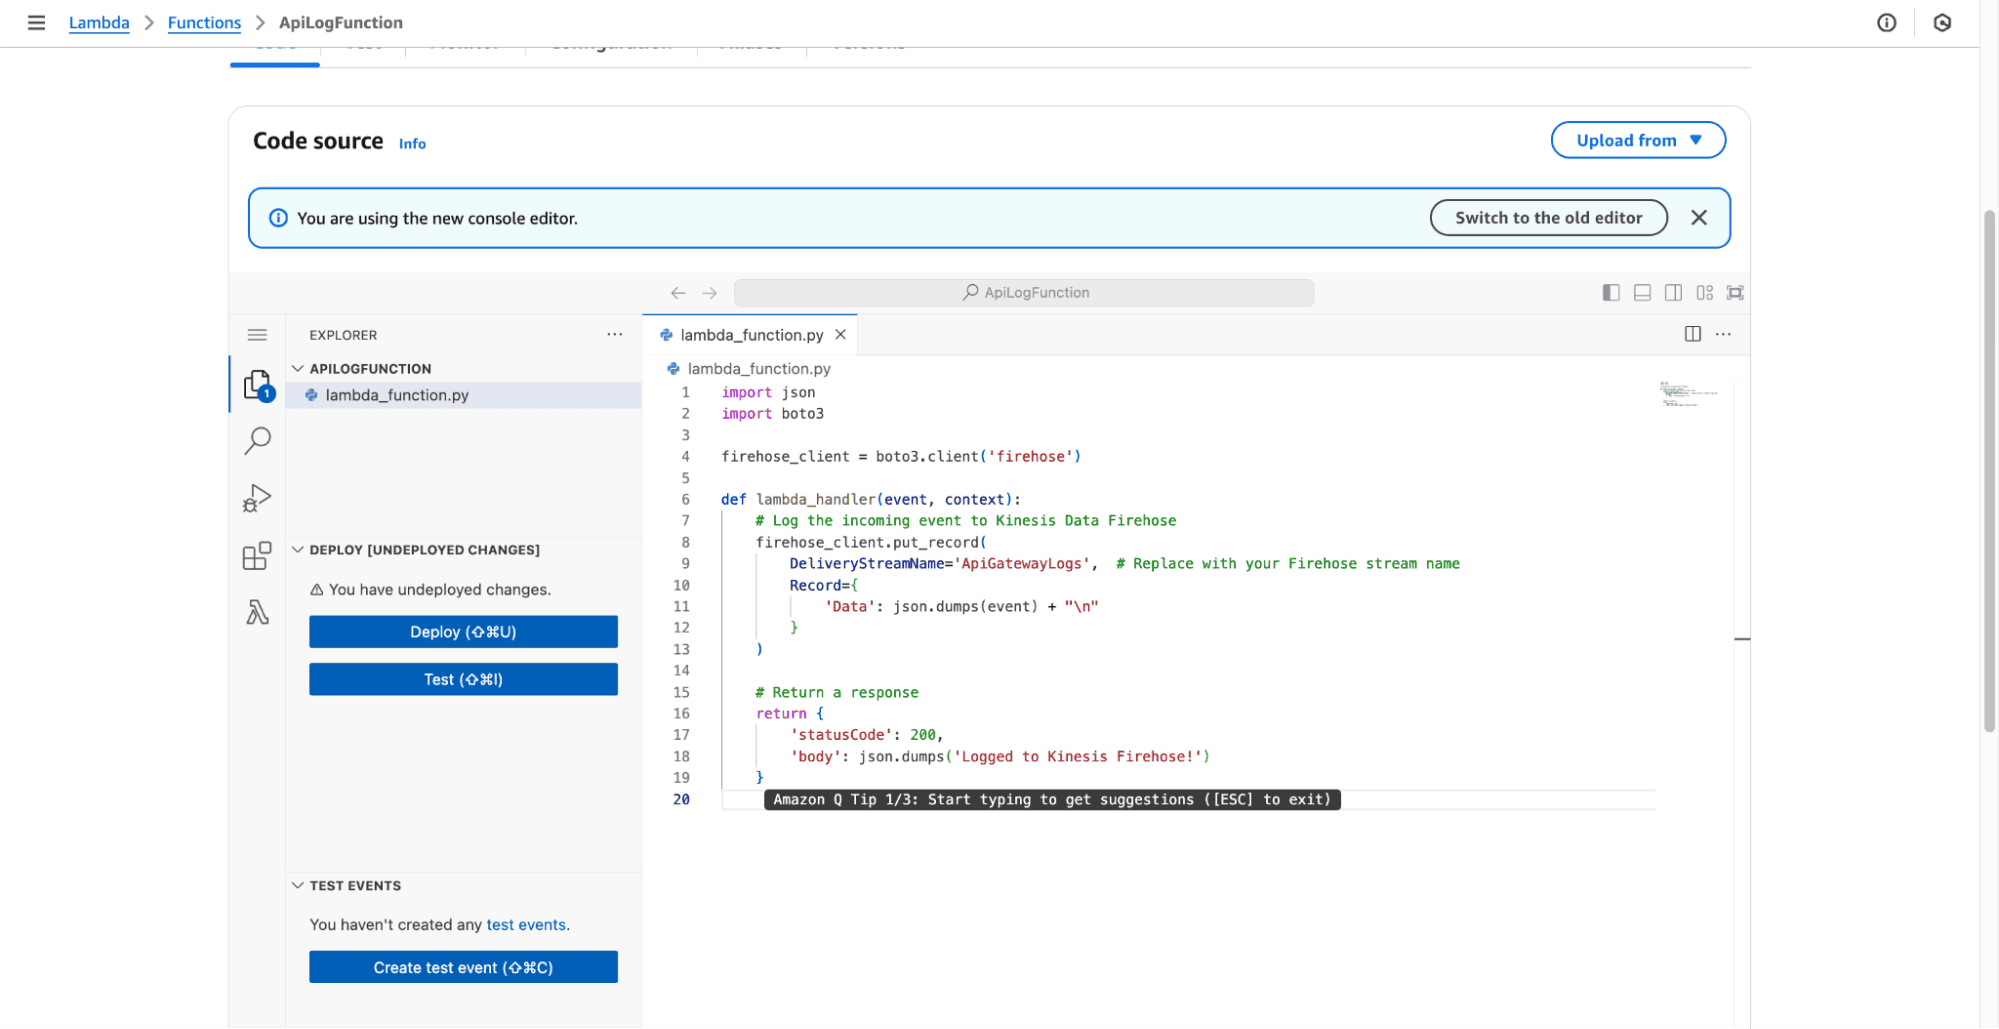
```python
import json
def lambda_handler(event, context):
return {
'statusCode': 200,
'body': json.dumps({'message': 'Logged to Kinesis Firehose!'})
}
```
#### Set Permissions
> Ensure the Lambda function has permissions to log to CloudWatch. Attach the `AWSLambdaBasicExecutionRole` policy.
## Step 2: Create a REST API in API Gateway
### Navigate to the API Gateway Console
1. Go to the API Gateway console.
### Create a New API
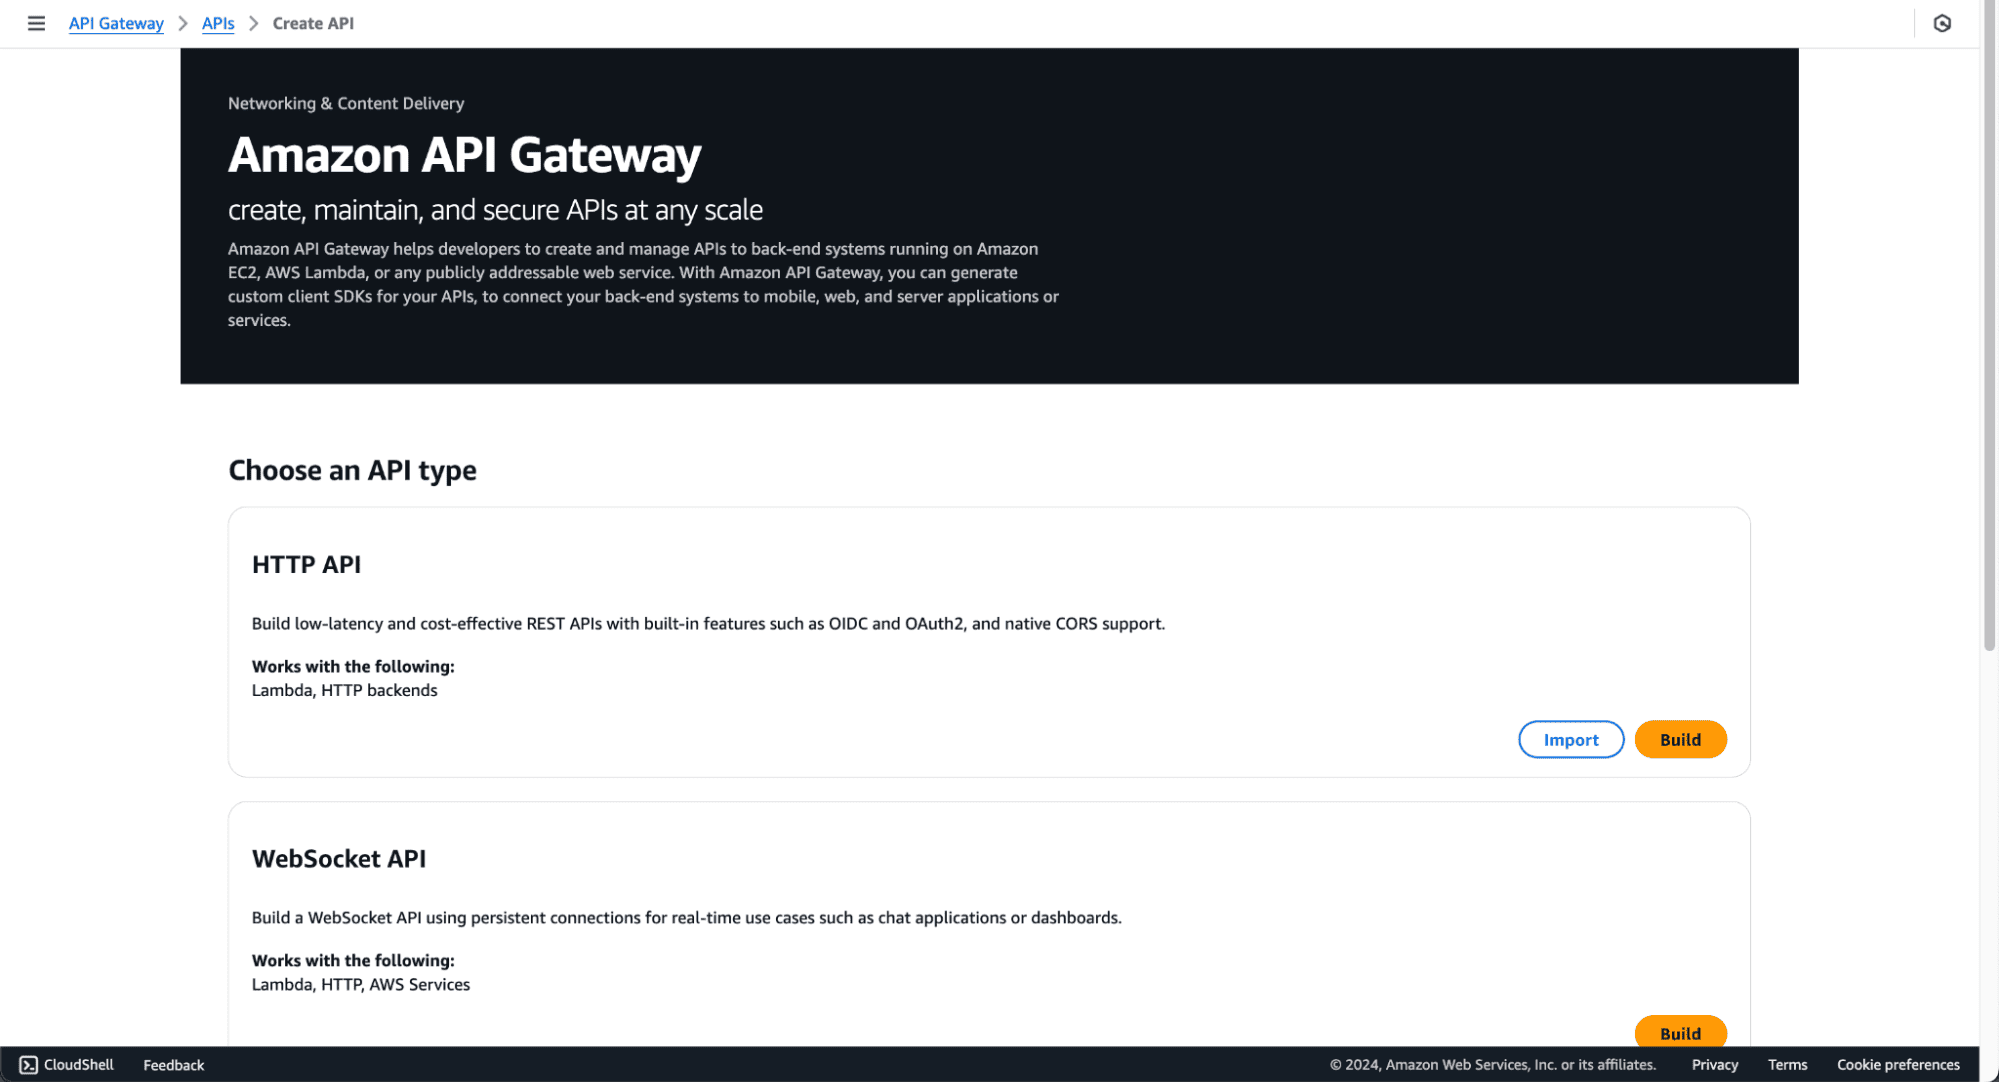
1. Click on **Create API**.
2. Choose **REST API** and click **Build**.
3. API name: `accesslogsdemoapi`.
4. Click **Create API**.
- 
### Create a Resource
1. Select your API and click on **Actions** > **Create Resource**.
2. Resource Name: `log`.
3. Click **Create Resource**.
### Create a Method
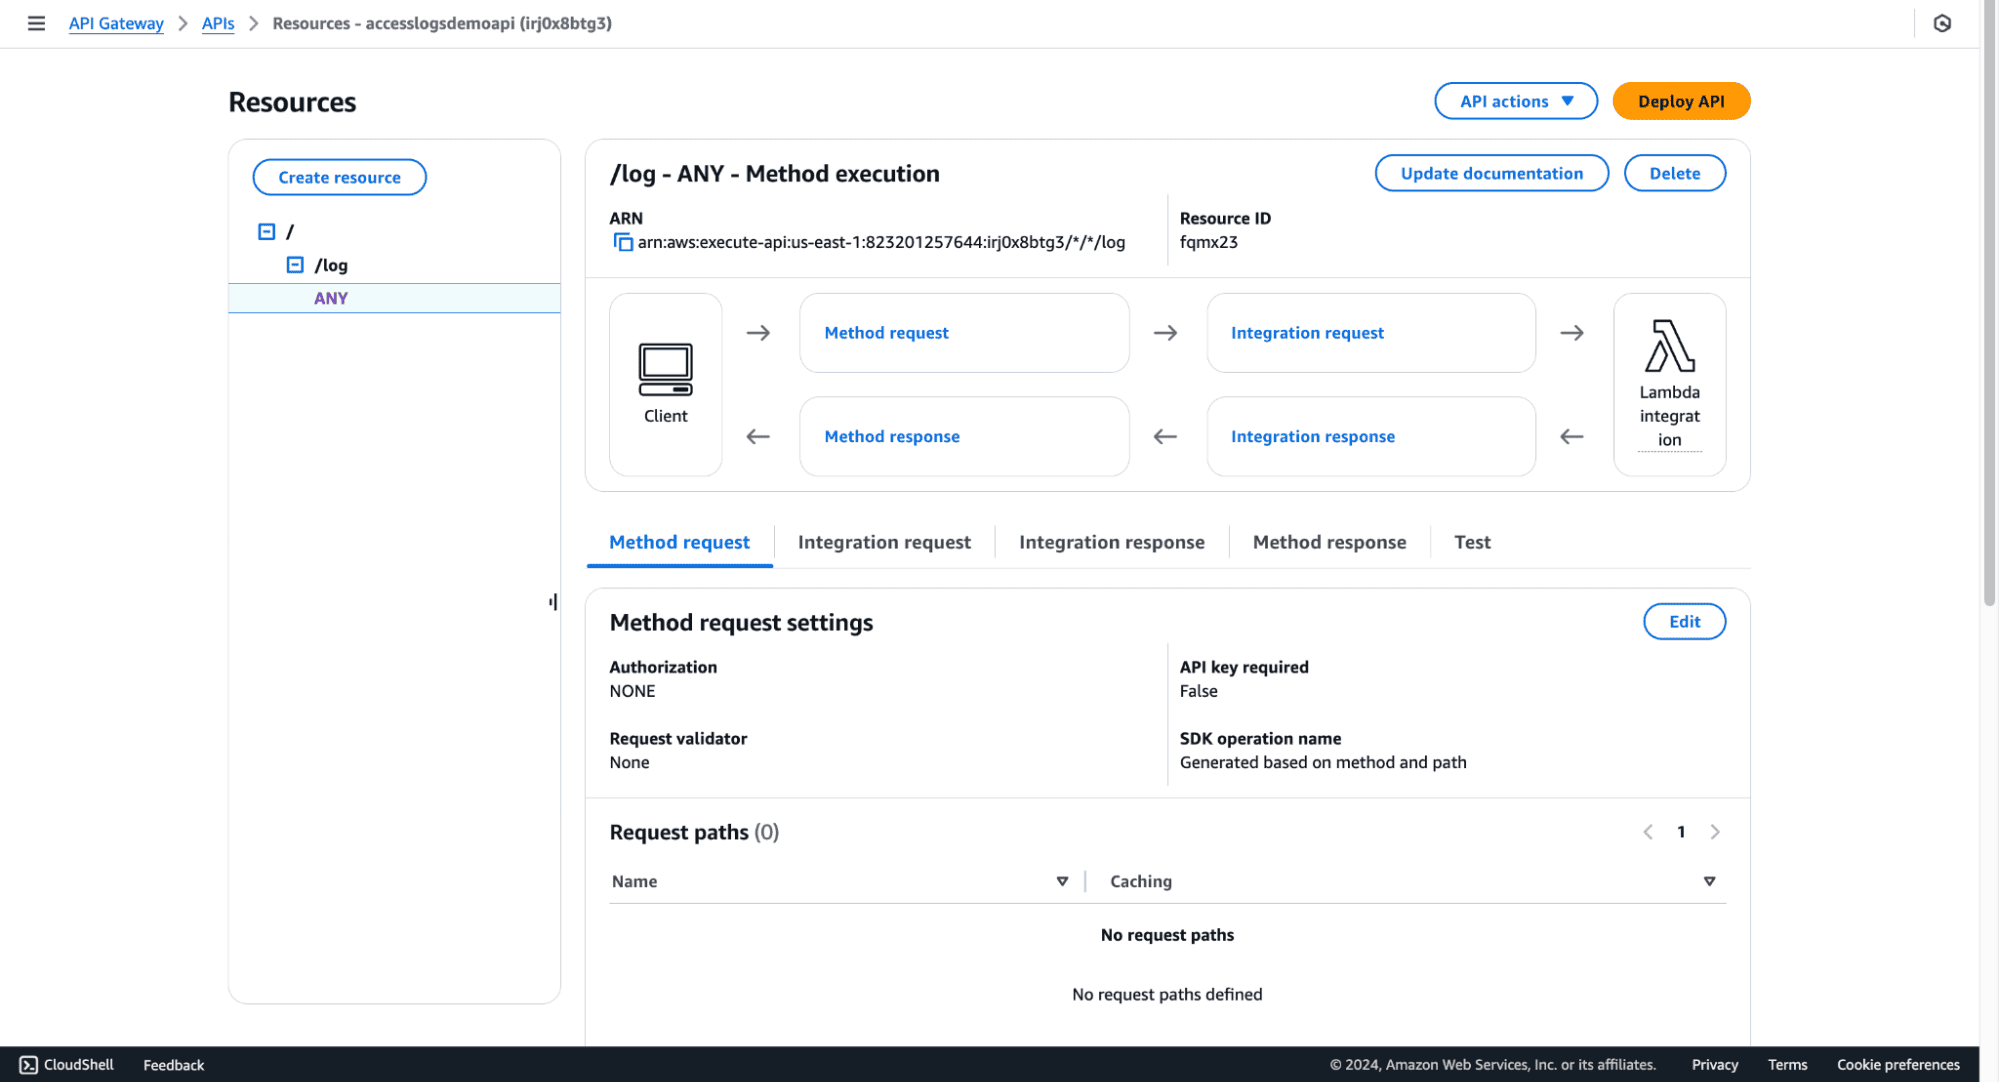
1. Select the `/log` resource.
2. Click on **Actions** > **Create Method**.
3. Choose `GET` and click the checkmark.
4. Integration type: **Lambda Function**.
5. Select your Lambda function (`ApiLogFunction`).
6. Click **Save** and **OK** to grant API Gateway permission to invoke your Lambda function.
- 
## Step 3: Create an Amazon Kinesis Data Firehose
### Navigate to Kinesis Console
1. In the AWS services menu, search for **Kinesis** and select it.
### Create a Delivery Stream
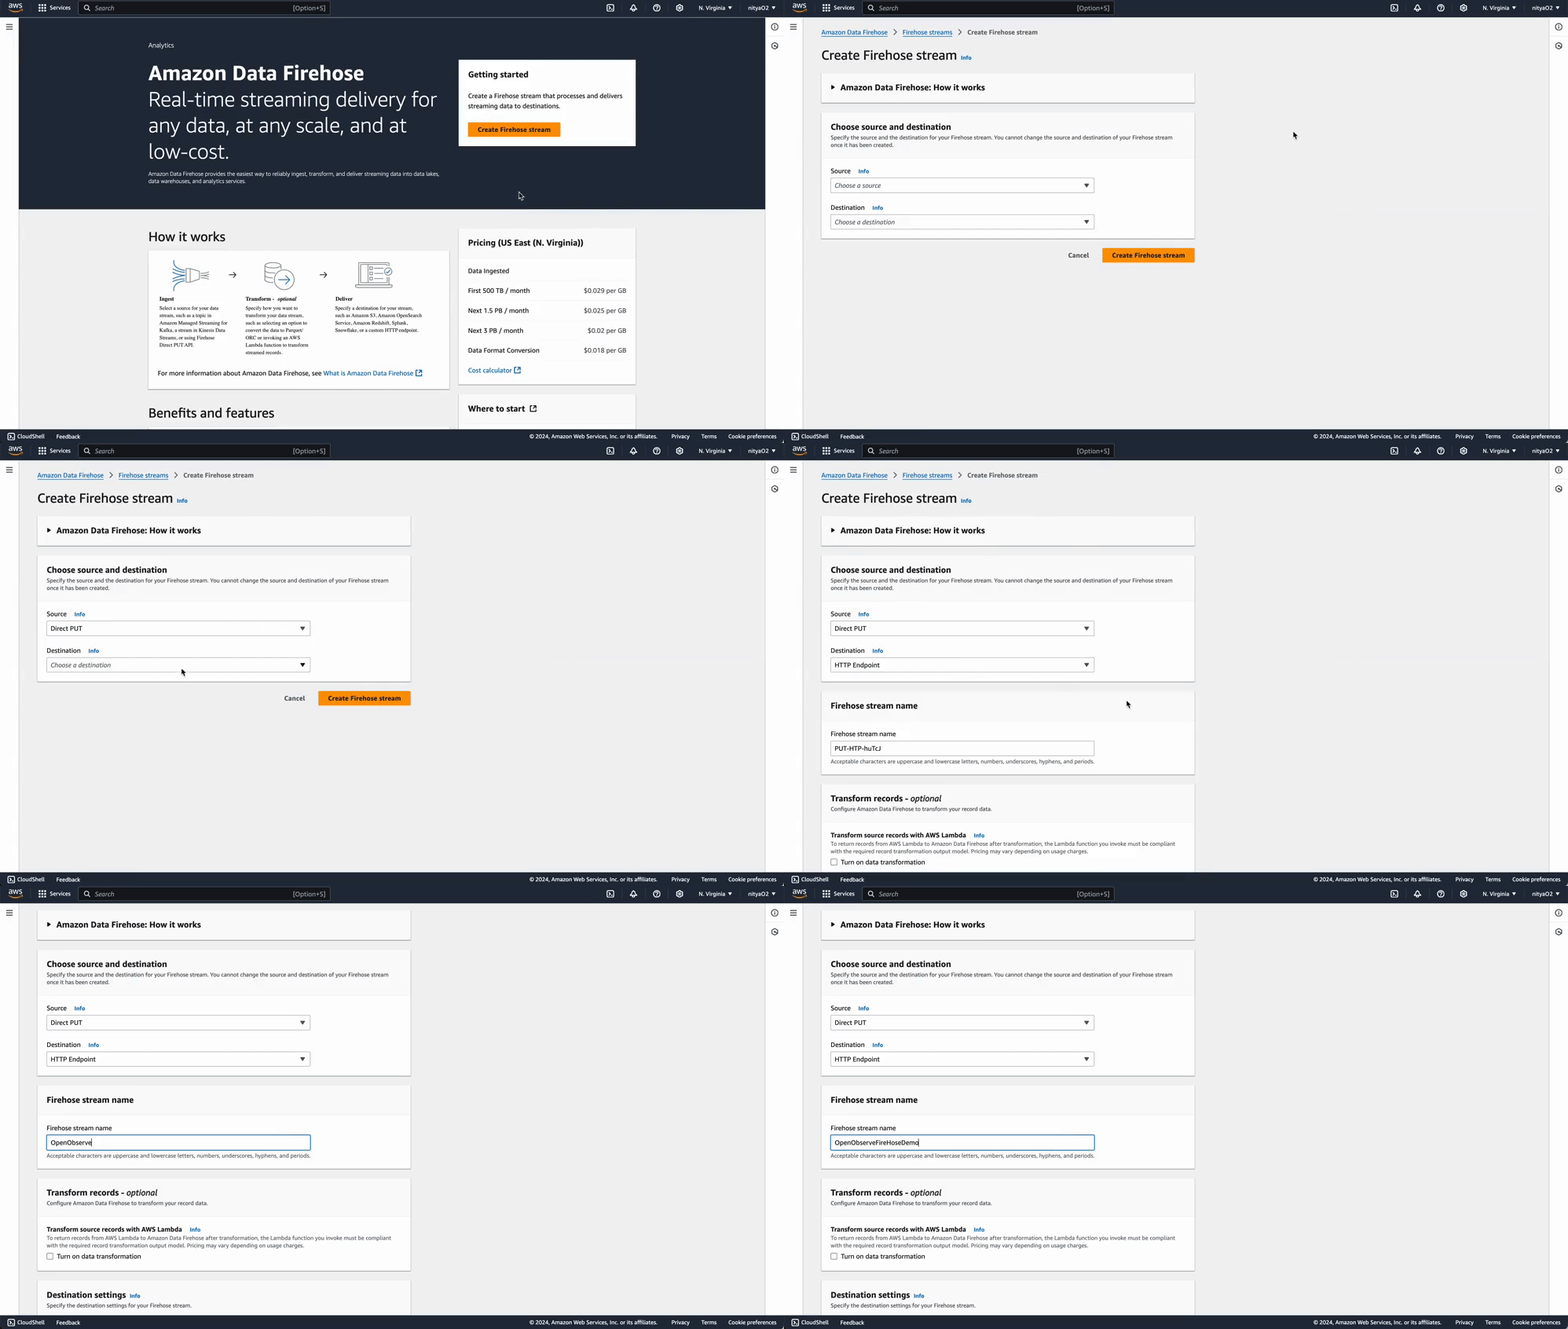
1. Click on **Create Firehose Stream**.
2. Choose **Direct PUT** as the source.
3. Click **Next**.
### Configure Destination
1. Select **HTTP Endpoint** as the destination.
- 
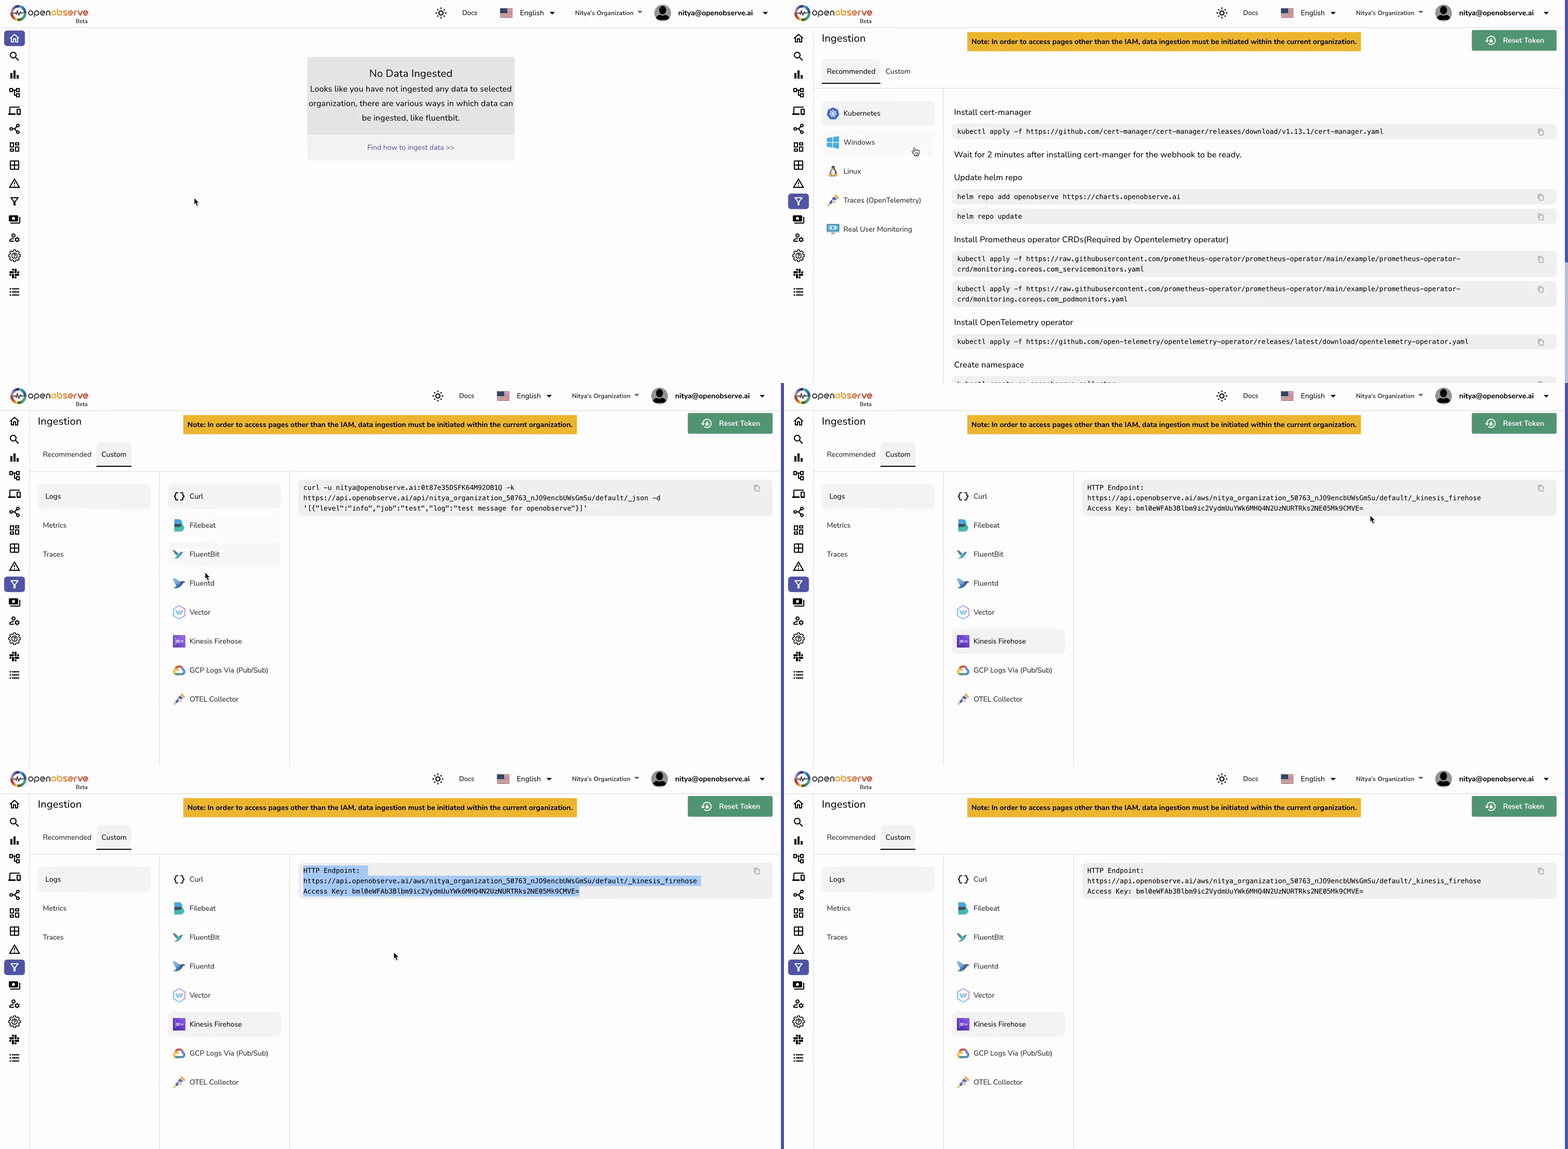
2. **Endpoint URL:** Enter your OpenObserve Kinesis Firehose endpoint (obtain this from **OpenObserve -> Ingestions -> Custom -> Amazon Kinesis Firehose**.
- 
3. **Authentication Type:** Choose **Use access key** and enter your OpenObserve access key.
4. Click **Next**.
### Configure Backup Settings
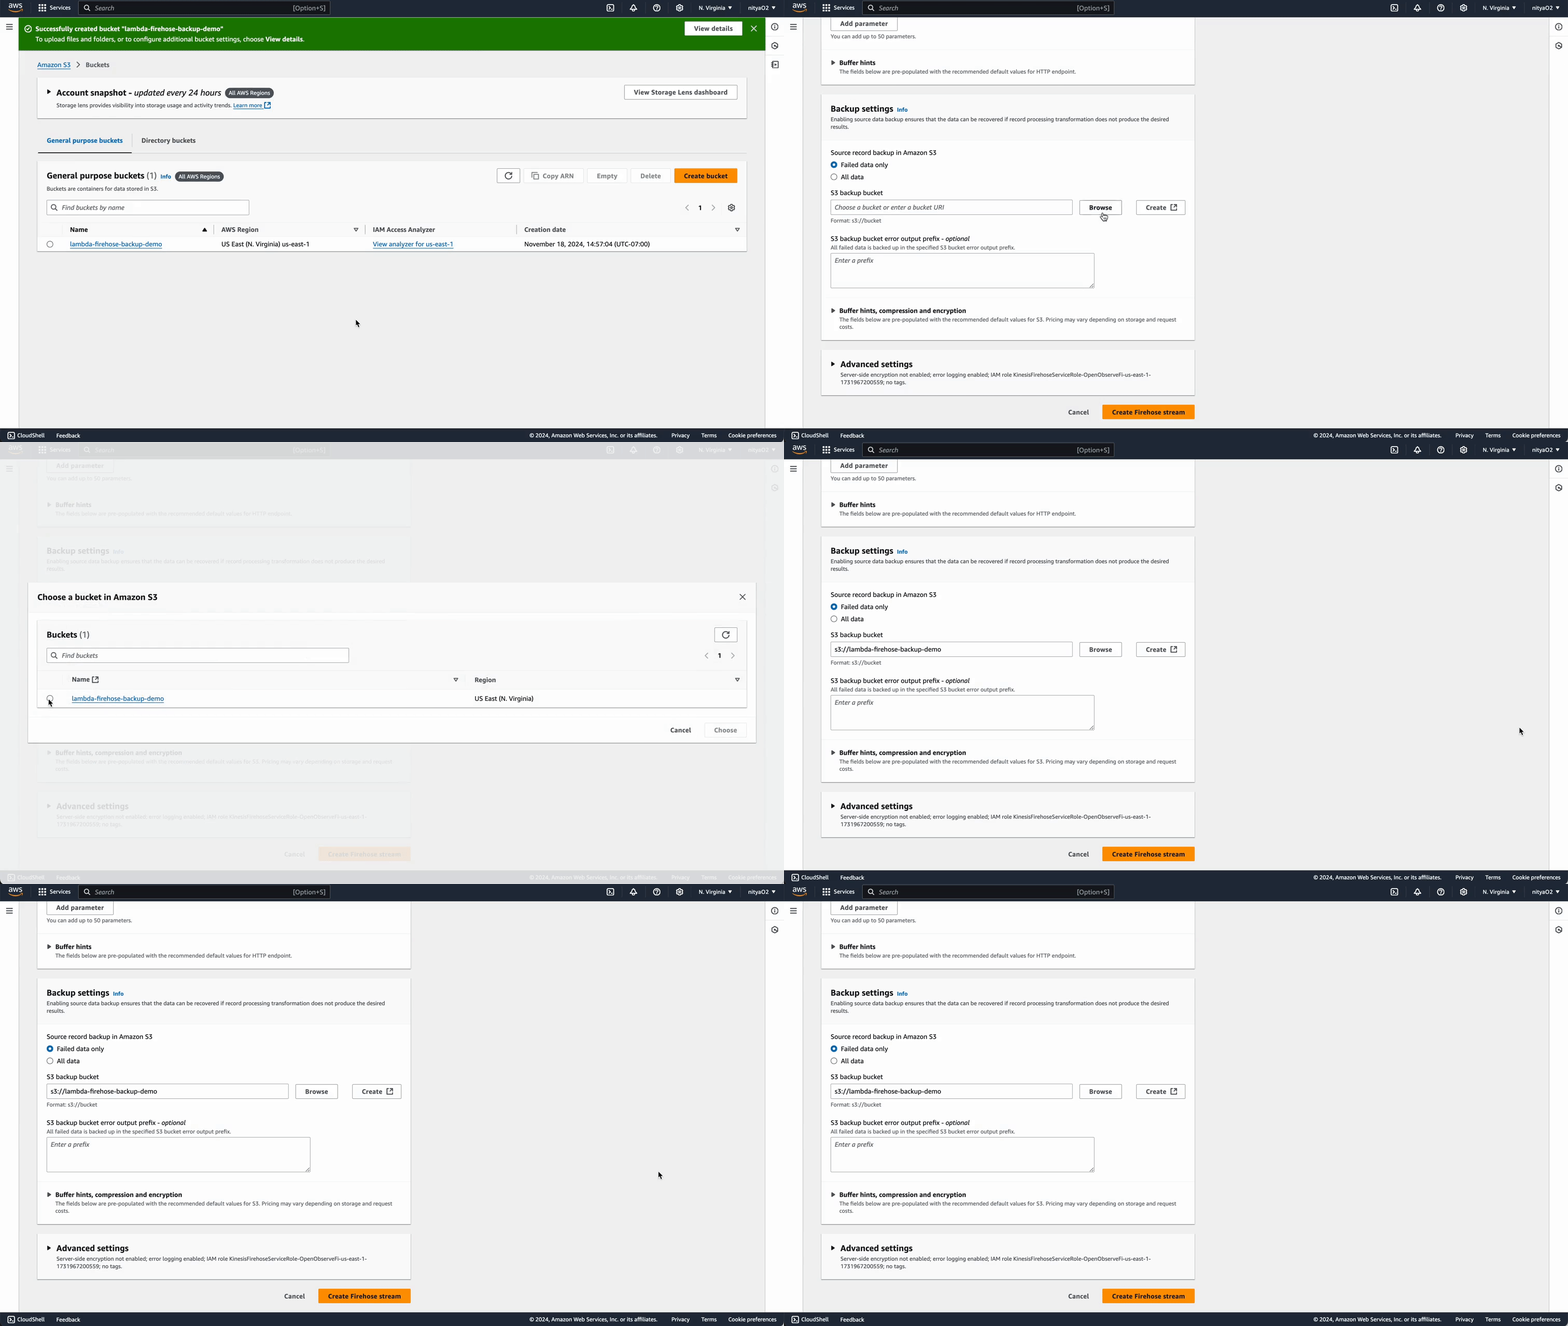
1. Choose whether to back up all data or only failed data. For this example, select **Failed data only**.
2. Choose an existing S3 bucket or create a new one for backups (e.g., `lambda-firehose-backup`).
3. Click **Next**.
- 
### Finalize Firehose Stream Setup
1. Click **Next**, configure buffer size and interval as needed (default values will suffice for this example), then click **Next** again.
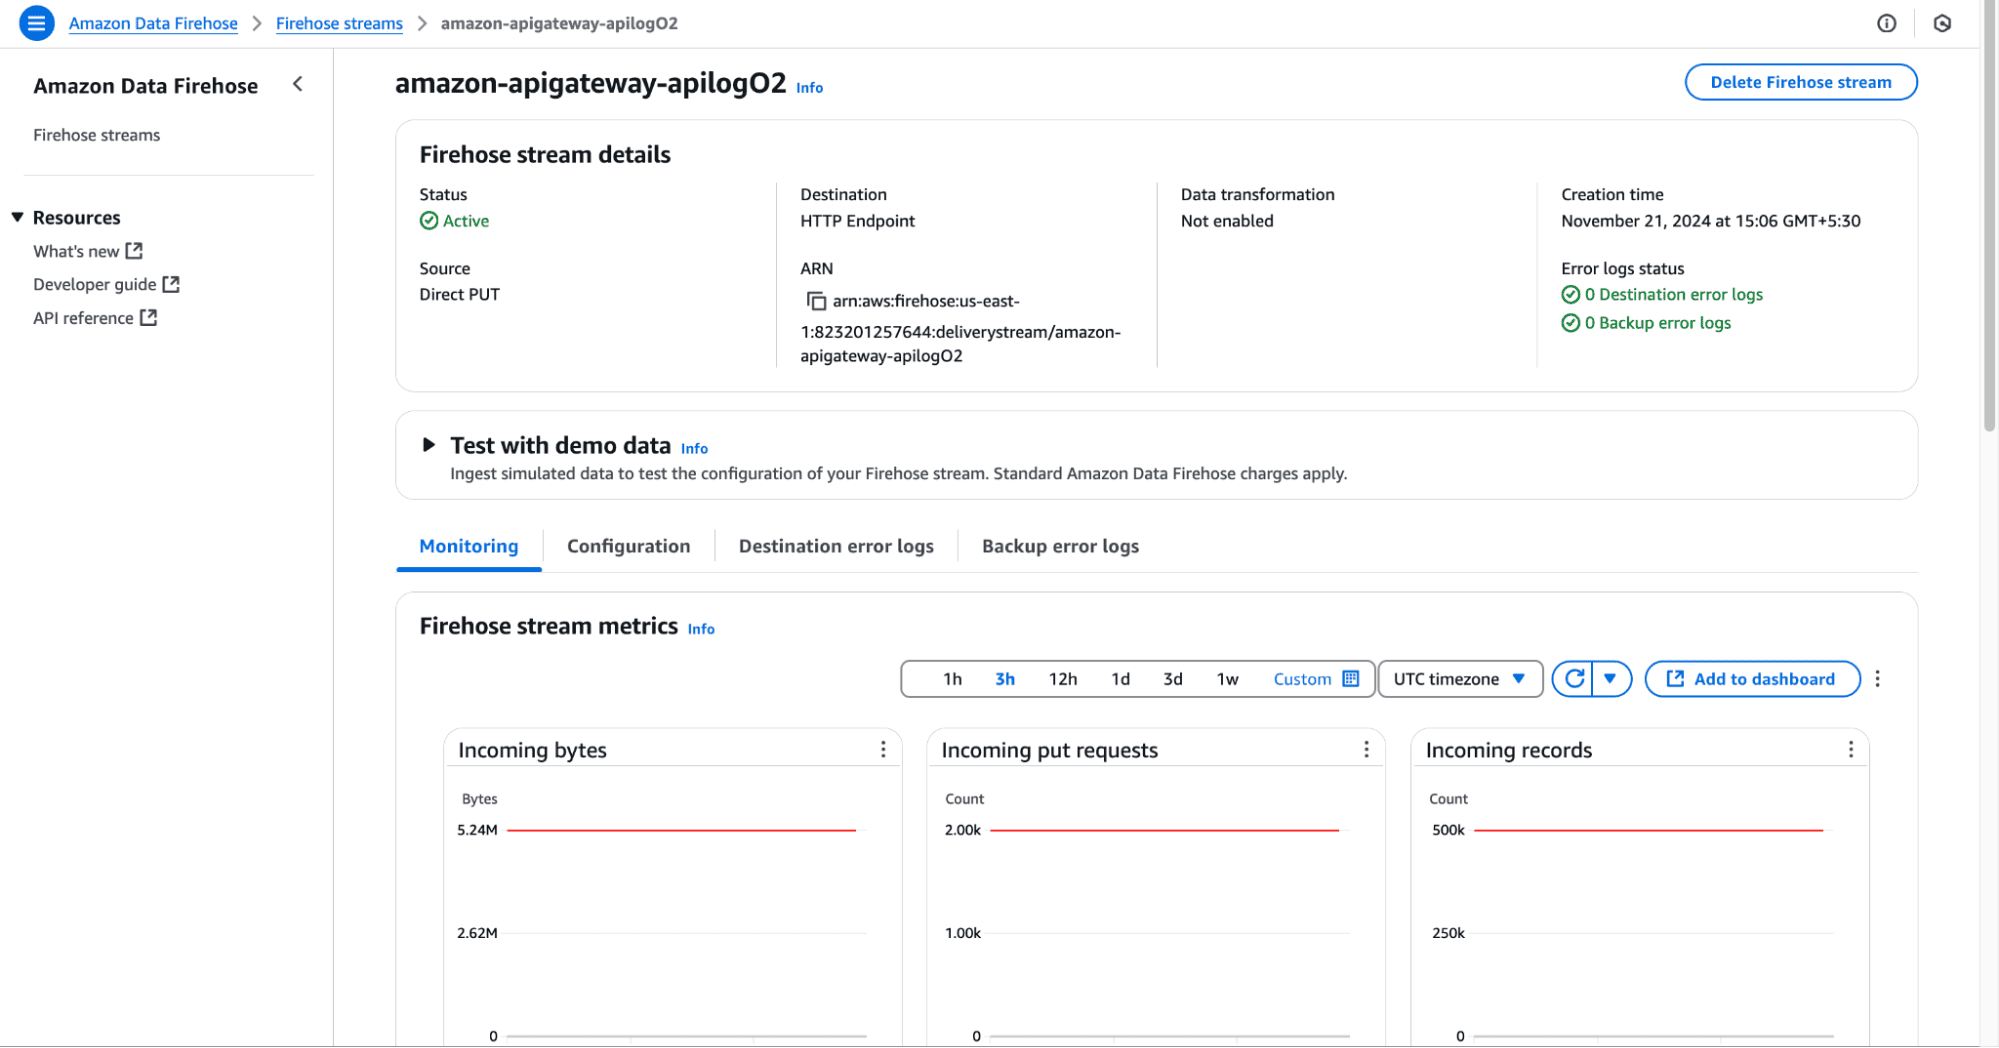
2. Review all settings and click on **Create Firehose stream**.
- 
## Step 4: Enable Custom Access Logs in API Gateway
### Create an IAM Role for CloudWatch Logs
1. Go to the IAM console.
2. Click on **Roles** > **Create role**.
3. Trusted entity: Select **API Gateway**.
4. Click **Next: Permissions** and attach the `AWSLambdaBasicExecutionRole` policy.
5. Click **Next: Tags**, then **Next: Review**.
6. Name the role: `APIGatewayCloudWatchLogsRole`.
7. Click **Create role**.
### Copy the Role ARN
1. Click on the created role and copy the **Role ARN**.
### Set the Role ARN in API Gateway
1. Go back to the API Gateway console.
2. Click on **Account Settings**.
3. Paste the Role ARN in the **CloudWatch Logs role ARN** field.
- 
4. Click **Save Changes**.
### Enable Access Logs
1. Select your API and navigate to the **Stages** section.
2. Select the **dev** stage.
3. In the **Logs/Tracing** tab, enable **Access Logs**.
4. Provide the ARN of your Kinesis Firehose stream.
- 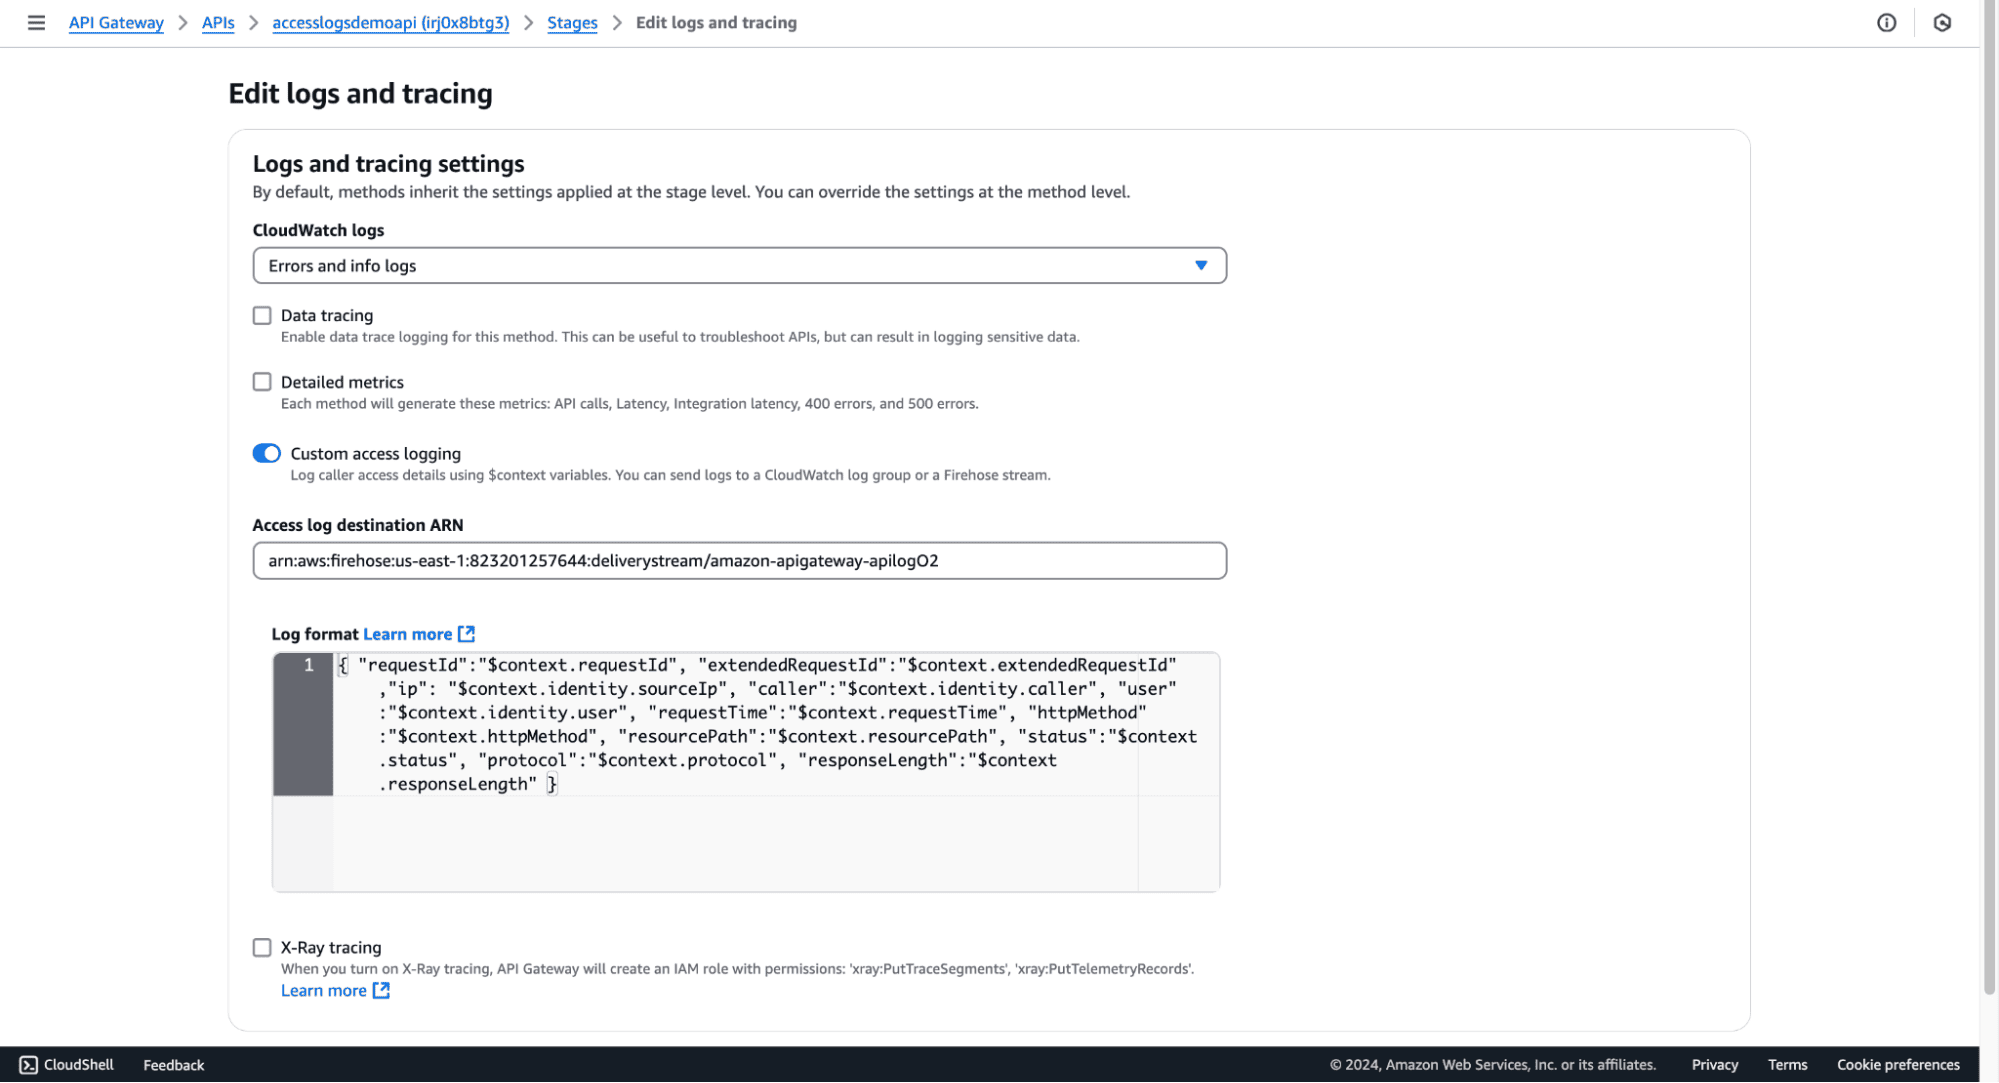
5. Specify the log format, e.g.:
```plaintext
RequestId: $context.requestId, SourceIP: $context.identity.sourceIp, Method: $context.httpMethod, ResourcePath: $context.resourcePath, StatusCode: $context.status, ResponseLength: $context.responseLength, RequestTime: $context.requestTim
```
6. **Save** your chnages.
## Step 5: View REST API Access Logs in OpenoObserve
> Ensure OpenObserve is set up and running. Refer to the [Quickstart documentation](https://openobserve.ai/docs/quickstart/) for installation and configuration.
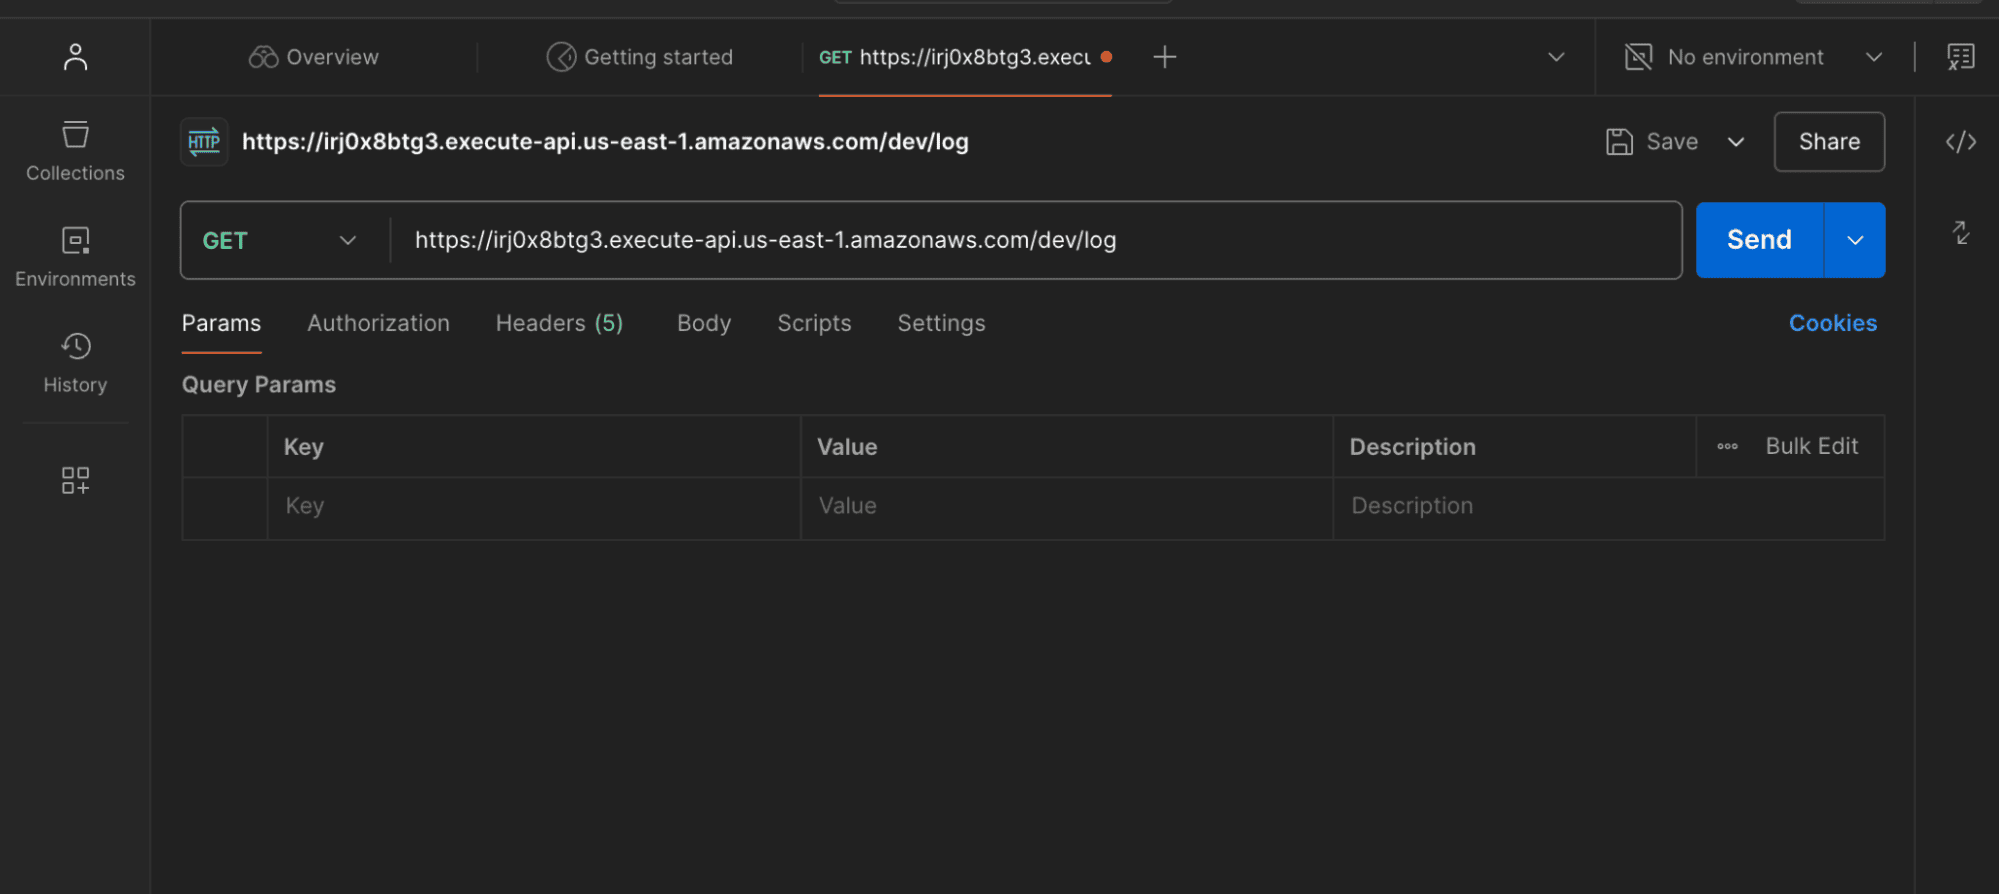
### Invoke Rest API with Postman
Use a tool like Postman or curl to make a GET request to your API endpoint:
```bash
curl -X GET https://irj0x8btg3.execute-api.us-east-1.amazonaws.com/dev/log
```
- 
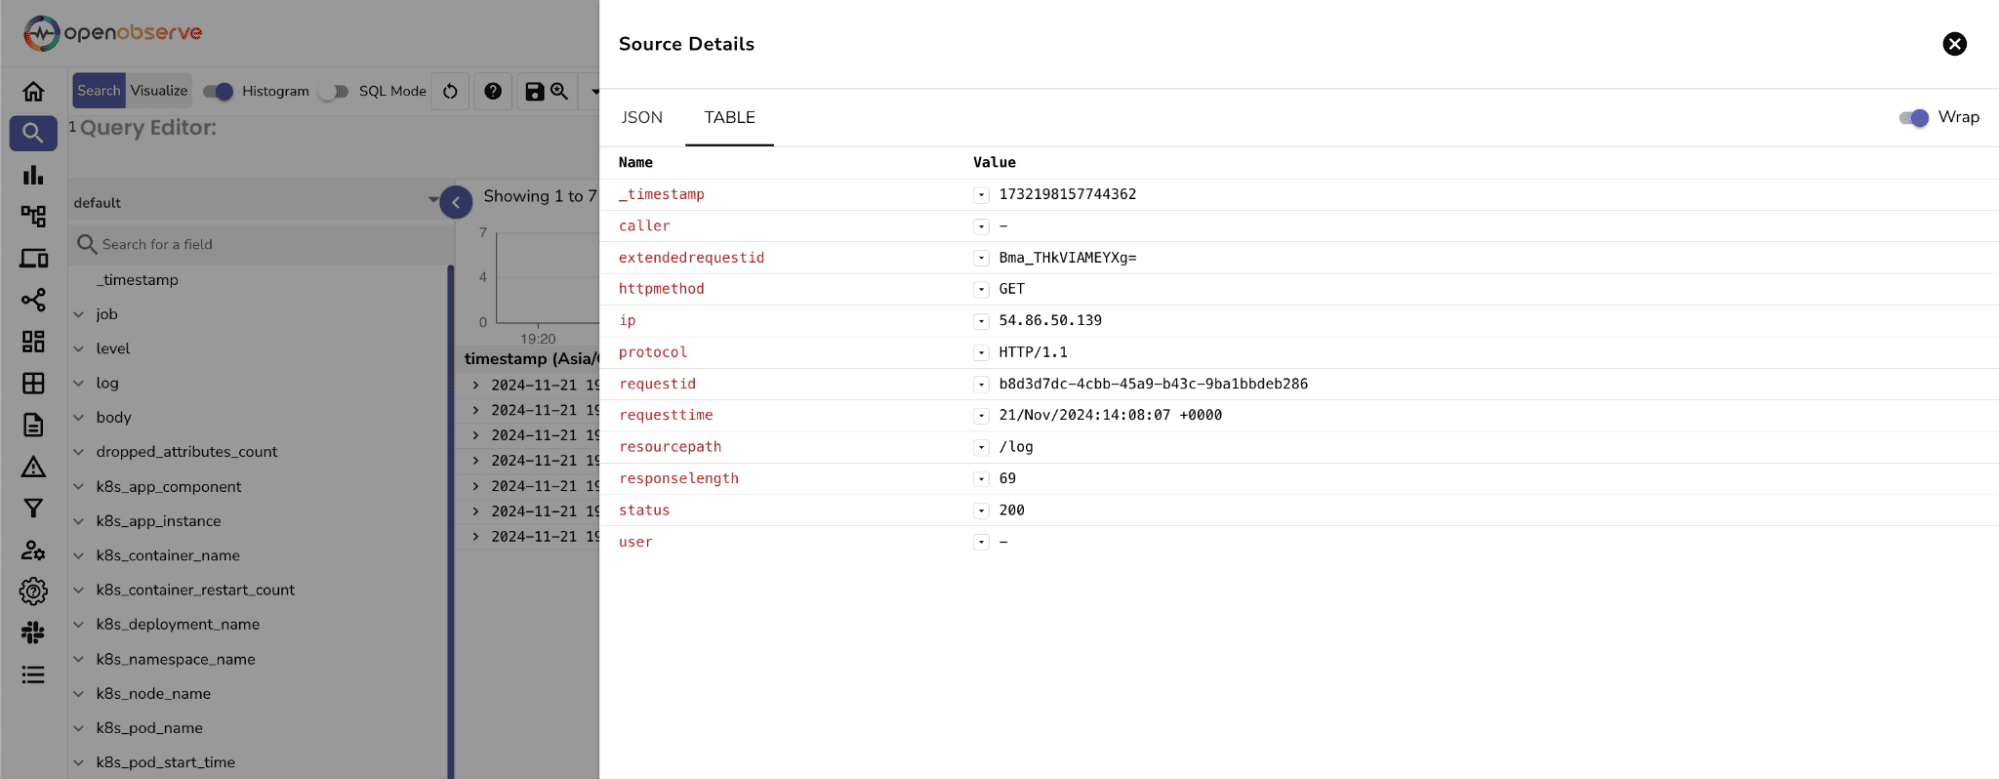
Once you've invoked your API a few times with different test cases, you should be able to see meaningful logs within OpenObserve:
### Analyzing Logs in OpenObserve
Once the above steps are completed, logs are ingested into OpenObserve, you can visualize and analyze them using dashboards. You can download the dashboards here.
1. Go to **Streams → Logs** or simply navigate to the **Logs** tab.
2. Search for logs related to your stream or filter by log level (e.g., `level=error`).
- 
- 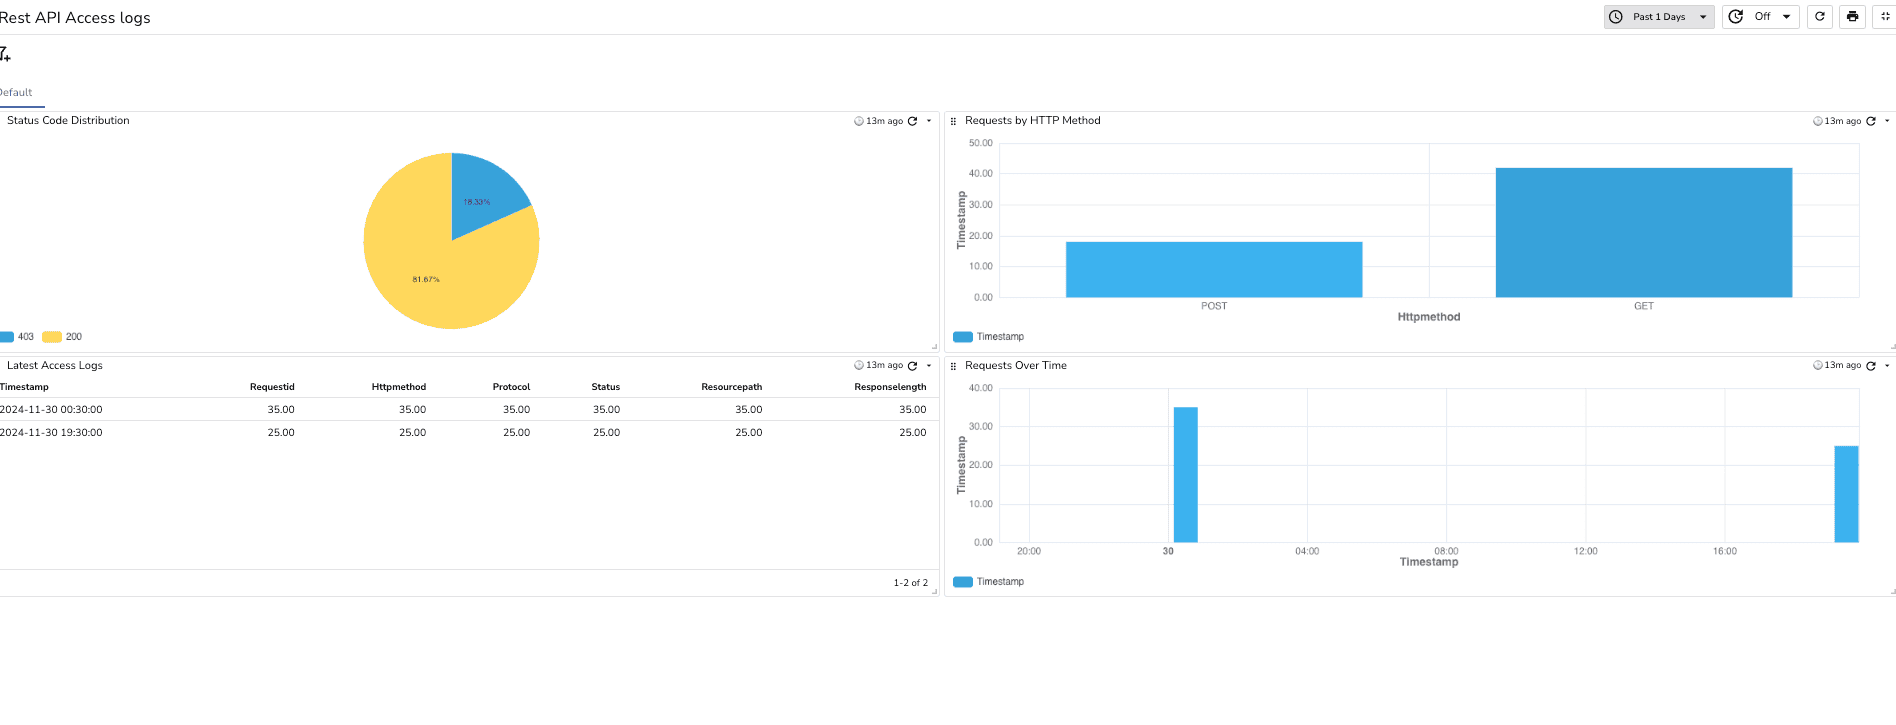
### Key Features of the Rest API Access Logs Dashboard
**Status Code Distribution**:
- Visualize the distribution of HTTP status codes to quickly assess API health and identify common errors.
**Requests by HTTP Method**:
- Analyze API usage by different HTTP methods (GET, POST, etc.), helping to understand user interactions and optimize performance.
**Latest Access Logs Table**:
- View the most recent API access logs with key details, enabling quick identification of issues and monitoring of user activity.
**Requests Over Time**:
- Track trends in API requests over time, providing insights into usage patterns and helping with capacity planning.
You can now run queries on these logs and dashboard for further analysis and continuous monitoring. You've successfully created a robust and scalable system to monitor logs for your REST API!
## Troubleshooting and Next Steps
### Troubleshooting
If you encounter issues with your setup, pay attention to the following:
- For the Access log destination ARN, ensure you enter the **ARN of your Kinesis Firehose stream** in the correct format:
> arn:aws:firehose:{region}:{account-id}:deliverystream/amazon-apigateway-{your-stream-name}
- **Note:** The name of your Firehose stream must be `amazon-apigateway-{your-stream-name}`. This naming convention is crucial for the integration to work seamlessly.
- If logs are not appearing in OpenObserve, double-check that your API Gateway is configured correctly to send logs to the specified Firehose stream. Ensure that the logging settings are enabled and that the API Gateway has the necessary permissions to write to Kinesis Firehose.
### Setting Up Permissions
To ensure that your API Gateway can successfully log to Kinesis Firehose, it's important to set up appropriate permissions. You can follow the guidelines provided in the AWS documentation to configure the necessary IAM roles and policies. For detailed instructions, refer to the following link:
Setting Up Kinesis Access Logging Permissions.
### Next Steps
To further enhance your monitoring capabilities, consider exploring additional features and best practices. [The comprehensive guide on integrating AWS CloudWatch Logs with Amazon Kinesis Firehose](https://openobserve.ai/blog/how-to-stream-aws-cloudwatch-logs-to-amazon-kinesis-firehose/) provides valuable insights on improving your monitoring with OpenObserve. This guide will help you streamline your logging process and gain deeper insights into your API performance: