# Monitoring Snowflake with OpenTelemetry Receiver: An End-to-End Guide
> Discover the ultimate guide to monitoring Snowflake with OpenTelemetry. Learn how to set up seamless telemetry for Snowflake, track performance metrics, identify anomalies, and optimize data operations. This comprehensive tutorial covers everything from configuration to advanced monitoring techniques, ensuring robust observability and actionable insights into your Snowflake environment. Perfect for data engineers, DevOps teams, and analytics professionals seeking to enhance Snowflake monitoring efficiency with OpenTelemetry.
Source: https://openobserve.ai/blog/how-to-monitor-snowflake-with-opentelemetry-receiver/
Published: 2024-12-26
Authors: Chaitanya Sistla
Category: How To
Tags: Database, OpenTelemetry, Integrations
---
## What is Snowflake?
Snowflake is a powerful cloud-based data warehousing solution designed for big data analytics. It enables organizations to store, process, and analyze vast amounts of structured and semi-structured data in a scalable and cost-effective manner. With features like automatic scaling, high performance, and robust security, Snowflake has become a preferred choice for modern data-driven businesses.
Snowflake also supports features like data sharing, time travel, and advanced security options, making it versatile for diverse use cases. Whether you are running complex analytics workloads or supporting real-time dashboards, Snowflake delivers high performance and flexibility.
## Why Should We Monitor Snowflake via OpenTelemetry (OTel)?
Monitoring Snowflake’s performance is crucial to ensure optimal usage, cost management, and operational efficiency. By using OpenTelemetry (OTel), you gain:
- **Unified Observability**: Centralized monitoring of Snowflake along with other systems and services.
- **Detailed Metrics and Traces**: Deep insights into query performance, resource utilization, and anomalies.
- **Custom Dashboards**: Create tailored visualizations to track critical KPIs.
- **Scalability**: Handle monitoring data for large-scale Snowflake instances seamlessly.
- **Proactive Alerting**: Set up alerts to detect and address performance issues before they impact end-users.
With OpenTelemetry, organizations can gain a holistic view of their Snowflake instances, integrating it with other cloud services and applications. This is particularly valuable for troubleshooting and optimization in hybrid or multi-cloud environments.
## Prerequisites
- Ubuntu server (20.04 or later recommended)
- Active Snowflake account
- [Active OpenObserve account](https://openobserve.ai/)
- Understanding of OpenTelemetry
## Step-by-Step Guide to Monitor Snowflake with OpenTelemetry
### 1\. Create a Role in Snowflake
Begin by creating a role in Snowflake to facilitate monitoring access.
```
CREATE ROLE O2_ROLE;
```
You can create a role from snowsight as well as shown in the image. 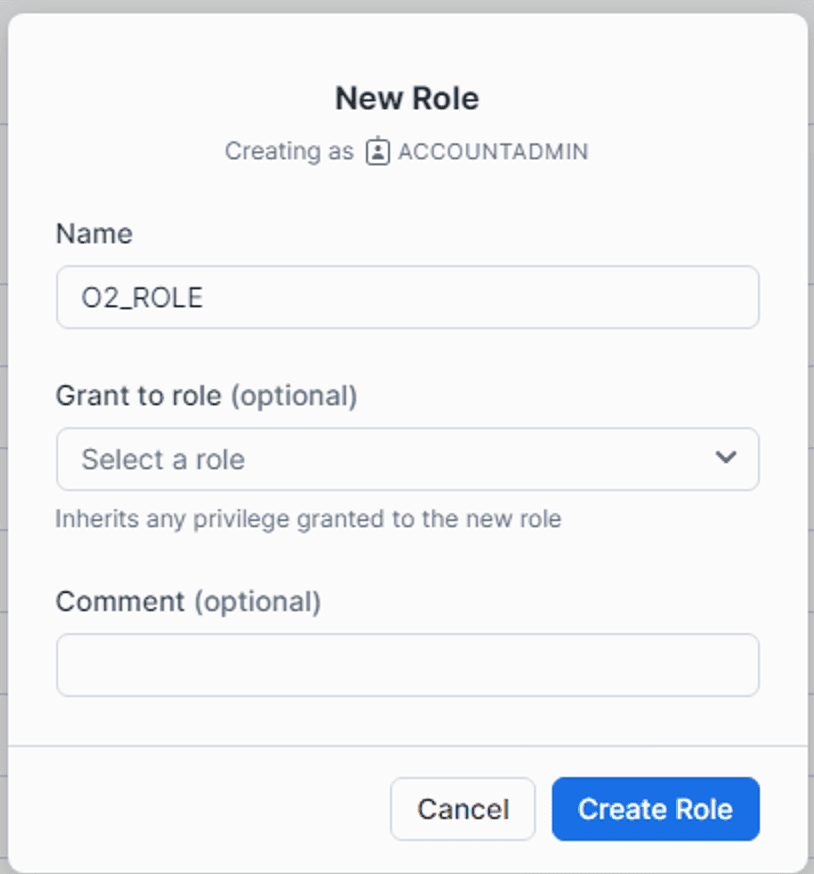
### 2\. Copy the Account Name from Snowflake
- Log in to your Snowflake account.
- Navigate to the **Account** tab.
- Copy the account name for later use. It will be in the format `..`.

### 3\. Provide Permissions to the Role
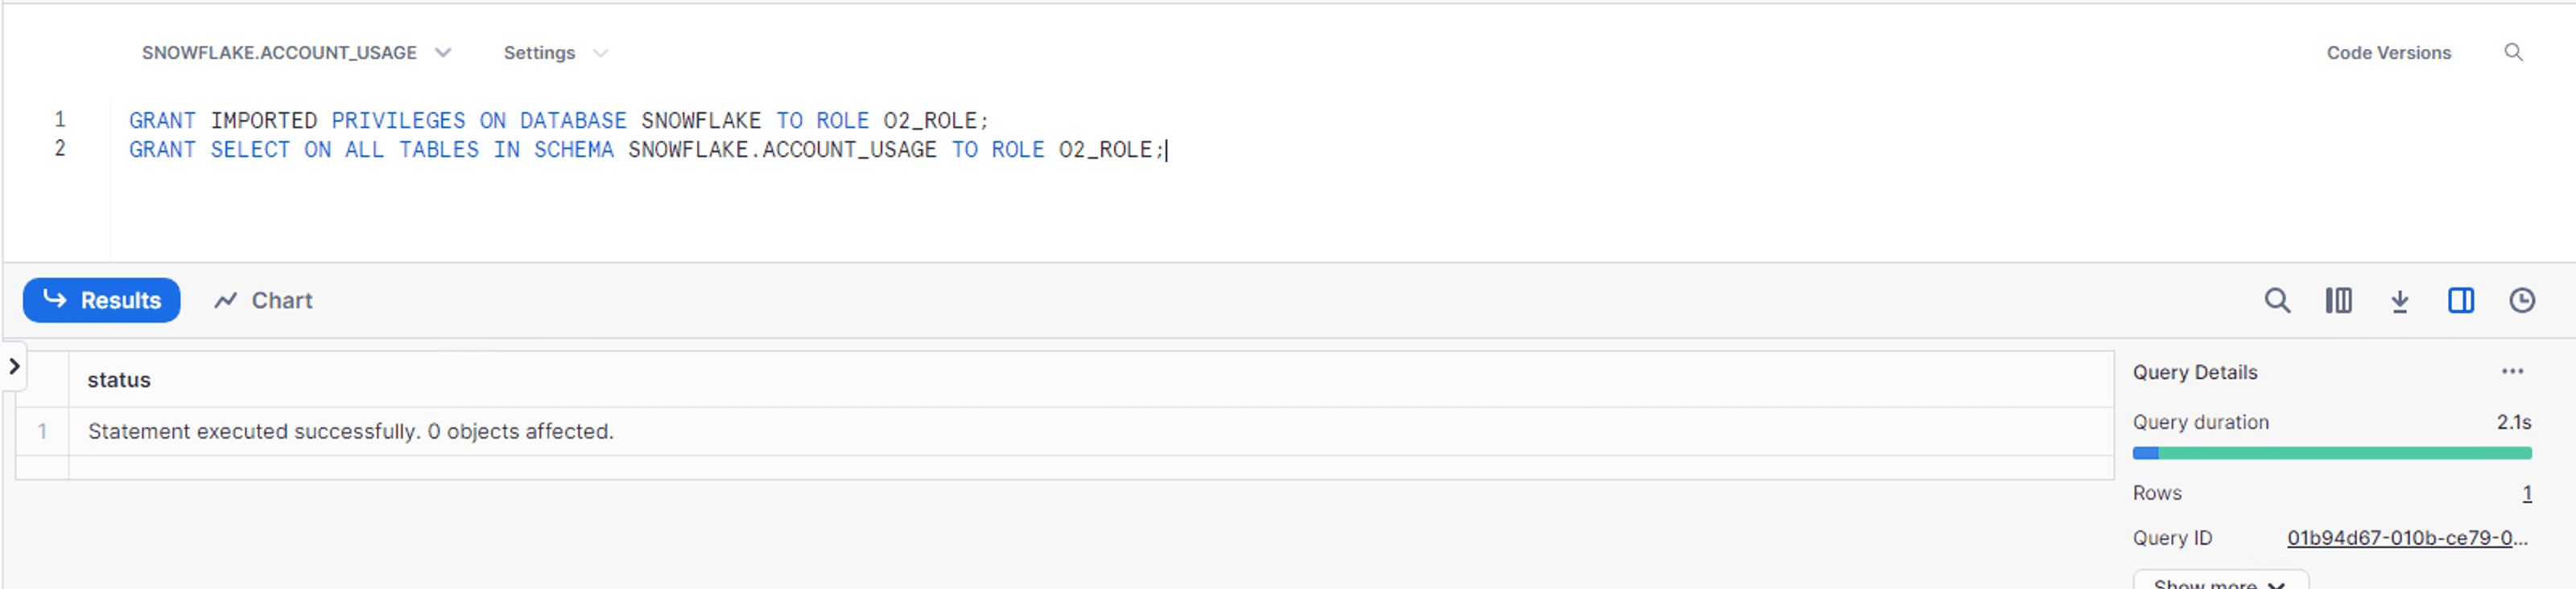
Grant the necessary permissions to the role for monitoring purposes:
```
GRANT IMPORTED PRIVILEGES ON DATABASE SNOWFLAKE TO ROLE O2_ROLE;
GRANT SELECT ON ALL TABLES IN SCHEMA SNOWFLAKE.ACCOUNT_USAGE TO ROLE O2_ROLE;
```
### 4\. Install OpenTelemetry Collector on Ubuntu
---
⚠️ Important Note: Snowflake receiver works with v0.92.0 ⚠️ Latest versions of Snowflake receiver is having issues with float to int conversions which is not the case with v0.92.0. | | :---- |
Install the OpenTelemetry Collector to collect and forward telemetry data from Snowflake:
```
wget https://github.com/open-telemetry/opentelemetry-collector-releases/releases/download/v0.92.0/otelcol-contrib_0.92.0_linux_amd64.deb
dpkg -i otelcol-contrib_0.92.0_linux_amd64.deb
```
### 5\. Configure OpenTelemetry Collector
Create a `config.yaml` file with the following content:
You can create snowflake user, role, database and warehouse by following snowflake instructions.
```
receivers:
snowflake:
username:
password:
account: .
warehouse:
role:
schema: ACCOUNT_USAGE
database: SNOWFLAKE
collection_interval: 5m
metrics:
snowflake.storage.stage_bytes.total:
enabled: true
snowflake.storage.storage_bytes.total:
enabled: true
snowflake.storage.failsafe_bytes.total:
enabled: true
snowflake.rows_inserted.avg:
enabled: true
snowflake.database.query.count:
enabled: true
snowflake.pipe.credits_used.total:
enabled: true
snowflake.query.blocked:
enabled: true
snowflake.query.bytes_deleted.avg:
enabled: true
snowflake.billing.warehouse.cloud_service.total:
enabled: true
snowflake.query.compilation_time.avg:
enabled: true
snowflake.billing.warehouse.virtual_warehouse.total:
enabled: true
snowflake.billing.virtual_warehouse.total:
enabled: true
snowflake.query.bytes_written.avg:
enabled: true
snowflake.billing.cloud_service.total:
enabled: true
snowflake.billing.total_credit.total:
enabled: true
snowflake.database.bytes_scanned.avg:
enabled: true
snowflake.logins.total:
enabled: true
snowflake.query.data_scanned_cache.avg:
enabled: true
snowflake.rows_deleted.avg:
enabled: true
snowflake.rows_produced.avg:
enabled: true
snowflake.rows_unloaded.avg:
enabled: true
snowflake.session_id.count:
enabled: true
exporters:
debug:
verbosity: detailed
sampling_initial: 5
sampling_thereafter: 200
otlphttp/openobserve:
endpoint:
headers:
Authorization:
stream-name:
service:
telemetry:
logs:
level: "debug"
pipelines:
metrics:
receivers: [snowflake]
exporters: [otlphttp/openobserve]
```
**Replace**:
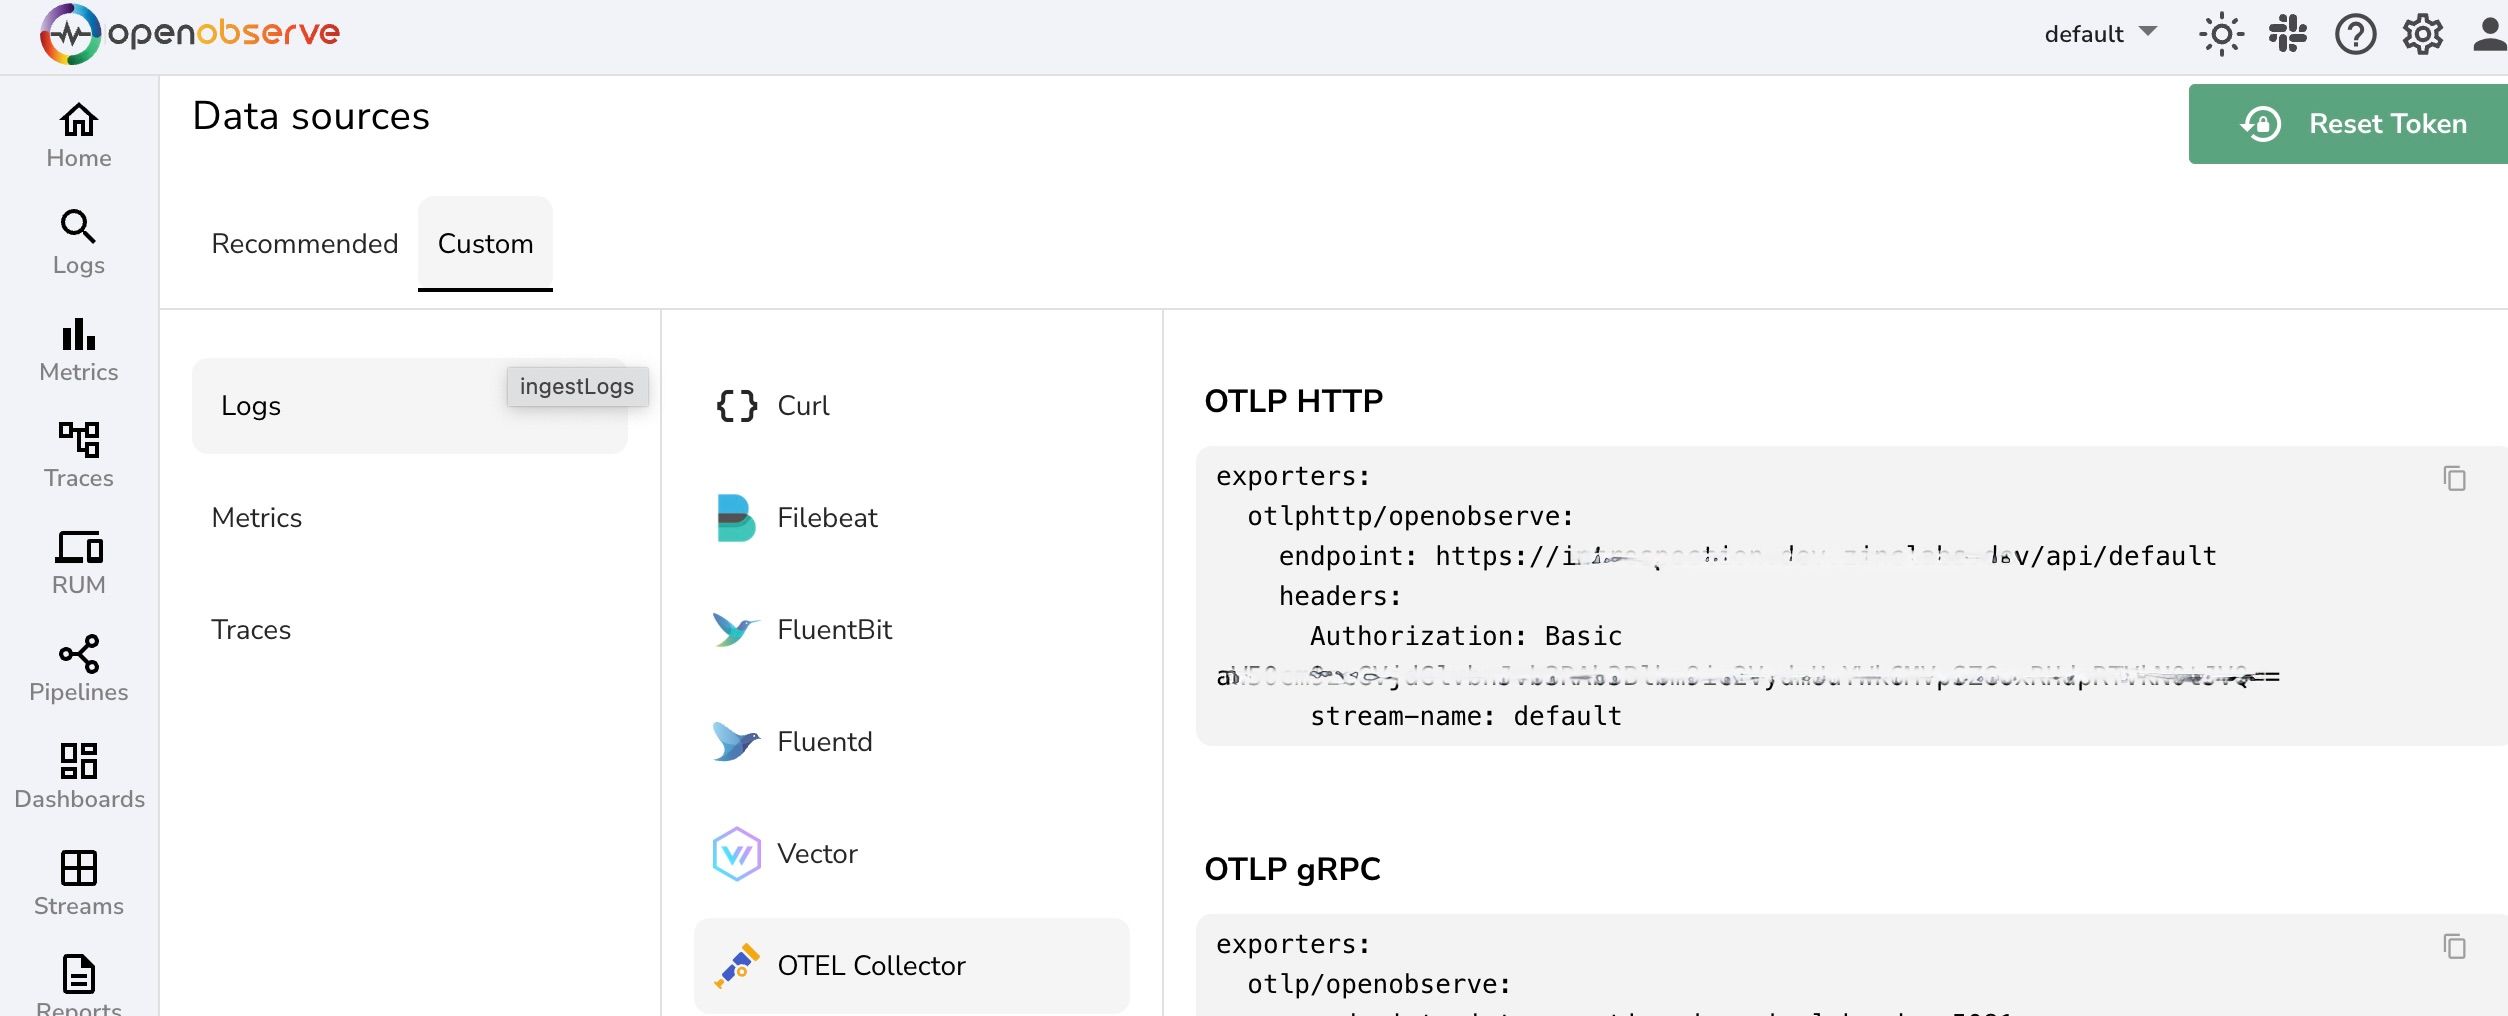
- `OPENOBSERVE_ENDPOINT` with your OpenObserve endpoint (e.g., `http://openobserve.example.com/api/org`).
- `OPENOBSERVE_TOKEN` with your OpenObserve authentication token.
- `OPENOBSERVE_STREAM` with your desired stream name.
### 6\. Restart the OpenTelemetry Collector
Restart the OpenTelemetry Collector service to apply the configuration:
```
systemctl restart otelcol-contrib
```
### 7\. Configure Dashboards
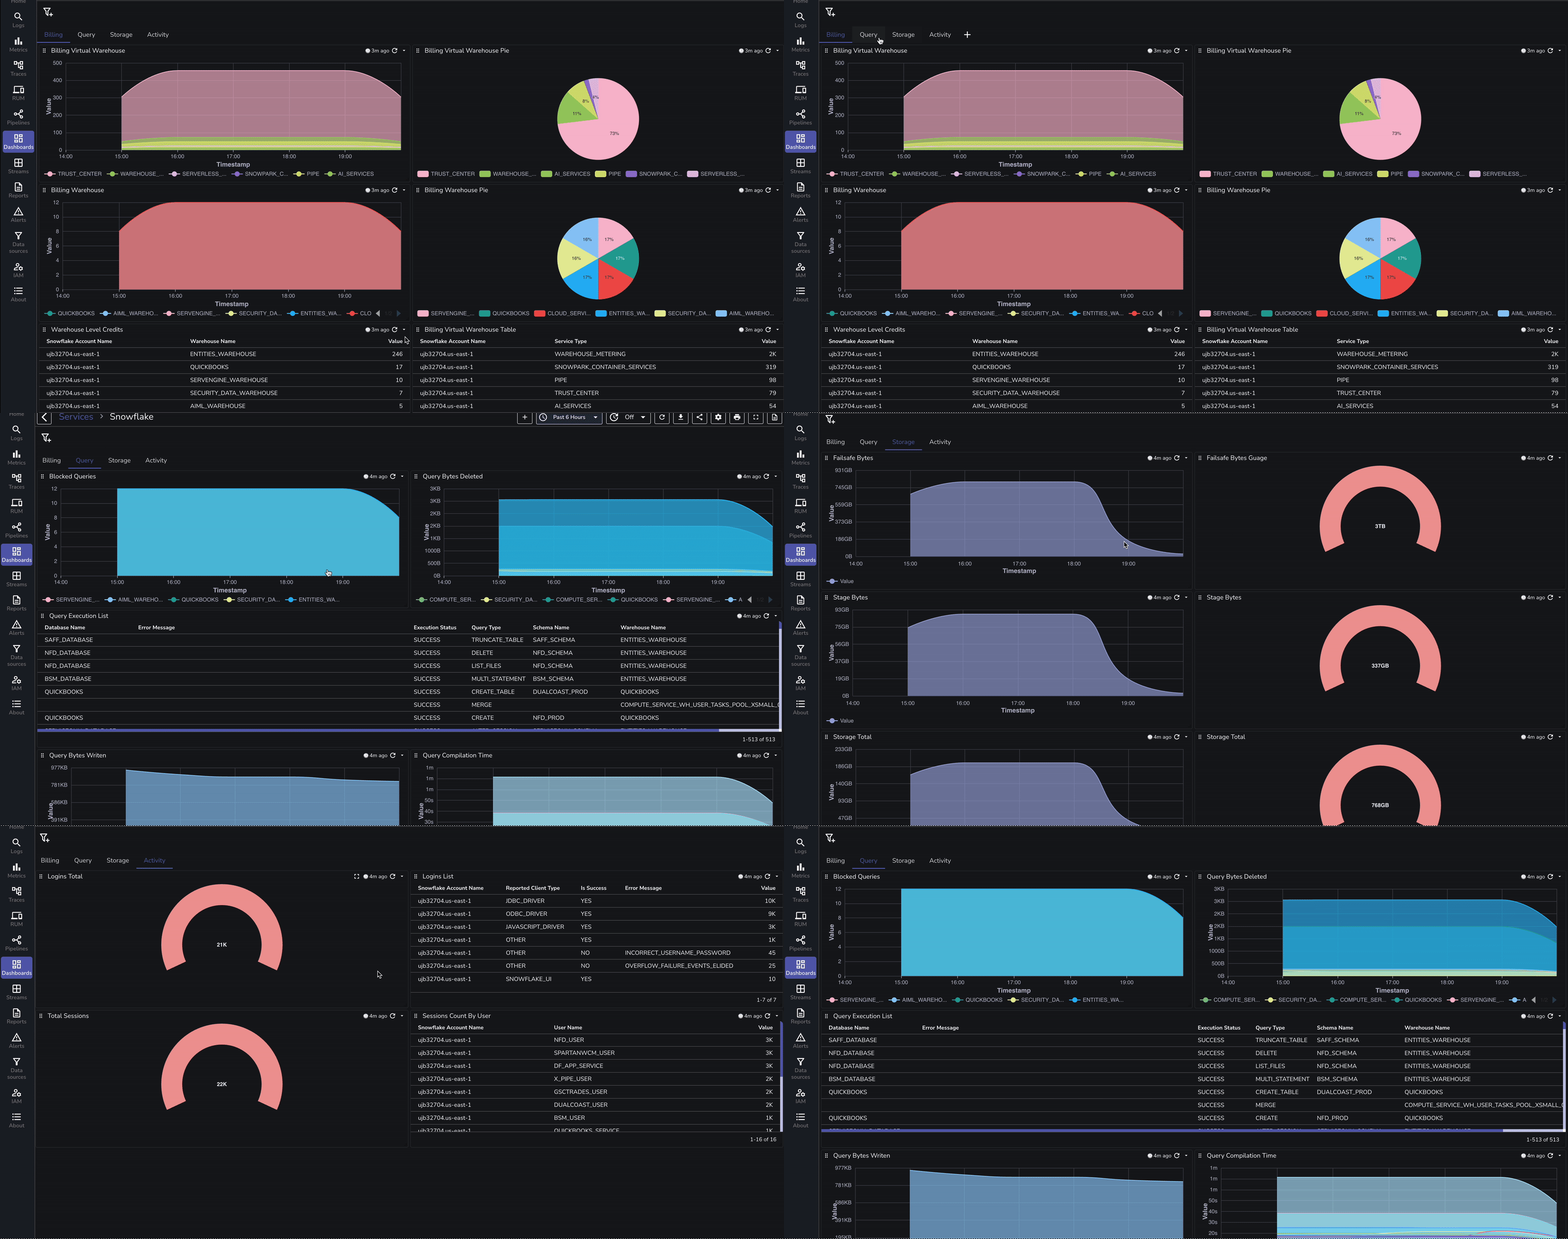
As soon as metrics are ingested to OpenObserve, you can confirm them by verifying in OpenObserve dashboard. Configure dashboards based on the telemetry data collected. Include key metrics like: 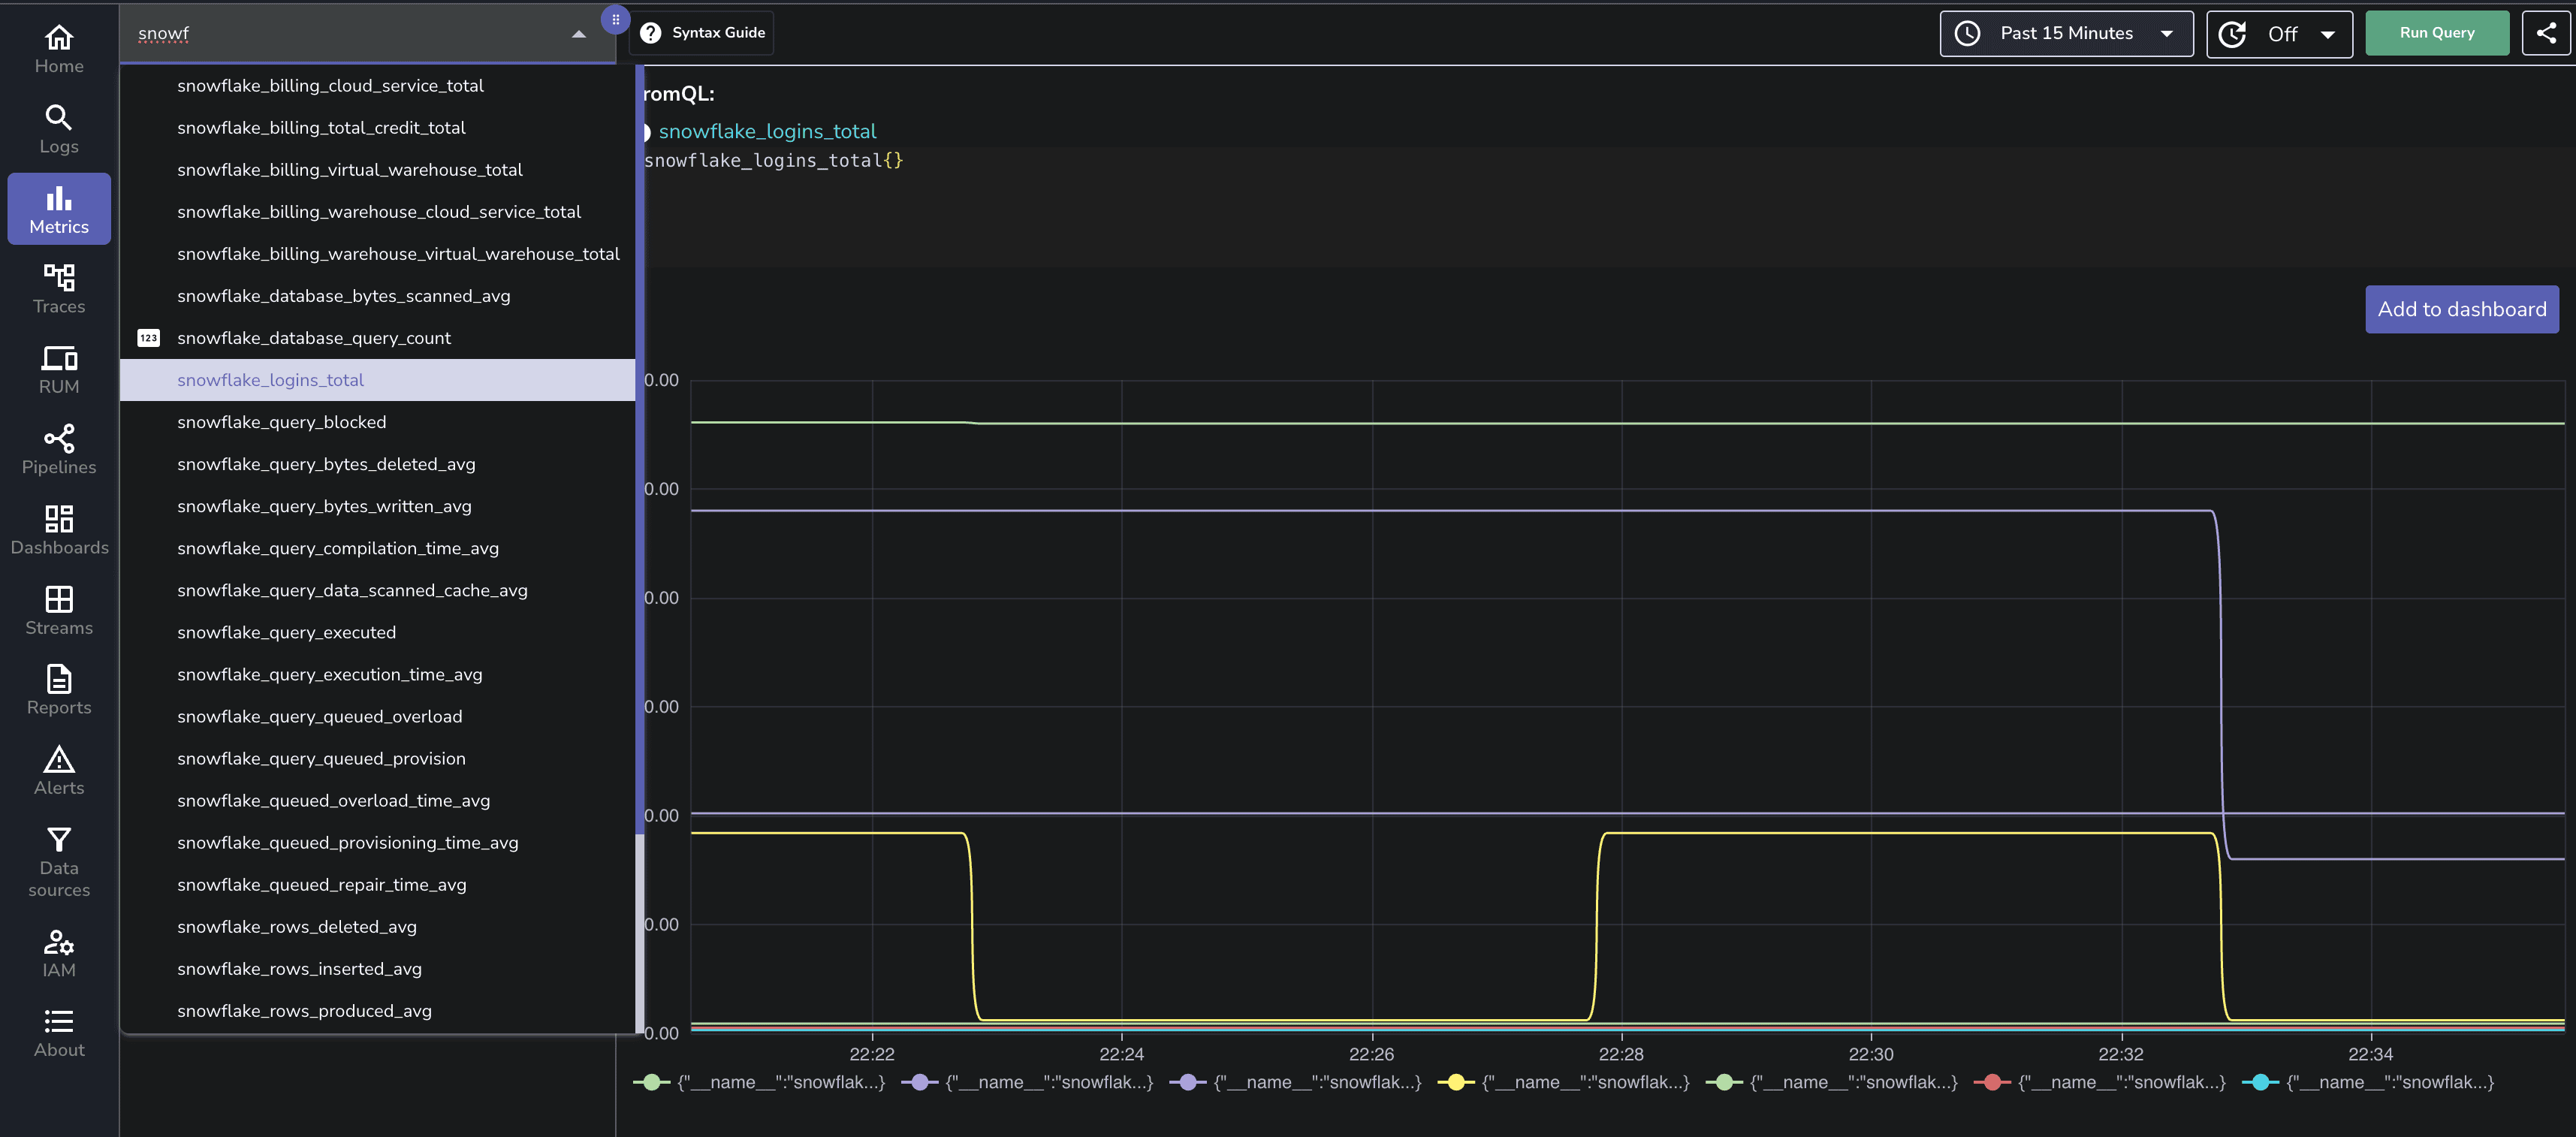
- Query execution time
- Concurrency levels
- Resource usage trends
- Data ingestion and extraction rates
- Number of active users
- Average query response time
Ensure you set up drill-down capabilities to identify specific queries or operations contributing to performance bottlenecks.
To make it easy, we have pre-built the dashboards that can be found here.
### 8\. Table: Snowflake Monitoring via OTel vs. Native Tools
| Feature | Snowflake Monitoring (Native) | Monitoring via OpenTelemetry |
| -------------------------- | ----------------------------- | --------------------------------- |
| Unified Observability | Limited to Snowflake | Integrates with other systems |
| Custom Dashboards | Predefined, less flexible | Highly customizable |
| Query-Level Insights | Available | Available with detailed metrics |
| Alerting and Notifications | Basic | Advanced with custom rules |
| Scalability | Good | Excellent for hybrid environments |
| Multi-Source Integration | No | Yes |
| Cost Optimization Metrics | Limited | Extensive |
## Conclusion
Monitoring Snowflake with OpenTelemetry provides unparalleled observability and control over your data warehousing environment. With OTel’s robust features, you can go beyond Snowflake’s native tools to achieve a unified, scalable, and efficient monitoring solution. By following this guide, you can set up end-to-end monitoring, create insightful dashboards in OpenObserve, and ensure your Snowflake workloads perform at their best.
By leveraging the integration between Snowflake, OpenTelemetry and OpenObserve, organizations can optimize costs, proactively address performance issues, and make data-driven decisions with confidence. Start your monitoring journey today and unlock the full potential of your Snowflake data warehousing ecosystem.