# Instrumenting Amazon Bedrock, Bedrock Agents, and AgentCore with OpenTelemetry
> Trace Amazon Bedrock model calls, Bedrock Agents, and AgentCore with OpenTelemetry's gen_ai.* conventions (v1.41), then track token cost in dollars in OpenObserve.
Source: https://openobserve.ai/blog/instrument-amazon-bedrock-opentelemetry/
Published: 2026-06-22
Authors: Gorakhnath Yadav
Category: How To
Tags: Amazon Bedrock, OpenTelemetry, Observability, LLM, AgentCore
---
**TL;DR:** To **instrument Amazon Bedrock with OpenTelemetry**, you put the same `gen_ai.*` semantic conventions on three different surfaces: raw model calls through boto3, managed Bedrock Agents through the `InvokeAgent` API, and agents running on Bedrock AgentCore. Each one emits spans with `gen_ai.provider.name=aws.bedrock`, the model id, and token counts, plus the `gen_ai.client.token.usage` metric. Point those exports at an OTLP backend like [OpenObserve](https://openobserve.ai/) instead of only CloudWatch, add a small cost layer that turns tokens into dollars, and you get one dashboard for spend and latency across every way your app talks to Bedrock.
- Three Bedrock surfaces (model calls, managed Agents, AgentCore) all map onto the same `gen_ai.*` spans and metrics.
- `gen_ai.system` is deprecated. The current attribute is `gen_ai.provider.name`, and Bedrock's value is `aws.bedrock`.
- Token attributes plus a price map keyed by model id give you cost in dollars per call, per session, and per user.
- The conventions are still experimental, so pin versions and opt in with `OTEL_SEMCONV_STABILITY_OPT_IN`.
## Three ways to call Bedrock, one set of conventions
Amazon Bedrock is not one API. An application reaches it through at least three doors, and each produces a different shape of telemetry if you let the vendor SDK decide.
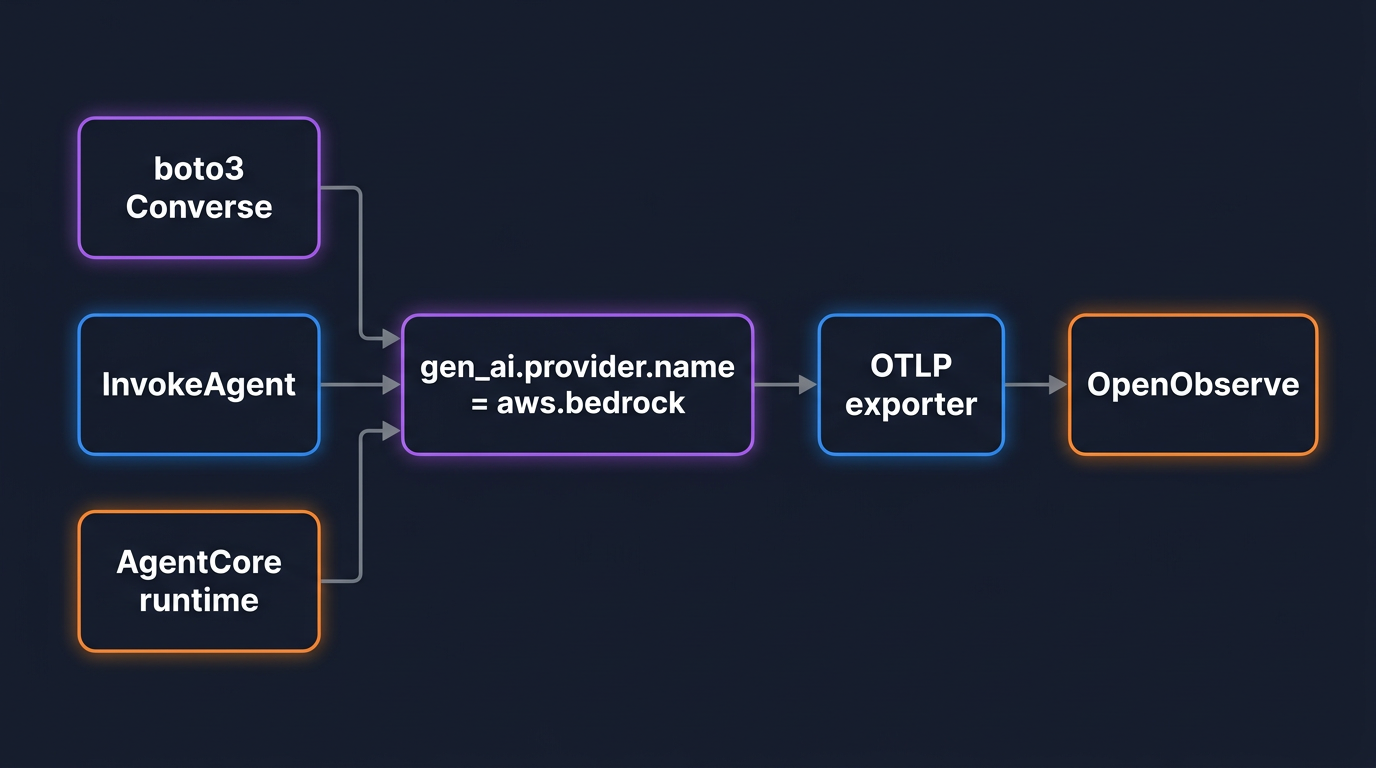
The first door is a direct model call: boto3's `bedrock-runtime` client running `Converse` or `InvokeModel` against a model id. The second is a managed Bedrock Agent, called through the `bedrock-agent-runtime` `InvokeAgent` API, where AWS runs the orchestration loop, the tool calls, and the knowledge-base lookups for you. The third is Bedrock AgentCore, the runtime where you deploy your own agent code and AWS gives it a session, memory, and identity.
Left alone, those three produce three unrelated views. The point of the OpenTelemetry GenAI semantic conventions is to collapse them into one. A direct call, an agent invocation, and an AgentCore run all emit spans from the same `gen_ai.*` namespace, with the same attribute for the provider, the same attributes for token usage, and the same metric for token counts. You read all three the same way, and you can put total Bedrock spend on a single chart regardless of which door the request came through. If you have already set this up for OpenAI, this is the same model applied to Bedrock; the companion guide on [monitoring OpenAI API costs with OpenTelemetry](https://openobserve.ai/blog/monitor-openai-api-costs-opentelemetry/) covers the OpenAI side, and the conventions are identical here.
## The gen_ai.* cheat sheet for Bedrock (v1.41)
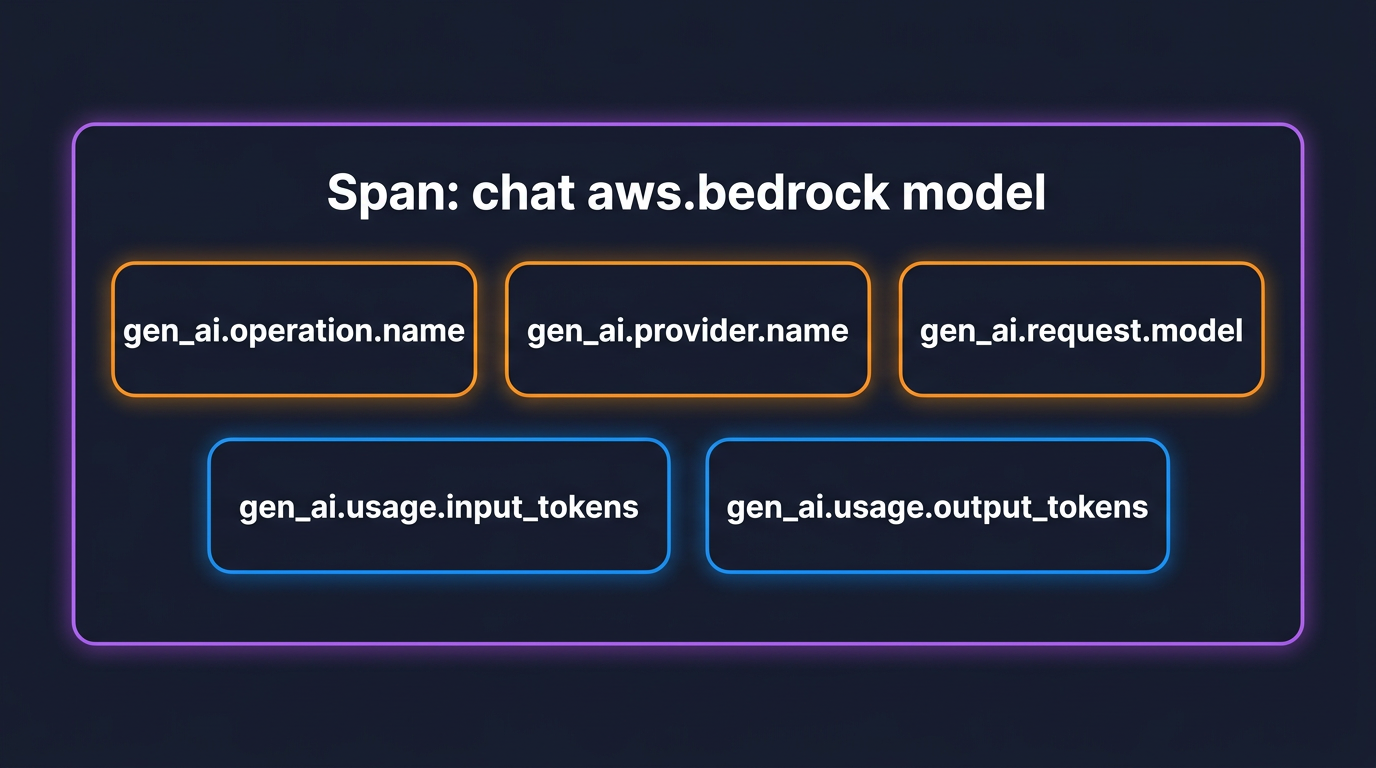
Before any code, here is the vocabulary. These come from the OpenTelemetry GenAI semantic conventions as of the v1.41 release. One thing to get right up front: everything in this section is still marked **Development**, the current word for experimental. Attribute names have already changed once, so treat them as a moving target and pin your instrumentation versions.
A Bedrock model span carries these attributes:
| Attribute | What it holds | Example |
|---|---|---|
| `gen_ai.operation.name` | The operation | `chat`, `invoke_agent`, `execute_tool` |
| `gen_ai.provider.name` | The provider (replaces `gen_ai.system`) | `aws.bedrock` |
| `gen_ai.request.model` | The model id requested | `anthropic.claude-3-5-sonnet-20241022-v2:0` |
| `gen_ai.response.model` | The model id that answered | `amazon.nova-pro-v1:0` |
| `gen_ai.usage.input_tokens` | Input tokens (includes cached) | `1820` |
| `gen_ai.usage.output_tokens` | Output tokens (includes reasoning) | `340` |
| `aws.bedrock.guardrail.id` | Guardrail applied, when present | `abc123` |
| `aws.bedrock.knowledge_base.id` | Knowledge base queried, when present | `kb-456` |
The span name is not free-form. The convention builds it from `{gen_ai.operation.name} {gen_ai.request.model}`, so a chat call against a model renders as `chat anthropic.claude-3-5-sonnet-20241022-v2:0`, and a managed agent invocation renders as `invoke_agent `. That naming is why you can group spans by operation without parsing free text.
The single most important change from older blog posts and older instrumentations: **`gen_ai.system` is deprecated and replaced by `gen_ai.provider.name`.** For Bedrock the value moved from `gen_ai.system=aws.bedrock` to `gen_ai.provider.name=aws.bedrock`. During the transition you will see spans with one, the other, or both, depending on the instrumentation version. To make a given instrumentation emit the current shape rather than its frozen default, set:
```bash
OTEL_SEMCONV_STABILITY_OPT_IN=gen_ai_latest_experimental
```
On the metrics side, two instruments do most of the work. `gen_ai.client.token.usage` is a histogram in units of `{token}`, split by a `gen_ai.token.type` attribute whose value is `input` or `output`, so one metric gives you input and output token distributions per model. `gen_ai.client.operation.duration` is a histogram in seconds for call latency. Both carry `gen_ai.provider.name` and `gen_ai.request.model`, so you slice them by model and by surface the same way you slice the spans. If the three-signal model is new to you, [OpenTelemetry for LLMs](https://openobserve.ai/blog/opentelemetry-for-llms/) walks through how spans, metrics, and the GenAI conventions fit together.
## The demo app and sending telemetry to OpenObserve
The running example for the rest of this guide is a small support assistant. It answers customer questions by calling Bedrock directly for simple replies, handing harder cases to a managed Bedrock Agent that can search a knowledge base, and running a long-lived planning agent on AgentCore for multi-step work. One application, all three Bedrock surfaces.
Every part of it exports over OTLP, so the backend configuration is shared. OpenObserve is OpenTelemetry-native: it accepts traces, metrics, and logs on one OTLP endpoint, which means there is no Bedrock-specific integration to install. You point the standard environment variables at it and the data lands. This is the same OTLP path described in [OpenTelemetry backends and OTLP support](https://openobserve.ai/blog/opentelemetry-backends-otlp-support/).
```bash
OTEL_EXPORTER_OTLP_PROTOCOL=http/protobuf
OTEL_EXPORTER_OTLP_ENDPOINT=https://your-host/api/your_org
OTEL_EXPORTER_OTLP_HEADERS=Authorization=Basic
```
Two details that cause most first-run failures. The endpoint is the base organization path with no trailing slash; the OpenTelemetry SDK appends `/v1/traces` and `/v1/metrics` itself, and a trailing slash produces a 404. The auth header is HTTP Basic, where the token is the base64 of your `email:password` pair, which you generate with `echo -n 'you@example.com:your-password' | base64`. For a self-hosted instance, swap the host for `http://localhost:5080` and keep the `/api/your_org` path. A successful ingest returns HTTP 200.
## Part 1: Tracing raw Bedrock calls with boto3
A direct Bedrock call goes through boto3, and boto3 is instrumented by the botocore instrumentation, which recognizes Bedrock operations and emits `gen_ai.*` spans for them. There is no Bedrock-specific package to add.
```bash
pip install opentelemetry-instrumentation-botocore opentelemetry-exporter-otlp boto3
```
```python
import boto3
from opentelemetry.instrumentation.botocore import BotocoreInstrumentor
BotocoreInstrumentor().instrument()
client = boto3.client("bedrock-runtime", region_name="us-east-1")
response = client.converse(
modelId="anthropic.claude-3-5-sonnet-20241022-v2:0",
messages=[{"role": "user", "content": [{"text": "Why was my order delayed?"}]}],
)
print(response["output"]["message"]["content"][0]["text"])
```
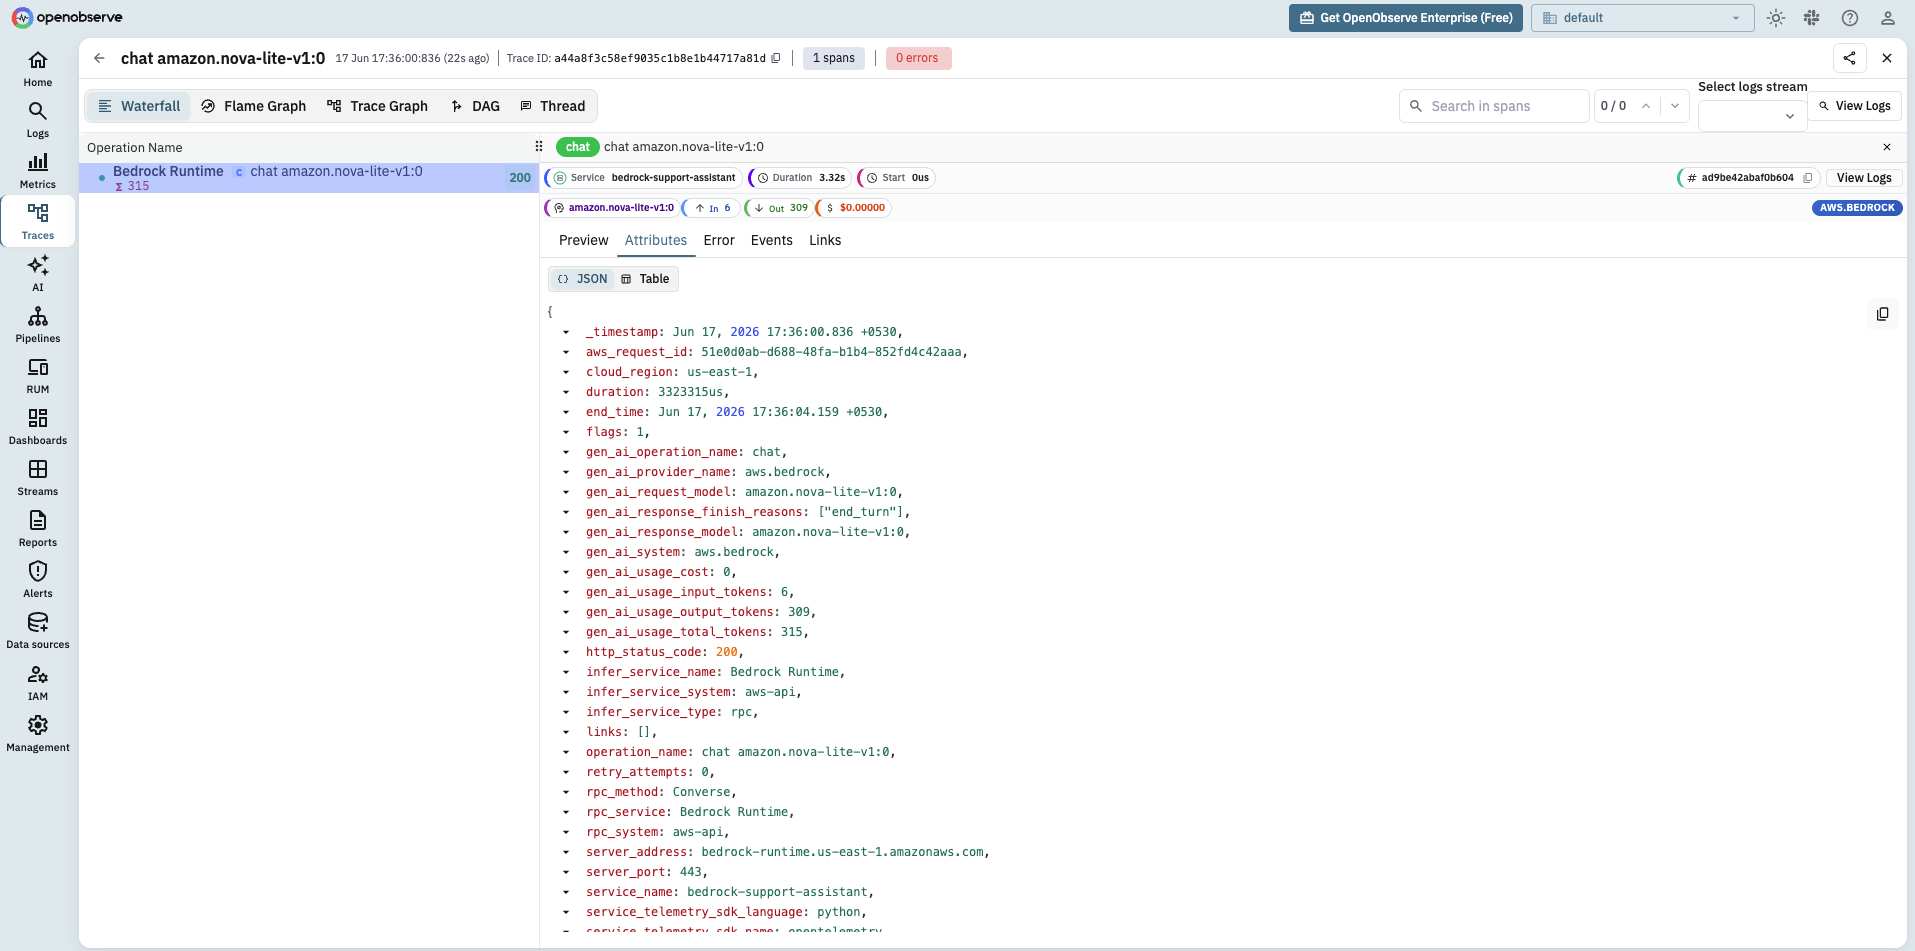
That single call produces a span named `chat anthropic.claude-3-5-sonnet-20241022-v2:0` with `gen_ai.provider.name=aws.bedrock`, the request and response model ids, and `gen_ai.usage.input_tokens` and `gen_ai.usage.output_tokens` read straight from the Bedrock response. It also records the `gen_ai.client.token.usage` and `gen_ai.client.operation.duration` metrics for the same call.
One choice matters here: use `Converse`, not `InvokeModel`, if you want dependable telemetry. The botocore instrumentation has full span, event, and metric coverage for `Converse` and `ConverseStream` across Bedrock models. `InvokeModel` and `InvokeModelWithResponseStream` are instrumented only for a subset of models, because each model family has its own request and response body shape and the instrumentation has to understand each one to pull token counts out. `Converse` normalizes the shape, so one instrumentation reads tokens and finish reasons the same way for every model behind it. If you are stuck on `InvokeModel` for a model that `Converse` does not support, expect to fill in token attributes yourself in a span processor.
One practical note: Bedrock model ids retire. The examples here use a Claude id for readability, but if `Converse` returns `ResourceNotFoundException: This model version has reached the end of its life`, the id is retired, swap in a current one (for example `amazon.nova-lite-v1:0`) from `aws bedrock list-foundation-models`. The instrumentation is identical regardless of model.
## Part 2: Tracing managed Bedrock Agents
A managed Bedrock Agent is different from a direct call. You do not run the loop; you call `InvokeAgent` on the `bedrock-agent-runtime` client and AWS orchestrates the model calls, the action-group tool invocations, and any knowledge-base retrieval on its side. From your process, it is one API call that hides a multi-step run.
Here is the catch, and it is the single most useful thing to know about this surface: out of the box the botocore instrumentation traces `InvokeAgent` only as a generic AWS-call span (`rpc.method=InvokeAgent`), with no `gen_ai.*` attributes at all. The GenAI conventions it applies so cleanly to `bedrock-runtime` `Converse` do not extend to `bedrock-agent-runtime`. So by default a managed agent is a black box: one bare RPC span and nothing about the models or tools it ran inside.
To get gen_ai-level visibility, ask AWS for the detail. `InvokeAgent` accepts `enableTrace=True`, and the response stream then includes the agent's orchestration trace: each internal model invocation with its token usage, plus tool and knowledge-base steps, across the preprocessing and orchestration phases. You map that returned data onto `gen_ai.*` spans yourself, an `invoke_agent` parent with a `chat` child per model invocation.
```python
import boto3
from opentelemetry import trace
tracer = trace.get_tracer("support-assistant")
agent = boto3.client("bedrock-agent-runtime", region_name="us-east-1")
with tracer.start_as_current_span("invoke_agent") as parent:
parent.set_attribute("gen_ai.operation.name", "invoke_agent")
parent.set_attribute("gen_ai.provider.name", "aws.bedrock")
parent.set_attribute("session.id", "user-7421-session-3")
stream = agent.invoke_agent(
agentId="AGENT123", agentAliasId="TSTALIASID",
sessionId="user-7421-session-3",
inputText="Why was my order delayed?",
enableTrace=True,
)
for event in stream["completion"]:
if "trace" not in event:
continue
tr = event["trace"]["trace"]
for phase in ("preProcessingTrace", "orchestrationTrace"):
usage = tr.get(phase, {}).get("modelInvocationOutput", {}).get("metadata", {}).get("usage")
if not usage:
continue
with tracer.start_as_current_span("chat") as s:
s.set_attribute("gen_ai.operation.name", "chat")
s.set_attribute("gen_ai.provider.name", "aws.bedrock")
s.set_attribute("gen_ai.request.model", "amazon.nova-lite-v1:0")
s.set_attribute("gen_ai.usage.input_tokens", usage["inputTokens"])
s.set_attribute("gen_ai.usage.output_tokens", usage["outputTokens"])
```
The result is a real gen_ai trace for a managed agent: an `invoke_agent` span with `gen_ai.provider.name=aws.bedrock` and child `chat` spans carrying the actual token counts AWS reports for the agent's internal calls. That is exactly the kind of agent call chain that [monitoring AI agents in production](https://openobserve.ai/blog/monitor-ai-agents-production/) is about: a slow or failing agent stops being a black hole in your latency. If you also leave `BotocoreInstrumentor` on, you will see its bare `InvokeAgent` RPC span sitting next to these gen_ai spans; drop it on this path if you want only the gen_ai view.
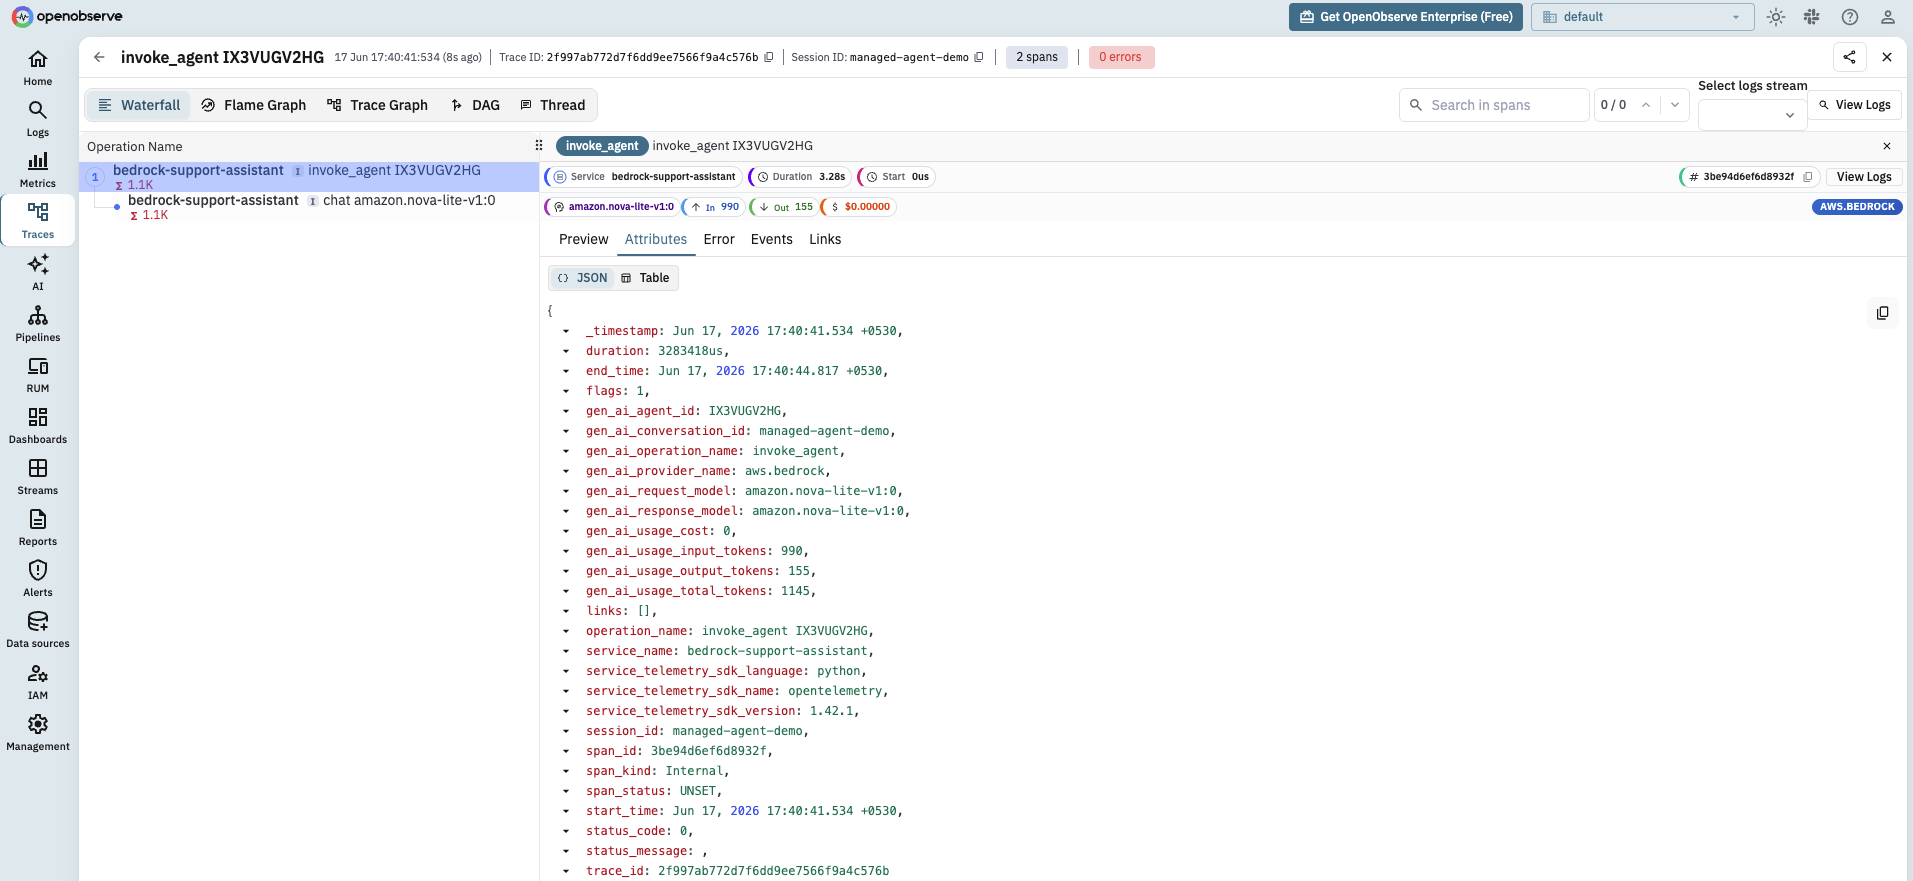
Note `sessionId` and the matching `session.id` attribute. Pass a stable value and every invocation for that conversation shares it, which is what lets you group an entire multi-turn session in OpenObserve later.
## Part 3: Bedrock AgentCore observability
AgentCore is the third surface and the one with the most moving parts. Unlike a managed Bedrock Agent, AgentCore is not an agent itself, it is a managed runtime that hosts agent code you write, whether you build that agent with the Strands Agents SDK, another framework, or plain Python. AWS instruments the runtime through ADOT, the AWS Distro for OpenTelemetry, and the path is auto-instrumentation rather than code changes.
```text
aws-opentelemetry-distro>=0.10.0
boto3
```
You launch the agent through the `opentelemetry-instrument` wrapper, which loads the distro and instruments the runtime, boto3, and the supported agent libraries without touching your code:
```dockerfile
CMD ["opentelemetry-instrument", "python", "main.py"]
```
For an agent running outside the managed runtime, or when you want it to export somewhere other than CloudWatch, the configuration is environment variables:
```bash
AGENT_OBSERVABILITY_ENABLED=true
OTEL_PYTHON_DISTRO=aws_distro
OTEL_PYTHON_CONFIGURATOR=aws_configurator
OTEL_TRACES_EXPORTER=otlp
OTEL_EXPORTER_OTLP_PROTOCOL=http/protobuf
OTEL_EXPORTER_OTLP_ENDPOINT=https://your-host/api/your_org
OTEL_EXPORTER_OTLP_HEADERS=Authorization=Basic
DISABLE_ADOT_OBSERVABILITY=true
```
`DISABLE_ADOT_OBSERVABILITY=true` is the switch that matters for this guide. By default ADOT routes AgentCore telemetry to CloudWatch GenAI Observability. Setting it true turns off the automatic CloudWatch path so your standard `OTEL_EXPORTER_OTLP_ENDPOINT` takes over and the traces flow to OpenObserve instead. You are not locked into one backend.
Two propagation details make AgentCore telemetry actually useful. Sessions propagate through the `X-Amzn-Bedrock-AgentCore-Runtime-Session-Id` header, mirrored into OpenTelemetry baggage as `session.id`, so every span from one user's session shares a key you can filter on. Trace context propagates through the W3C `traceparent` header (AgentCore also understands X-Ray's `X-Amzn-Trace-Id`), so when your application starts a span and then calls the agent, the agent's spans nest under yours and the whole request reads as one trace.
If you build the agent itself with the Strands Agents SDK, it has its own OpenTelemetry setup through `StrandsTelemetry`, which emits `gen_ai.*` spans for the agent loop, the Bedrock model calls, and tool invocations. One caveat worth knowing: its OTLP exporter is HTTP only, so use the HTTP endpoint on port 4318, not gRPC.
```python
import os
from strands.telemetry import StrandsTelemetry
os.environ["OTEL_EXPORTER_OTLP_ENDPOINT"] = "https://your-host/api/your_org"
os.environ["OTEL_EXPORTER_OTLP_HEADERS"] = "Authorization=Basic "
StrandsTelemetry().setup_otlp_exporter()
```
A single run then produces the full agent loop as one trace: an `invoke_agent` parent, an `execute_event_loop_cycle` per turn, a `chat` span for each Bedrock model call with its token counts, and an `execute_tool` span for each tool the agent runs. This is the gen_ai-level agent visibility that the managed `InvokeAgent` API only gives you through `enableTrace`.
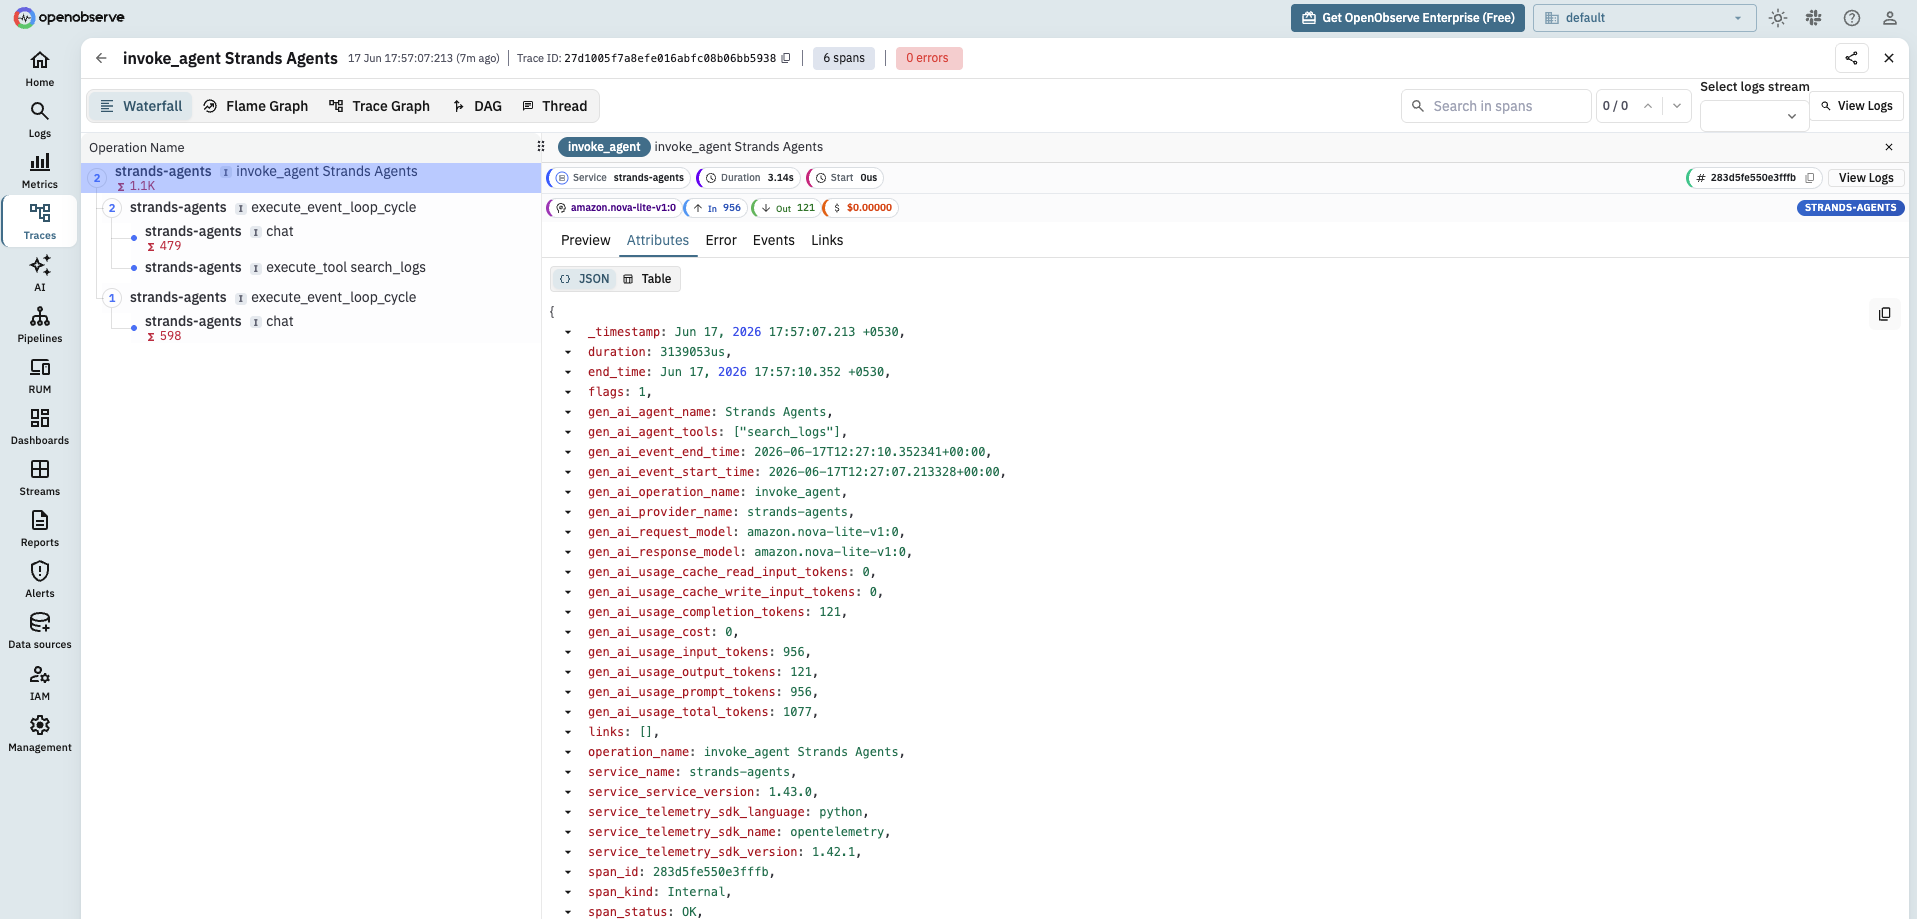
One honest inconsistency to plan for: Strands sets `gen_ai.provider.name` to `strands-agents` (the framework that emitted the span), not `aws.bedrock` (the backend the model actually ran on), while the botocore instrumentation for raw calls sets `aws.bedrock`. The model id is correct on both (`amazon.nova-lite-v1:0`), so the reliable cross-surface key is `gen_ai.request.model`, not `gen_ai.provider.name`. This is the experimental-conventions churn from the cheat sheet showing up in practice: two instrumentations, written against the spec at different points, disagree on the same field. If you want one consistent value, rewrite it server-side in an OpenObserve ingestion pipeline (`strands-agents` to `aws.bedrock`) before storage.
## From tokens to dollars: the Bedrock cost layer
Token counts are on every span, but nobody budgets in tokens. The conversion to dollars is a small amount of code you own, because pricing is yours to maintain and changes more often than any library ships.
Keep a price map keyed by Bedrock model id, with an input and an output rate per million tokens, and write the cost onto the current span right after the Bedrock response, while the span is still being recorded. That adds one attribute, `llm.cost.usd`, so every Bedrock span (direct call, agent, or AgentCore) carries its own cost.
```python
from opentelemetry import trace
# Rates are per 1M tokens. Pull current numbers from the Bedrock pricing
# page for the model ids you actually use; these are placeholders.
PRICES = {
"anthropic.claude-3-5-sonnet-20241022-v2:0": {"in": 3.00, "out": 15.00},
"amazon.nova-pro-v1:0": {"in": 0.80, "out": 3.20},
}
def record_cost(model_id, usage):
price = PRICES.get(model_id)
if not price:
return
cost = (
usage["inputTokens"] * price["in"]
+ usage["outputTokens"] * price["out"]
) / 1_000_000
trace.get_current_span().set_attribute("llm.cost.usd", round(cost, 6))
# After a Converse call, while the Bedrock span is still the current span:
record_cost("anthropic.claude-3-5-sonnet-20241022-v2:0", response["usage"])
```
The pattern, not the exact call site, is what matters: cost is derived from token counts and the model id, written once per span, and never hard-coded into the application. If you would rather compute it centrally instead of at each call, read the `gen_ai.usage.*` attributes off the span in a custom exporter (where you control a writable copy) before it ships, but the call-site approach above is the one that works with the stock SDK. Record it as a span attribute for per-call cost and, if you want aggregate counters and distributions, also emit it as a metric the way the [LLM cost monitoring](https://openobserve.ai/blog/llm-cost-monitoring/) guide lays out, with a counter for cumulative dollars and a histogram for per-call cost. Because the cost rides on the span next to `session.id` and any user id you attach, you get spend per model, per session, and per user from the same data.
A note specific to Bedrock: if you run a model on a provisioned-throughput or custom-model endpoint, per-token pricing does not describe your real cost, which is the reserved capacity. Keep those model ids out of the per-token map and track their cost separately, or you will under-count by attributing reserved capacity to token volume.
## A Bedrock cost and latency dashboard in OpenObserve
The payoff of putting all three surfaces on the same conventions is a single dashboard. Every Bedrock span carries `gen_ai.request.model`, `gen_ai.operation.name`, and now `llm.cost.usd`, so you build panels by grouping on those fields with no per-surface special casing. Group and join on `gen_ai.request.model` rather than `gen_ai.provider.name`: as the AgentCore section showed, the model id is consistent across all three surfaces while the provider name is not (unless you normalize it in a pipeline).
A useful starter layout:
- Total Bedrock spend over time, summing `llm.cost.usd`, broken out by `gen_ai.request.model` so you see which model dominates the bill.
- Spend by surface, grouping on `gen_ai.operation.name` (`chat` for direct calls, `invoke_agent` for managed agents) so you know whether agents or raw calls drive cost.
- Call latency, charting the `gen_ai.client.operation.duration` histogram per model, so a slow model is visible next to its cost.
- Token volume, charting `gen_ai.client.token.usage` split by `gen_ai.token.type`, to catch a prompt that quietly grew its input.
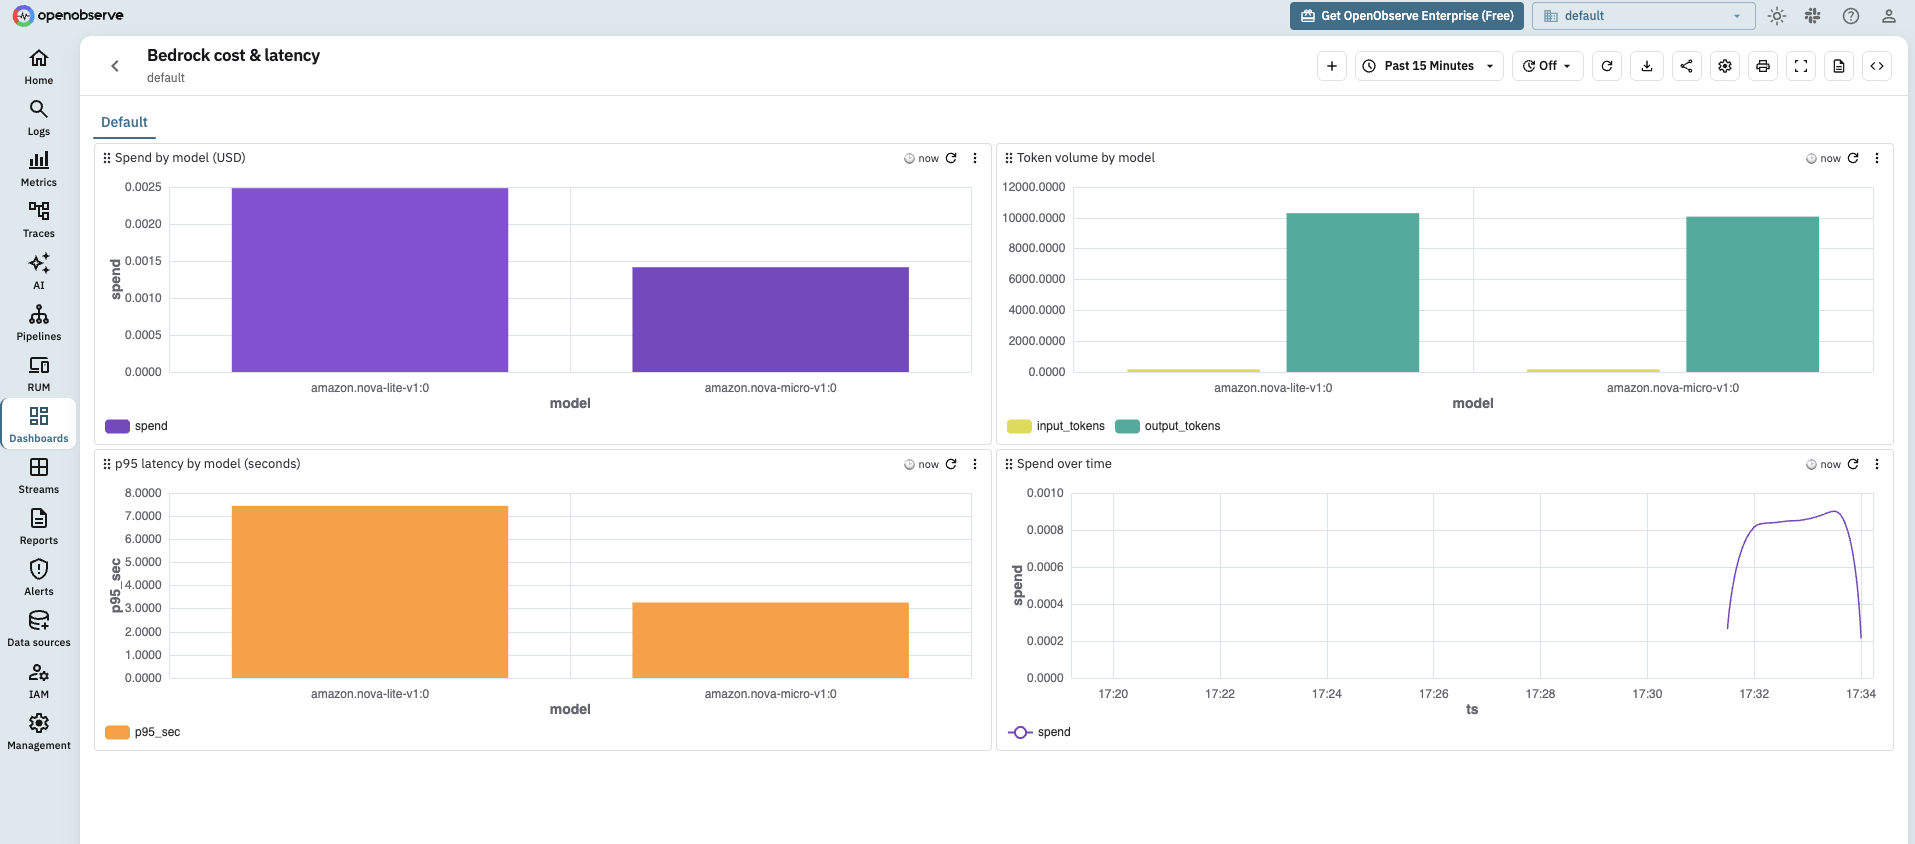
The investigation flow falls out of the shared keys. A spend spike on the cost panel filters to one model id; you pivot to traces for that model, filter by `session.id` to find the session that ran up the bill, and read its spans to see whether a runaway agent loop or an oversized prompt caused it. That pivot across signals on shared identifiers is the [logs, metrics, and traces correlation](https://openobserve.ai/blog/logs-traces-metrics-correlation/) workflow, with Bedrock's own attributes doing the joining instead of timestamps you line up by hand.
## Keeping prompts and PII out of telemetry
Bedrock telemetry is structural by default, and that is the safe default. The spans record durations, model ids, provider, token counts, and your derived cost. They do not record the prompt text or the model's output, because the GenAI conventions treat message content as sensitive and leave the content attributes (`gen_ai.input.messages`, `gen_ai.output.messages`, `gen_ai.system_instructions`) off unless you opt in.
Leave them off unless your observability pipeline is approved to store what your prompts contain, which for a support assistant is customer data. If you enable content capture in a library, for example OpenLLMetry's `TRACELOOP_TRACE_CONTENT`, do it knowing the message bodies will land in your backend. When you need a middle ground, OpenObserve ingestion pipelines can redact specific fields server-side before storage, so you can keep tool details for debugging while scrubbing the parts you cannot retain. If OpenTelemetry itself is new to you, [what is OpenTelemetry](https://openobserve.ai/blog/what-is-opentelemetry/) covers how attributes and the SDK fit together before you start turning content capture on.
## See your Bedrock spend in OpenObserve
Amazon Bedrock already emits OpenTelemetry through the botocore instrumentation and ADOT, and OpenObserve ingests those traces and metrics on one OTLP endpoint, correlates them by `session.id`, and stores them next to the rest of your infrastructure observability. You do not need a separate LLM tool or the default CloudWatch path. Set the telemetry environment variables, point them at your instance, add the small cost layer, and your Bedrock spend across direct calls, agents, and AgentCore shows up on one dashboard. For the operational side once the data is flowing, the companion guide on [monitoring AWS Bedrock](https://openobserve.ai/blog/monitoring-aws-bedrock/) covers the dashboards and alerts to build on top of it. [Start free with OpenObserve Cloud](https://openobserve.ai/) and send your first Bedrock trace in minutes.