# How to Trace LangChain and LlamaIndex Applications with OpenObserve
> Learn how to add distributed tracing to LangChain and LlamaIndex apps using OpenLLMetry and the OpenTelemetry SDK, with traces flowing into OpenObserve.
Source: https://openobserve.ai/blog/langchain-llamaindex-openobserve/
Published: 2026-04-14
Authors: Gorakhnath Yadav
Category: How To
Tags: LangChain, LlamaIndex, OpenTelemetry, OpenObserve, Tracing, Observability, LLM
---
**TL;DR:** **LangChain tracing** and LlamaIndex observability are non-negotiable once your LangChain and LlamaIndex apps grow beyond a single API call: these are multi-step pipelines (chains, retrievers, embeddings, LLM calls) and when something is slow or wrong, you need to see every step. The cleanest way to get that visibility is OpenLLMetry (auto-instrumentation) → OpenTelemetry SDK → [OpenObserve](https://openobserve.ai/) (storage and UI). You can also use the OpenObserve Python SDK, which is a wrapper on top of OpenTelemetry. In this blog, we'll learn how to do it both ways.
## Why tracing matters for LLM applications
A modern LLM app is not a single API call. A single user request might pass through an embedding model, a vector database, a retriever, a reranker, a prompt template, an LLM, an output parser, and sometimes an agent loop that calls tools along the way. When latency spikes or a response goes wrong, logs alone will not tell you where.
Tracing gives you a timeline view of the whole request. Every stage becomes a span. You see exactly which step took 4 seconds and which step returned bad data. This is the difference between "the chain was slow" and "the retriever hit a cold vector index while the LLM itself responded in 400 milliseconds."
For LangChain and LlamaIndex specifically, tracing also captures LLM-specific data you cannot get from a generic APM tool: prompt tokens, completion tokens, model name, temperature, full prompt and response content. This is what lets you track cost per request, debug prompt regressions, and alert on runaway token usage. For example, when an agent bloats the context window, traces show token usage at each step, helping you pinpoint which caused the context to grew unexpectedly. For a broader introduction to the concepts behind this, see [Distributed Tracing: Basics to Beyond](https://openobserve.ai/blog/distributed-tracing-basics-to-beyond-guide/).
## How to add distributed tracing to LangChain and LlamaIndex?
You add distributed tracing to LangChain and LlamaIndex by installing OpenLLMetry's auto-instrumentation packages, initializing the OpenTelemetry SDK to export traces via OTLP, and pointing that exporter at an OTLP-compatible backend like OpenObserve. The framework code does not change. Two lines of initialization code capture every chain execution, retrieval, and LLM call as an OpenTelemetry span.
This works because LangChain exposes a callback system and LlamaIndex exposes a dispatcher hierarchy. Both are designed so external tools can observe execution without modifying application code. OpenLLMetry hooks into these systems and emits OpenTelemetry spans automatically.
## The architecture: how the pieces fit together
The full observability pipeline has four layers:
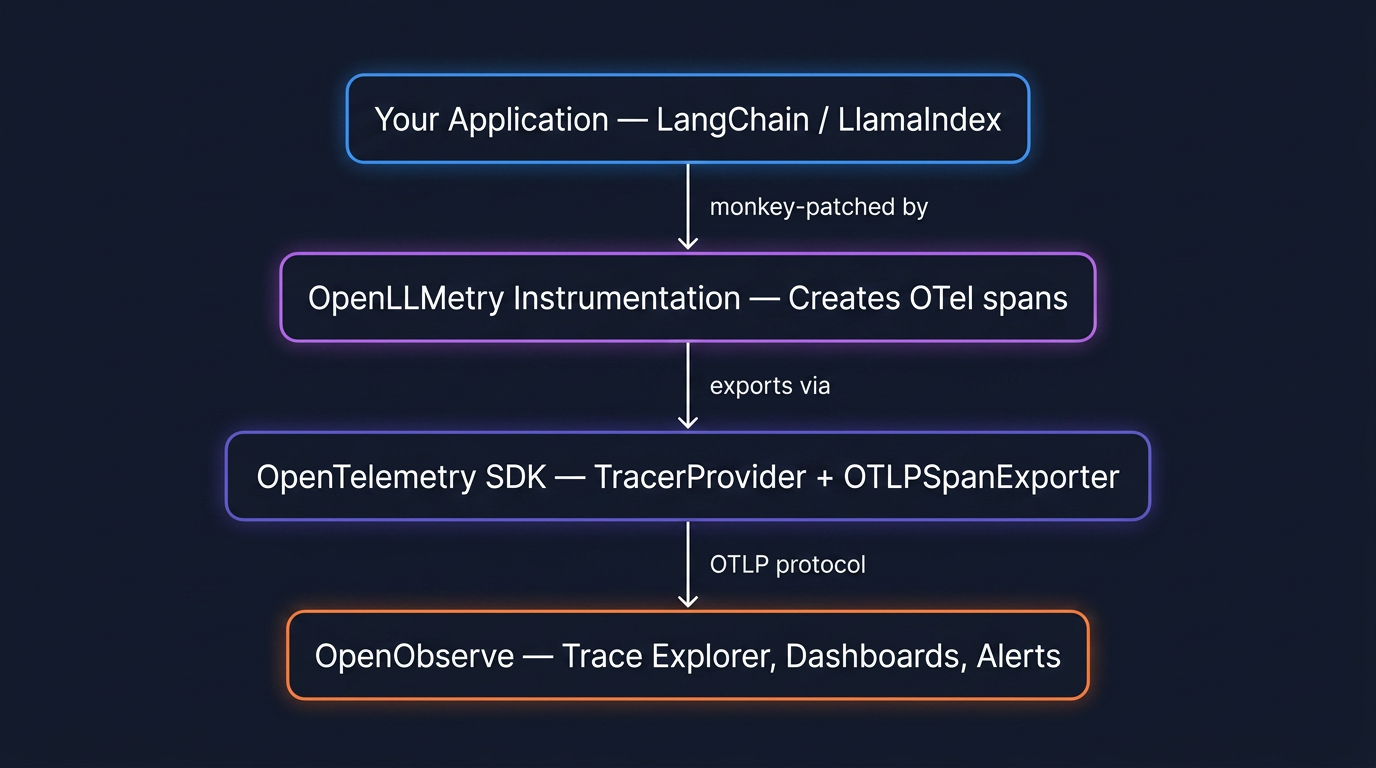
Nothing in layer 1 changes. Your LangChain code stays the same. Layers 2, 3, and 4 are the tracing infrastructure, and you wire them up once at application startup.
### Layer 2: OpenLLMetry (the instrumentation layer)
OpenLLMetry is an open source project that provides OpenTelemetry instrumentation for LLM frameworks. It ships separate packages for each framework, and each package monkey-patches the relevant classes to wrap execution in OpenTelemetry spans.
| Package | What it instruments |
| ---------------------------------------------------------------------------------------------------------------- | -------------------------------------------------------- |
| `opentelemetry-instrumentation-langchain` | LangChain Runnables, LCEL chains, agents, tools |
| `opentelemetry-instrumentation-llamaindex` | LlamaIndex query engines, retrievers, response synthesis |
You can combine packages. A RAG chain built in LangChain that calls OpenAI will produce nested spans from both instrumentors: the LangChain spans wrap the OpenAI spans, preserving the parent-child relationship in the trace.
### Layer 3: The OpenTelemetry SDK
The OpenTelemetry SDK takes the spans created by the instrumentation layer and exports them. You configure a `TracerProvider`, attach a `BatchSpanProcessor` (which batches spans for efficient network transmission), and set an `OTLPSpanExporter` that points at your backend's OTLP endpoint.
OpenObserve publishes a thin wrapper called `openobserve-python-sdk` that pre-configures all of this for you. Both options produce identical output: the wrapper just removes boilerplate for teams starting fresh.
### Layer 4: OpenObserve (the backend)
OpenObserve receives traces on its native OTLP endpoint, stores them in Parquet columnar format, and renders them in a trace explorer with waterfall views and span detail panels. Because it is OpenTelemetry-native, the same platform handles your infrastructure traces, logs, and metrics. You do not need a separate tool for LLM observability.
## How LangChain setup works
LangChain is built on the **Runnable protocol**. Every component (prompt templates, LLM wrappers, retrievers, output parsers) implements the same interface: `invoke`, `stream`, `batch`, and their async variants. When you compose components with the pipe operator, LangChain constructs a `RunnableSequence` or `RunnableParallel` under the hood.
A typical RAG chain looks like this:
```python
rag_chain = (
RunnableParallel(
context=retriever | format_docs,
question=RunnablePassthrough()
)
| qa_prompt
| llm
| StrOutputParser()
)
```
When you call `rag_chain.invoke("What is X?")`, LangChain fires callback events at each stage of execution: `on_chain_start`, `on_retriever_start`, `on_retriever_end`, `on_llm_start`, `on_llm_end`, `on_chain_end`. This callback system is the hook that makes tracing possible.
OpenLLMetry's `LangchainInstrumentor` subscribes to these events and creates an OpenTelemetry span for each one. The result is a trace that mirrors the actual execution tree:
```
[SPAN: RunnableSequence] ← root span
├── [SPAN: RunnableParallel]
│ ├── [SPAN: Retriever] ← runs in parallel
│ │ ├── [SPAN: Embedding] ← encode query to vector
│ │ └── [SPAN: VectorStore] ← similarity search
│ └── [SPAN: RunnablePassthrough]
├── [SPAN: ChatPromptTemplate]
└── [SPAN: ChatOpenAI]
├── prompt_tokens: 1,247
├── completion_tokens: 312
└── duration: 1.8s
```
Each span carries the timing, the input, the output, and LLM-specific attributes where relevant. In OpenObserve's trace explorer, this renders as a waterfall diagram where you can instantly see which step was the bottleneck.
## How LlamaIndex setup works
LlamaIndex is organized around a data pipeline: documents are ingested, split into nodes, embedded, and stored in a vector index. A query engine then retrieves relevant nodes and synthesizes a response via an LLM.
The simplest usage hides all of this:
```python
index = VectorStoreIndex.from_documents(documents)
response = index.as_query_engine().query("What is X?")
```
Internally, `.query()` triggers a multi-step pipeline: the query is embedded, a vector search retrieves top-k nodes, those nodes are passed to a `ResponseSynthesizer` along with the original query, and the synthesizer calls the LLM to produce the final response.
LlamaIndex has its own instrumentation system based on **dispatchers** (introduced in v0.10.20, replacing the older callback system). Each module has a dispatcher that emits events and span signals. Dispatchers form a hierarchy similar to Python's logging module, propagating events up to the root dispatcher.
OpenLLMetry's `opentelemetry-instrumentation-llamaindex` plugs into this dispatcher system and wraps key operations in OpenTelemetry spans:
```
[SPAN: QueryEngine.query] ← root span
├── [SPAN: Retriever.retrieve]
│ ├── [SPAN: Embedding] ← get_query_embedding
│ └── [SPAN: VectorStore.query] ← top_k similarity search
└── [SPAN: ResponseSynthesizer]
└── [SPAN: LLM.chat]
├── model: gpt-4o
├── prompt_tokens: 1,891
└── completion_tokens: 274
```
The abstractions differ from LangChain, but the traced output is structurally the same: nested spans with timing and LLM attributes, rendered as a waterfall in OpenObserve.
## Instrumenting LangChain and LlamaIndex
There are two ways to wire up the OpenTelemetry SDK for either framework. Which one you choose depends on whether your application already uses OpenTelemetry.
**Choose Path A** if this is your first time setting up OpenTelemetry. It is the fastest way to get traces flowing.
**Choose Path B** if you already have `opentelemetry-sdk` in your dependencies and an existing `TracerProvider`. It plugs LLM instrumentation into your existing setup without conflicts.
The traces that land in OpenObserve are identical in either case, and across both frameworks.
### Prerequisites
For both paths and both frameworks you need:
- Python 3.8 or later
- An [OpenObserve account](https://cloud.openobserve.ai/web/signup) (cloud or [self-hosted](https://openobserve.ai/docs/getting-started/))
- Your OpenObserve organization ID
- A Base64-encoded auth token: `echo -n "you@example.com:yourpassword" | base64`
### Path A: The OpenObserve SDK wrapper (quickstart)
Install the packages for your framework:
**LangChain:**
```bash
pip install openobserve-python-sdk \
opentelemetry-instrumentation-langchain \
opentelemetry-instrumentation-openai \
langchain langchain-openai langchain-community \
faiss-cpu python-dotenv
```
**LlamaIndex:**
```bash
pip install openobserve-telemetry-sdk \
opentelemetry-instrumentation-llamaindex \
opentelemetry-instrumentation-openai \
llama-index python-dotenv
```
Create a `.env` file (same for both frameworks):
```
OPENOBSERVE_URL=https://api.openobserve.ai/
OPENOBSERVE_ORG=your_org_slug
OPENOBSERVE_AUTH_TOKEN="Basic "
OPENAI_API_KEY=sk-...
```
**LangChain** (`app.py`):
```python
from dotenv import load_dotenv
load_dotenv()
# Instrument BEFORE importing LangChain modules
from opentelemetry.instrumentation.langchain import LangchainInstrumentor
from opentelemetry.instrumentation.openai import OpenAIInstrumentor
from openobserve import openobserve_init
LangchainInstrumentor().instrument()
OpenAIInstrumentor().instrument()
openobserve_init()
# Now build and run your chain
from langchain_openai import ChatOpenAI, OpenAIEmbeddings
from langchain_community.vectorstores import FAISS
from langchain_core.prompts import ChatPromptTemplate
from langchain_core.runnables import RunnablePassthrough, RunnableParallel
from langchain_core.output_parsers import StrOutputParser
docs = [
"OpenObserve stores trace data in Parquet columnar format.",
"OpenObserve is built in Rust and supports OTLP ingestion.",
"OpenObserve provides a SQL query engine for traces and logs.",
]
vectorstore = FAISS.from_texts(docs, OpenAIEmbeddings())
retriever = vectorstore.as_retriever()
prompt = ChatPromptTemplate.from_template(
"Answer based on this context:\n{context}\n\nQuestion: {question}"
)
llm = ChatOpenAI(model="gpt-4o-mini")
chain = (
RunnableParallel(context=retriever, question=RunnablePassthrough())
| prompt
| llm
| StrOutputParser()
)
result = chain.invoke("What format does OpenObserve use for storage?")
print(result)
```
**LlamaIndex** (`app.py`):
```python
from dotenv import load_dotenv
load_dotenv()
# Instrument BEFORE importing LlamaIndex modules
from opentelemetry.instrumentation.llamaindex import LlamaIndexInstrumentor
from opentelemetry.instrumentation.openai import OpenAIInstrumentor
from openobserve import openobserve_init
LlamaIndexInstrumentor().instrument()
OpenAIInstrumentor().instrument()
openobserve_init()
from llama_index.core import VectorStoreIndex, Document
docs = [
Document(text="OpenObserve stores trace data in Parquet columnar format."),
Document(text="OpenObserve is built in Rust and supports OTLP ingestion."),
Document(text="OpenObserve provides a SQL query engine for traces and logs."),
]
index = VectorStoreIndex.from_documents(docs)
response = index.as_query_engine().query("What format does OpenObserve use?")
print(response)
```
Run it, wait a few seconds for the batch processor to flush, and your traces appear in the OpenObserve UI under **Traces**.
### Path B: Standard OpenTelemetry SDK (existing OTel users)
Install the standard OpenTelemetry packages for your framework:
**LangChain:**
```bash
pip install opentelemetry-sdk \
opentelemetry-exporter-otlp-proto-http \
opentelemetry-instrumentation-langchain \
opentelemetry-instrumentation-openai \
langchain langchain-openai langchain-community \
faiss-cpu python-dotenv
```
**LlamaIndex:**
```bash
pip install opentelemetry-sdk \
opentelemetry-exporter-otlp-proto-http \
opentelemetry-instrumentation-llamaindex \
opentelemetry-instrumentation-openai \
llama-index python-dotenv
```
Create a `.env` file (same for both frameworks):
```
OTEL_EXPORTER_OTLP_ENDPOINT=https://api.openobserve.ai/api/your_org_slug/v1/traces
OTEL_EXPORTER_OTLP_HEADERS=Authorization=Basic ,stream-name=default
OPENAI_API_KEY=sk-...
```
The SDK setup is identical for both frameworks. Configure it first:
```python
from dotenv import load_dotenv
load_dotenv()
from opentelemetry import trace
from opentelemetry.sdk.trace import TracerProvider
from opentelemetry.sdk.trace.export import BatchSpanProcessor
from opentelemetry.sdk.resources import Resource
from opentelemetry.exporter.otlp.proto.http.trace_exporter import OTLPSpanExporter
resource = Resource.create({
"service.name": "my-llm-app",
"service.version": "0.1.0",
"deployment.environment": "dev",
})
provider = TracerProvider(resource=resource)
exporter = OTLPSpanExporter()
provider.add_span_processor(BatchSpanProcessor(exporter))
trace.set_tracer_provider(provider)
```
Then add the instrumentor for your framework:
**LangChain:**
```python
from opentelemetry.instrumentation.langchain import LangchainInstrumentor
from opentelemetry.instrumentation.openai import OpenAIInstrumentor
LangchainInstrumentor().instrument()
OpenAIInstrumentor().instrument()
# Your chain code here
```
**LlamaIndex:**
```python
from opentelemetry.instrumentation.llamaindex import LlamaIndexInstrumentor
from opentelemetry.instrumentation.openai import OpenAIInstrumentor
LlamaIndexInstrumentor().instrument()
OpenAIInstrumentor().instrument()
# Your index code here
```
Two things to watch for: instrument **before** you import framework classes that will be traced, and give the `BatchSpanProcessor` a few seconds to flush before your script exits. If traces are not appearing, add a `ConsoleSpanExporter` alongside the OTLP exporter to verify spans are being created locally.
## What gets captured: gen_ai.\* attributes
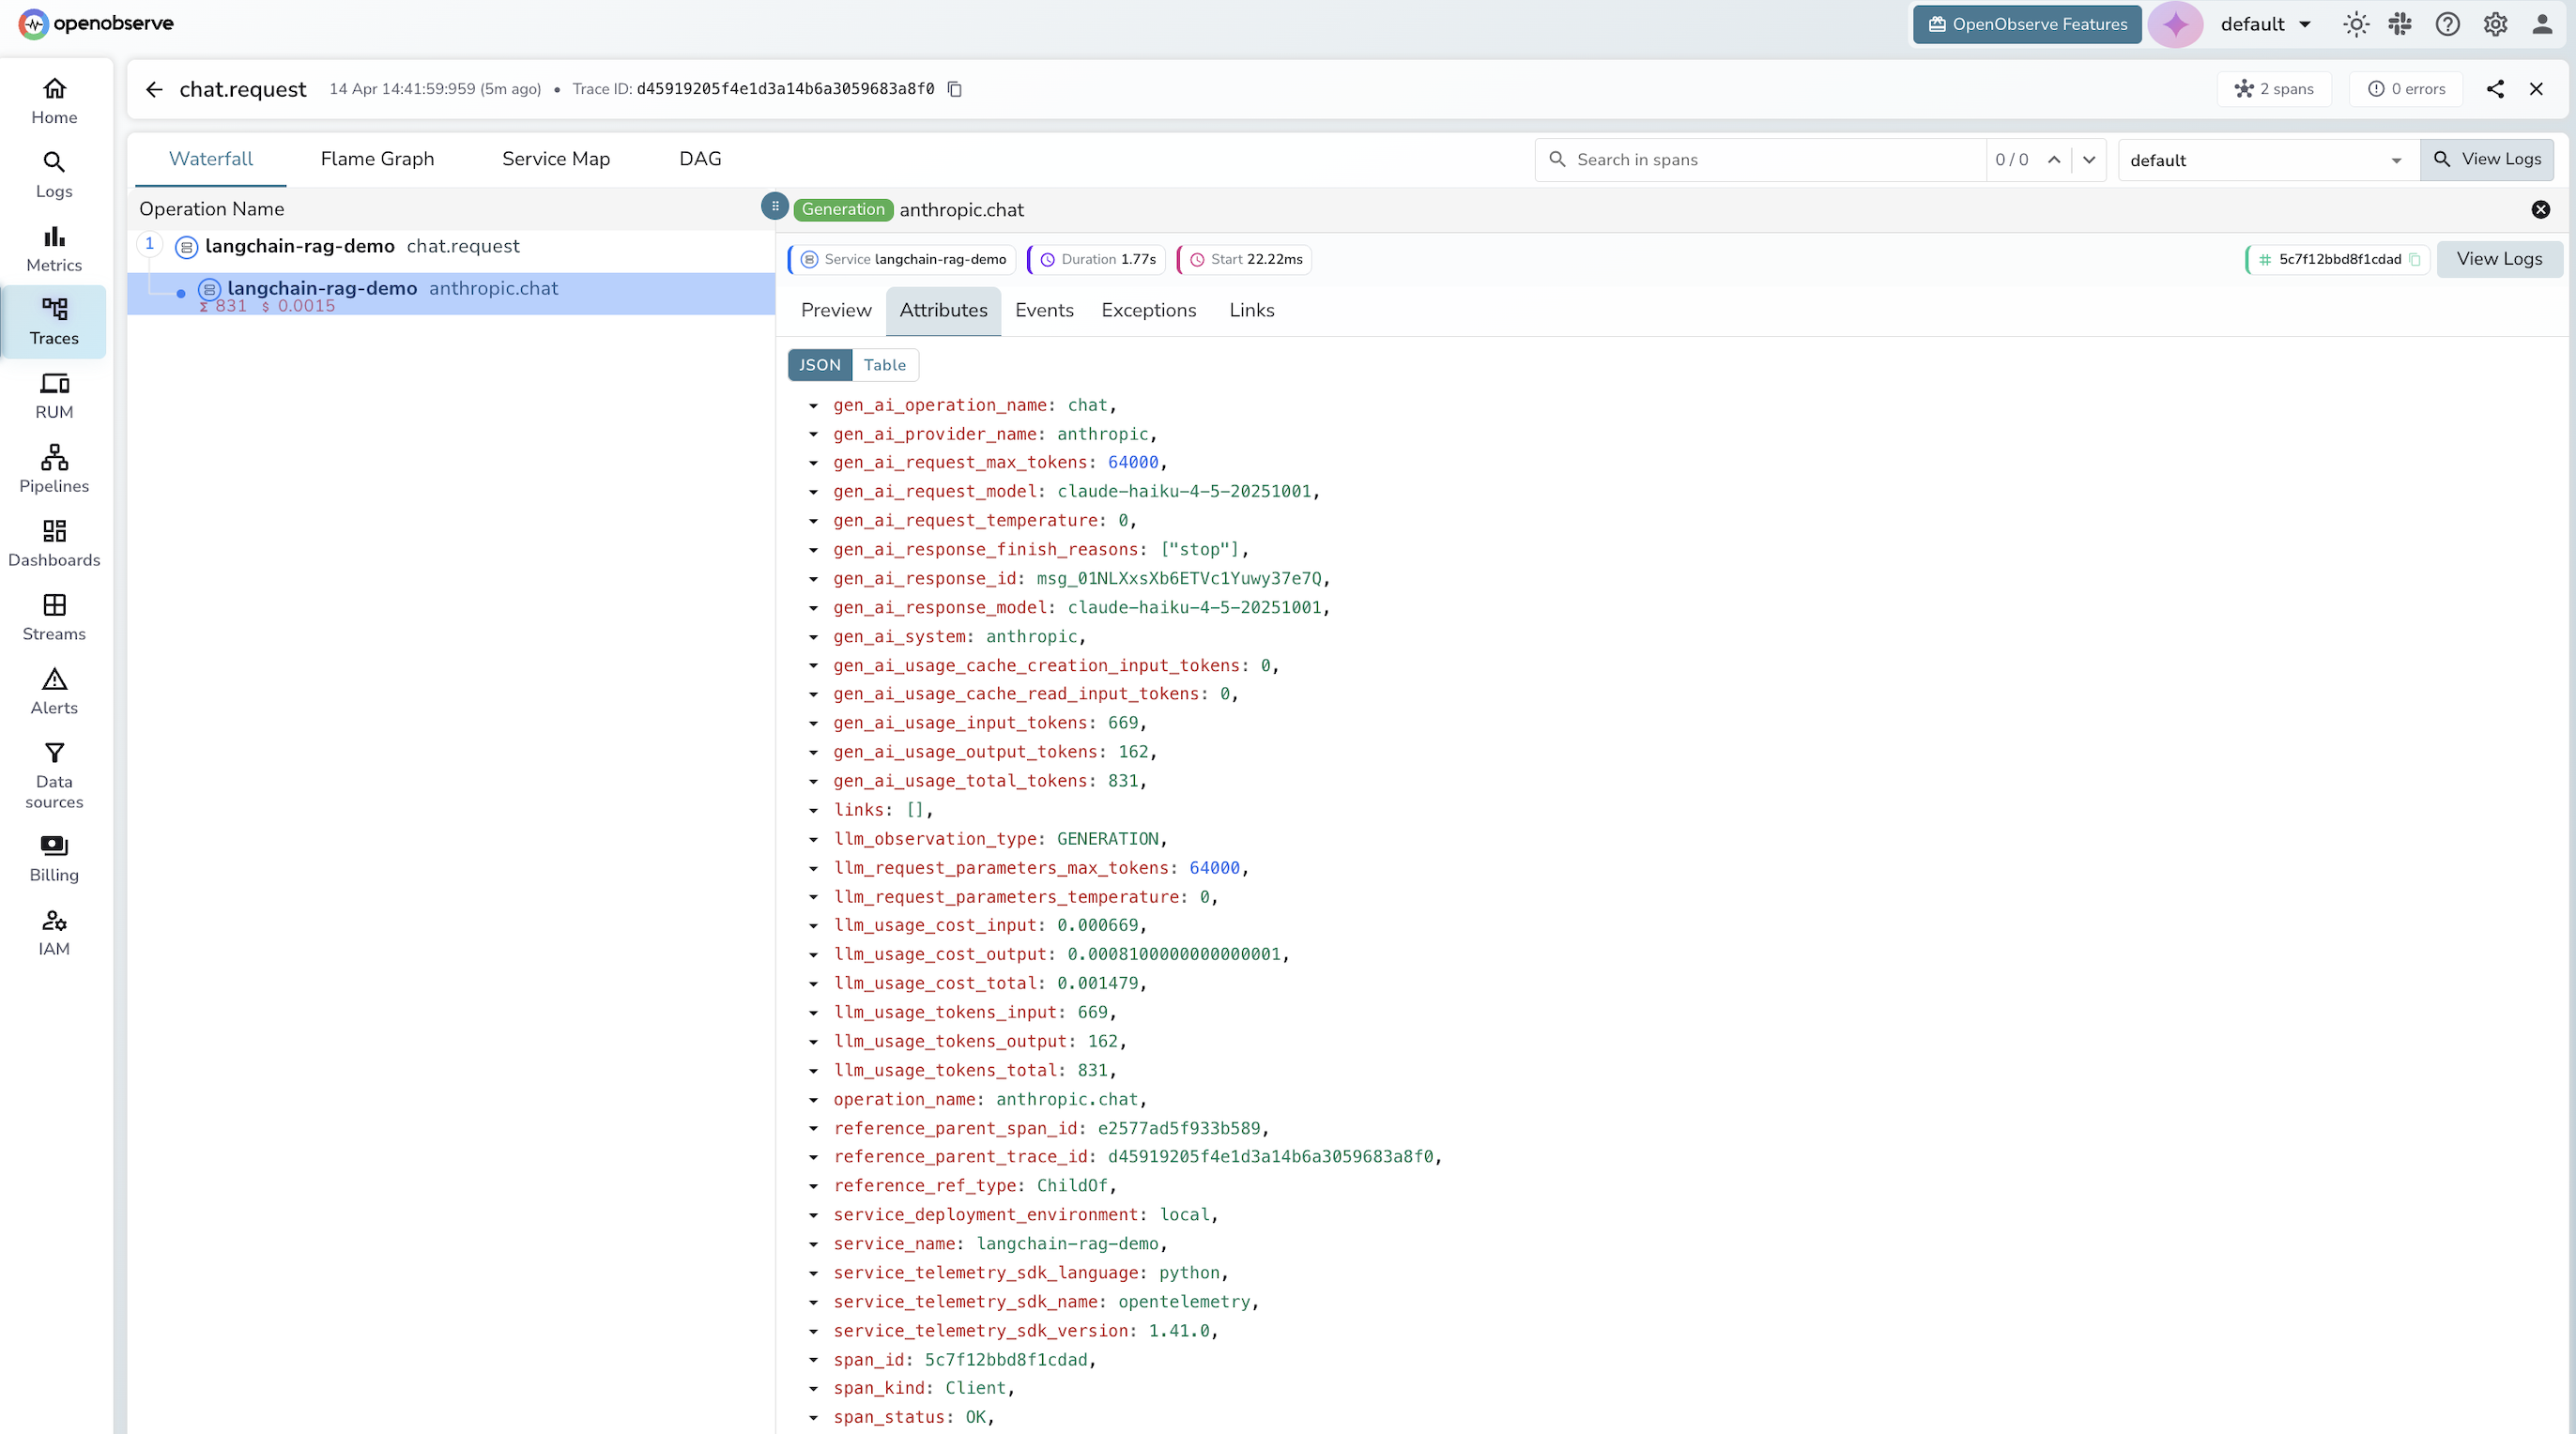
Every LLM call traced through OpenLLMetry attaches OpenTelemetry Semantic Conventions for Generative AI to the span. These are standardized attribute names (`gen_ai.*`) that any OpenTelemetry-compatible backend can parse.
| Attribute | Type | Example |
| -------------------------------- | ------ | -------------------- |
| `gen_ai.system` | string | `openai` |
| `gen_ai.request.model` | string | `gpt-4o` |
| `gen_ai.request.temperature` | float | `0.7` |
| `gen_ai.request.max_tokens` | int | `4096` |
| `gen_ai.usage.prompt_tokens` | int | `1247` |
| `gen_ai.usage.completion_tokens` | int | `312` |
| `gen_ai.usage.total_tokens` | int | `1559` |
| `gen_ai.prompt.0.content` | string | _full prompt text_ |
| `gen_ai.completion.0.content` | string | _full response text_ |
The `gen_ai` namespace is the OpenTelemetry semantic convention for generative AI, the same standardization approach used for HTTP spans (`http.*`) and database spans (`db.*`). Because OpenObserve is OpenTelemetry-native, it picks these up automatically and makes them queryable as structured fields.
**A note on PII:** By default, OpenLLMetry captures full prompt and completion content as span attributes. For production, either disable content capture with `TRACELOOP_TRACE_CONTENT=false`, or use [OpenObserve pipelines](https://openobserve.ai/docs/user-guide/data-exploration/traces/traces/) to redact sensitive fields on ingestion, for example using regex patterns to strip email addresses, phone numbers, or API keys from prompt content before the data lands in storage.
## Exploring your traces in OpenObserve
Once traces are flowing, open OpenObserve and go to **Traces** in the left sidebar. You will see:
**A trace list** filtered by service name, showing each chain or query execution with its total duration, status, and span count.
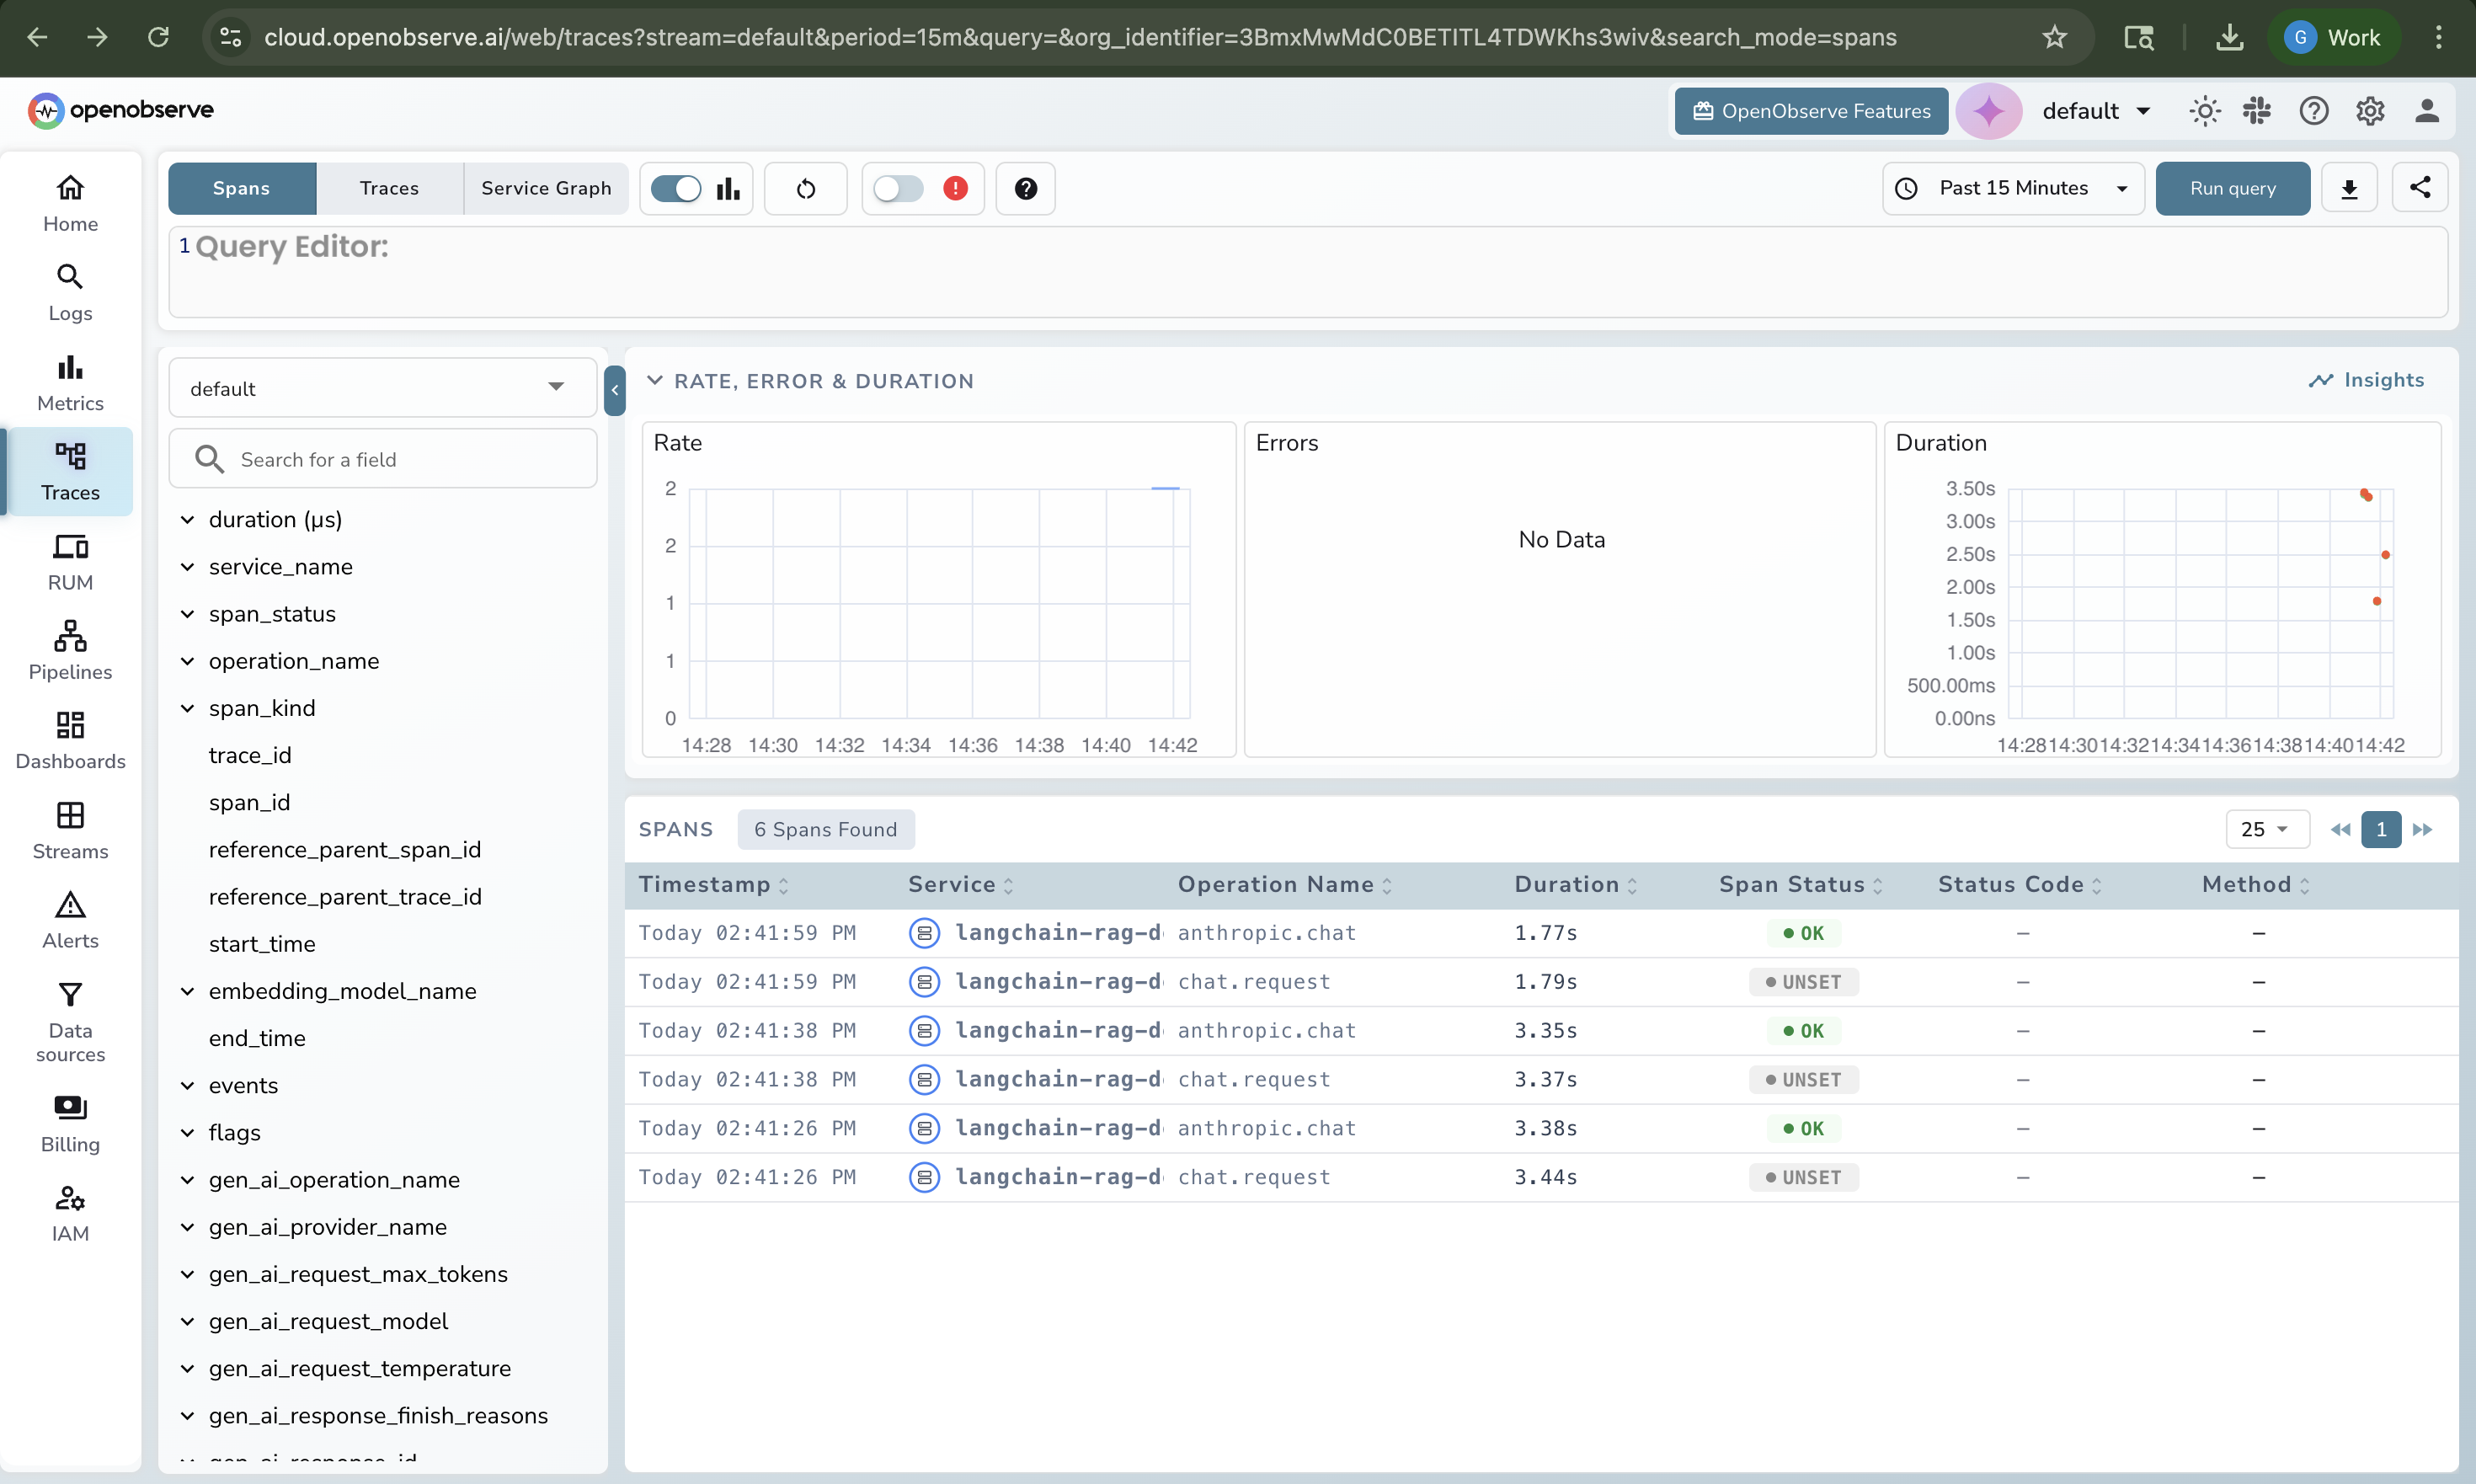
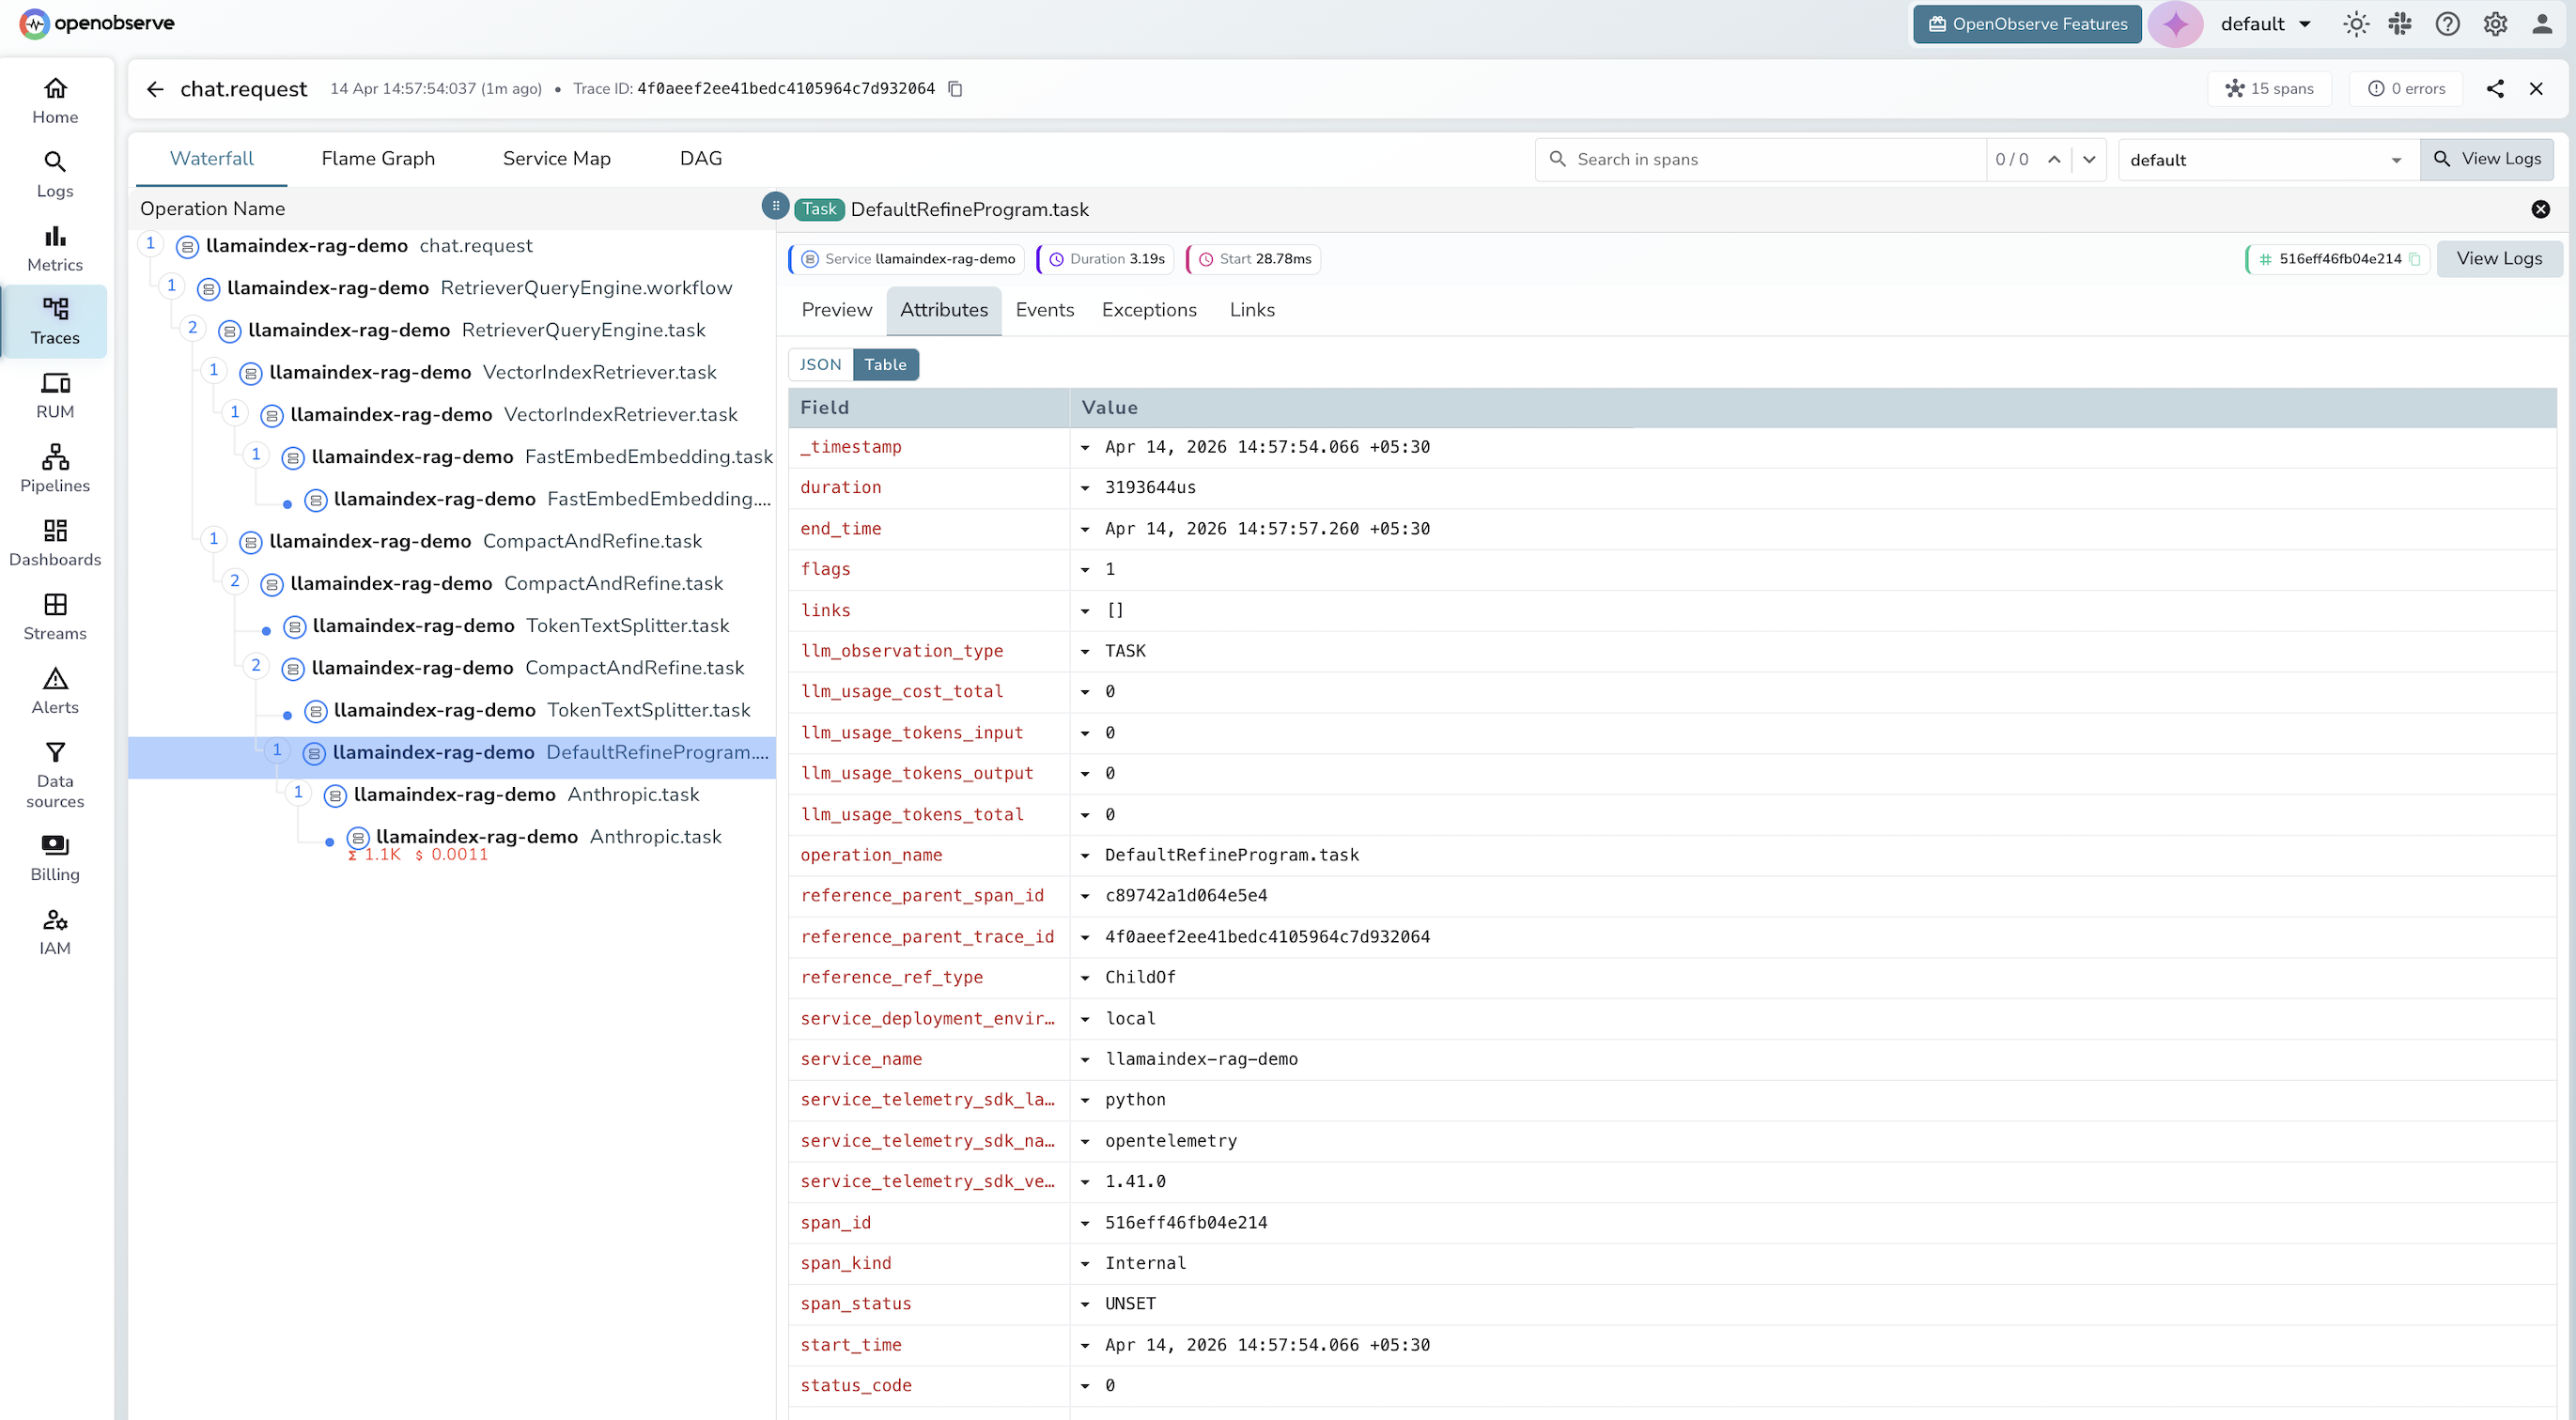
**A waterfall view** when you click a trace, showing every span in parent-child hierarchy with its duration. This is where you spot the bottleneck: the retriever that took 3 seconds while the LLM took 400 milliseconds.
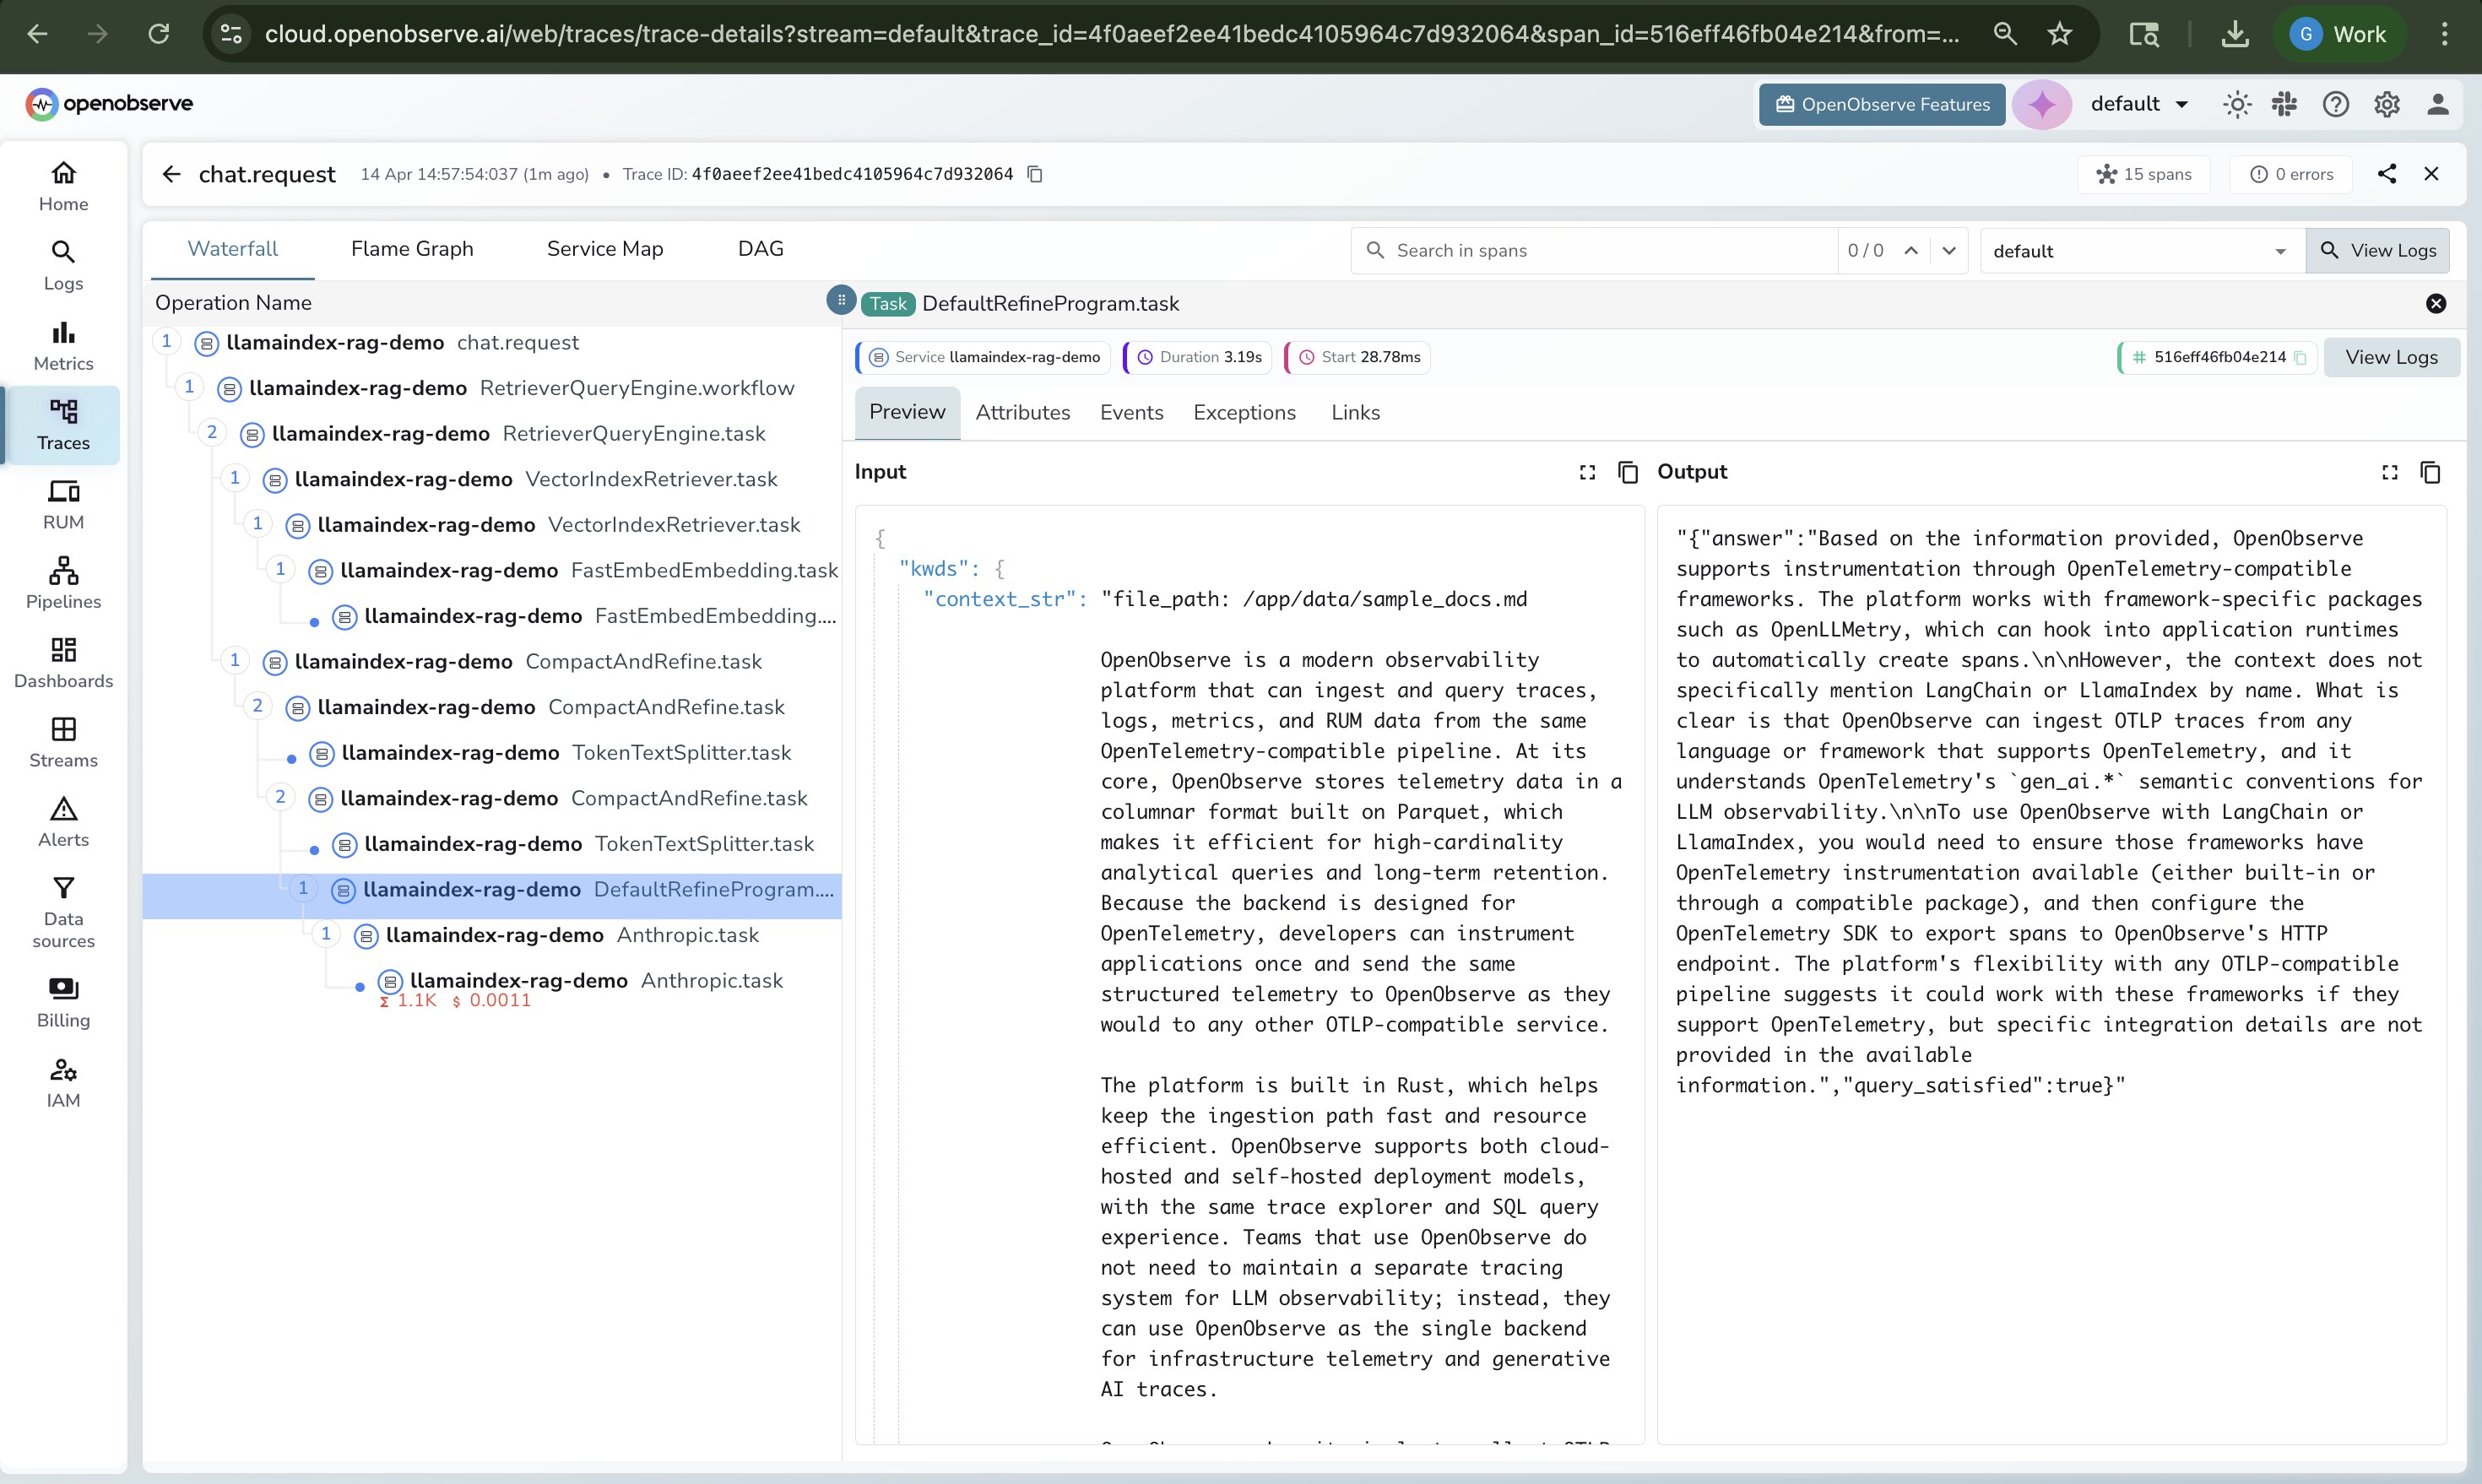
**Span detail panels** when you click a span, exposing the full set of `gen_ai.*` attributes: model name, token counts, prompt content, response content.
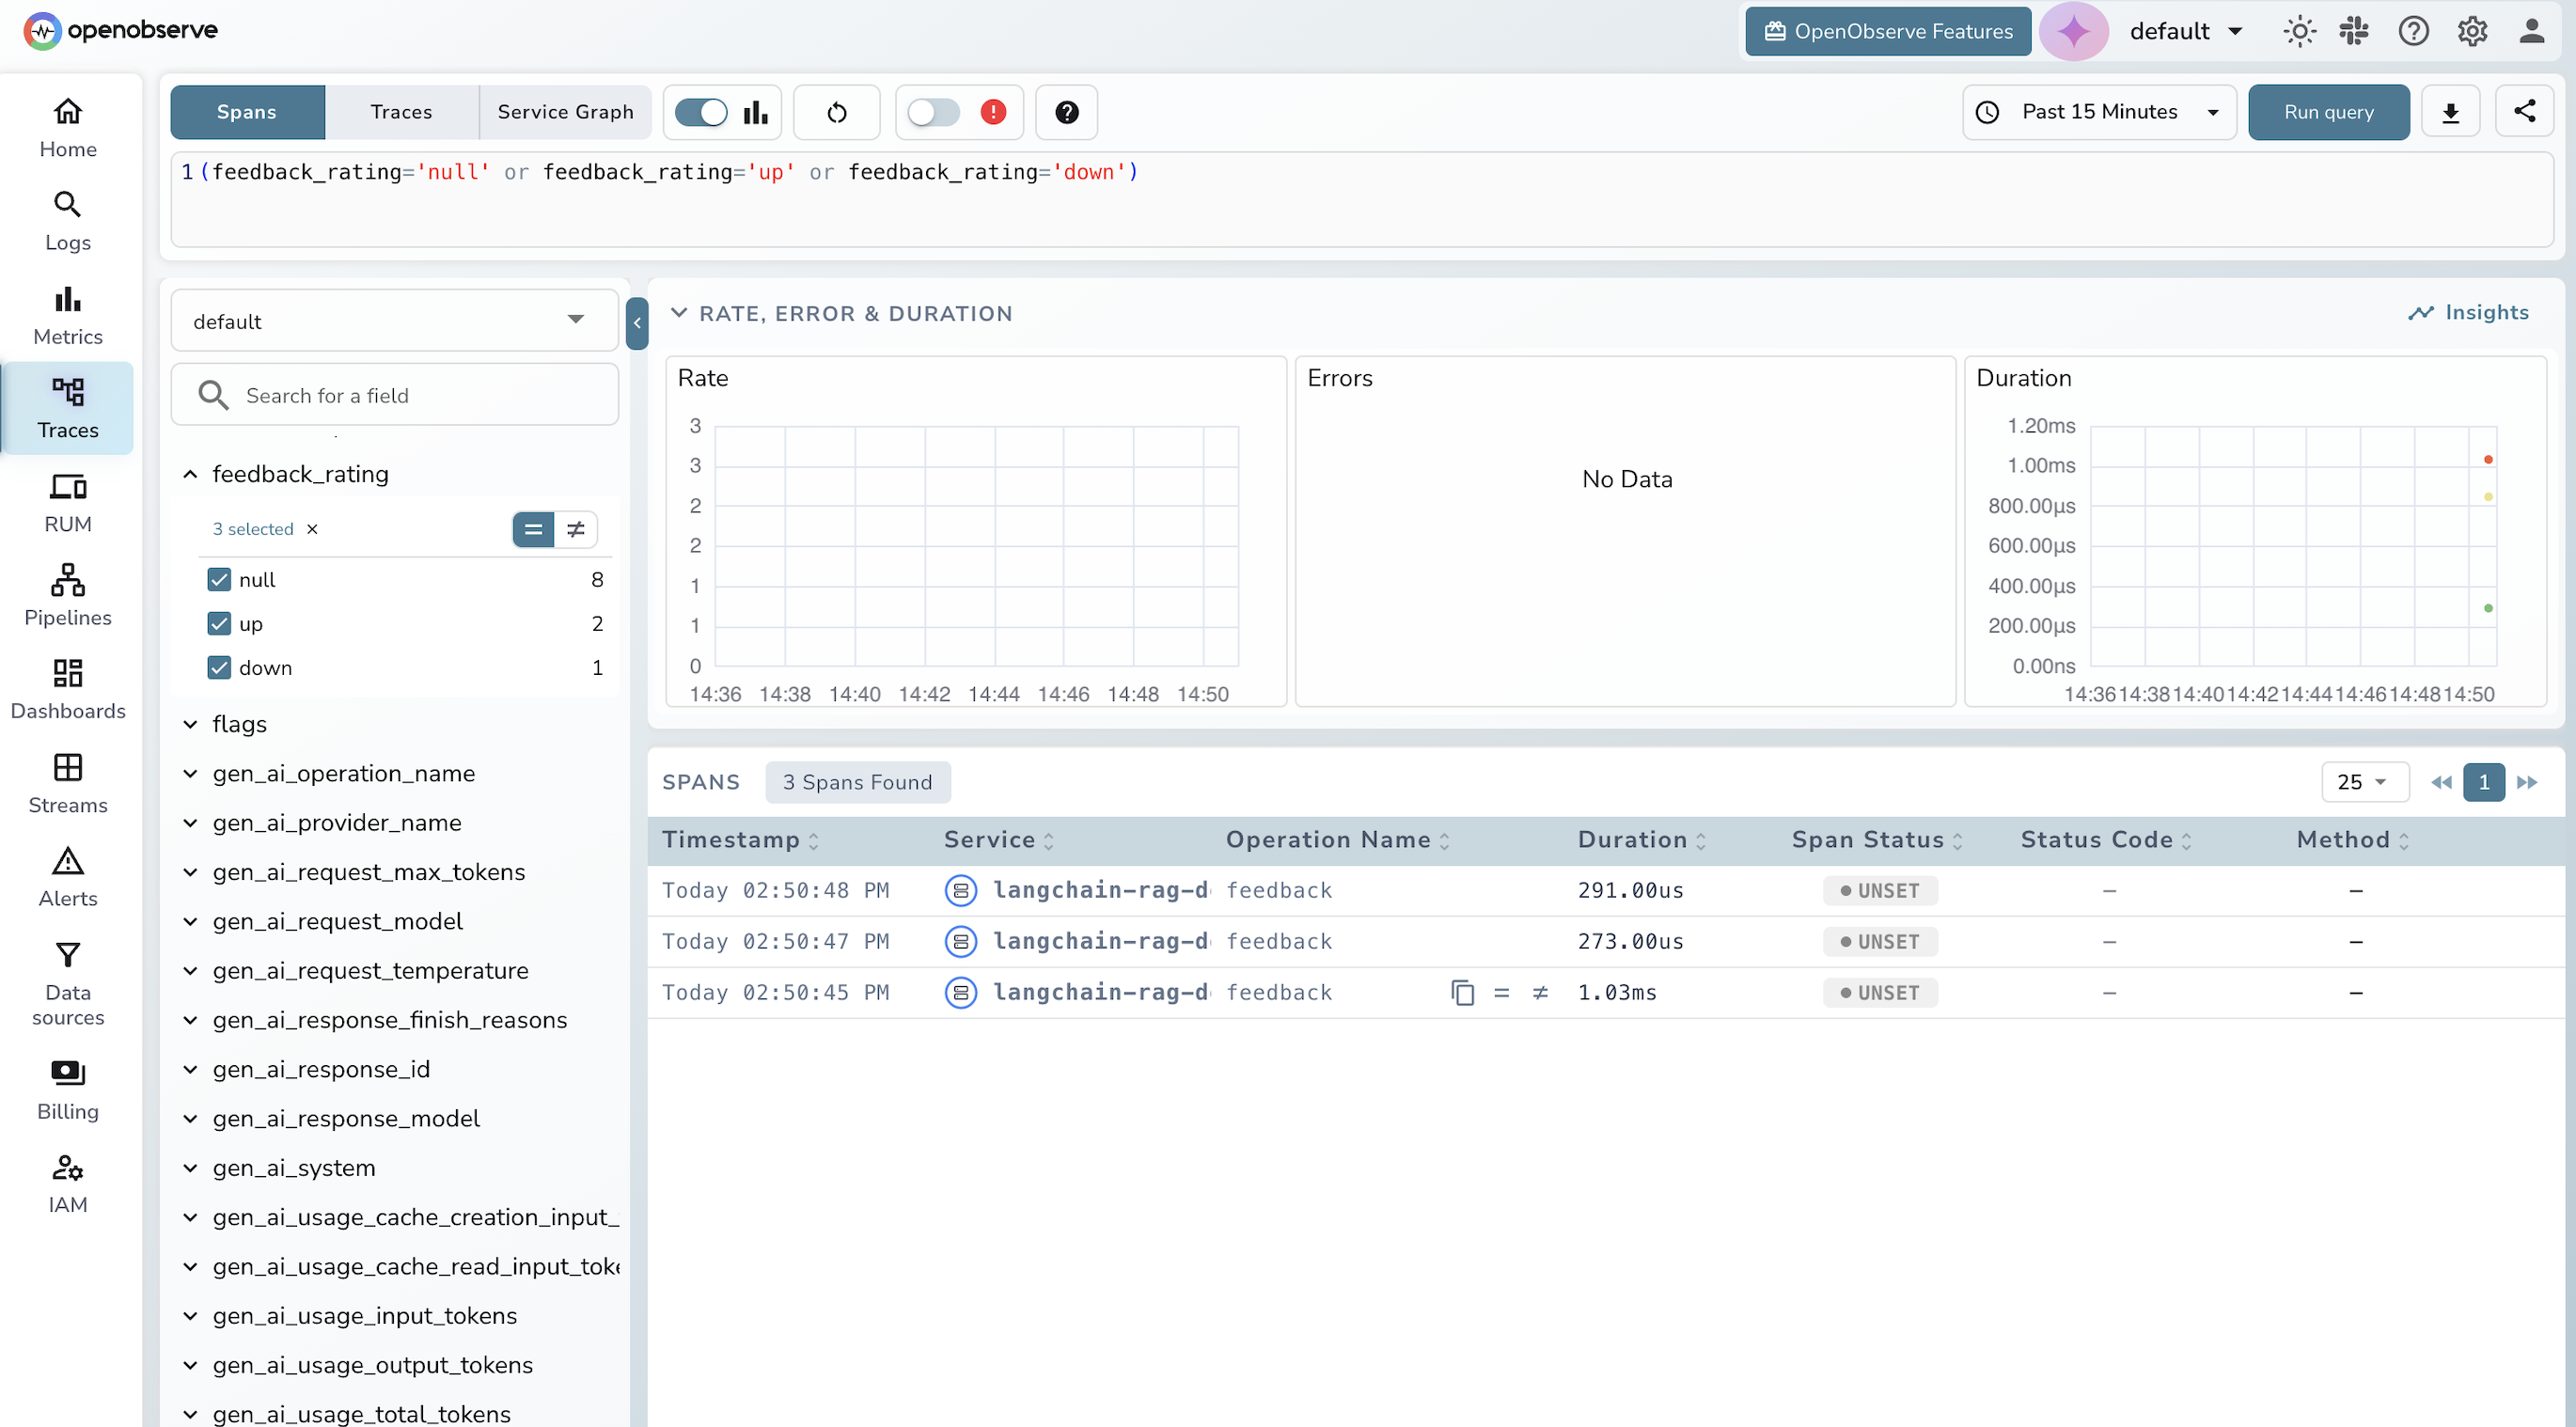
**Feedback spans** let you correlate user feedback with specific trace IDs, so you can link a thumbs-down rating back to the exact retrieval or LLM call that produced a bad response.
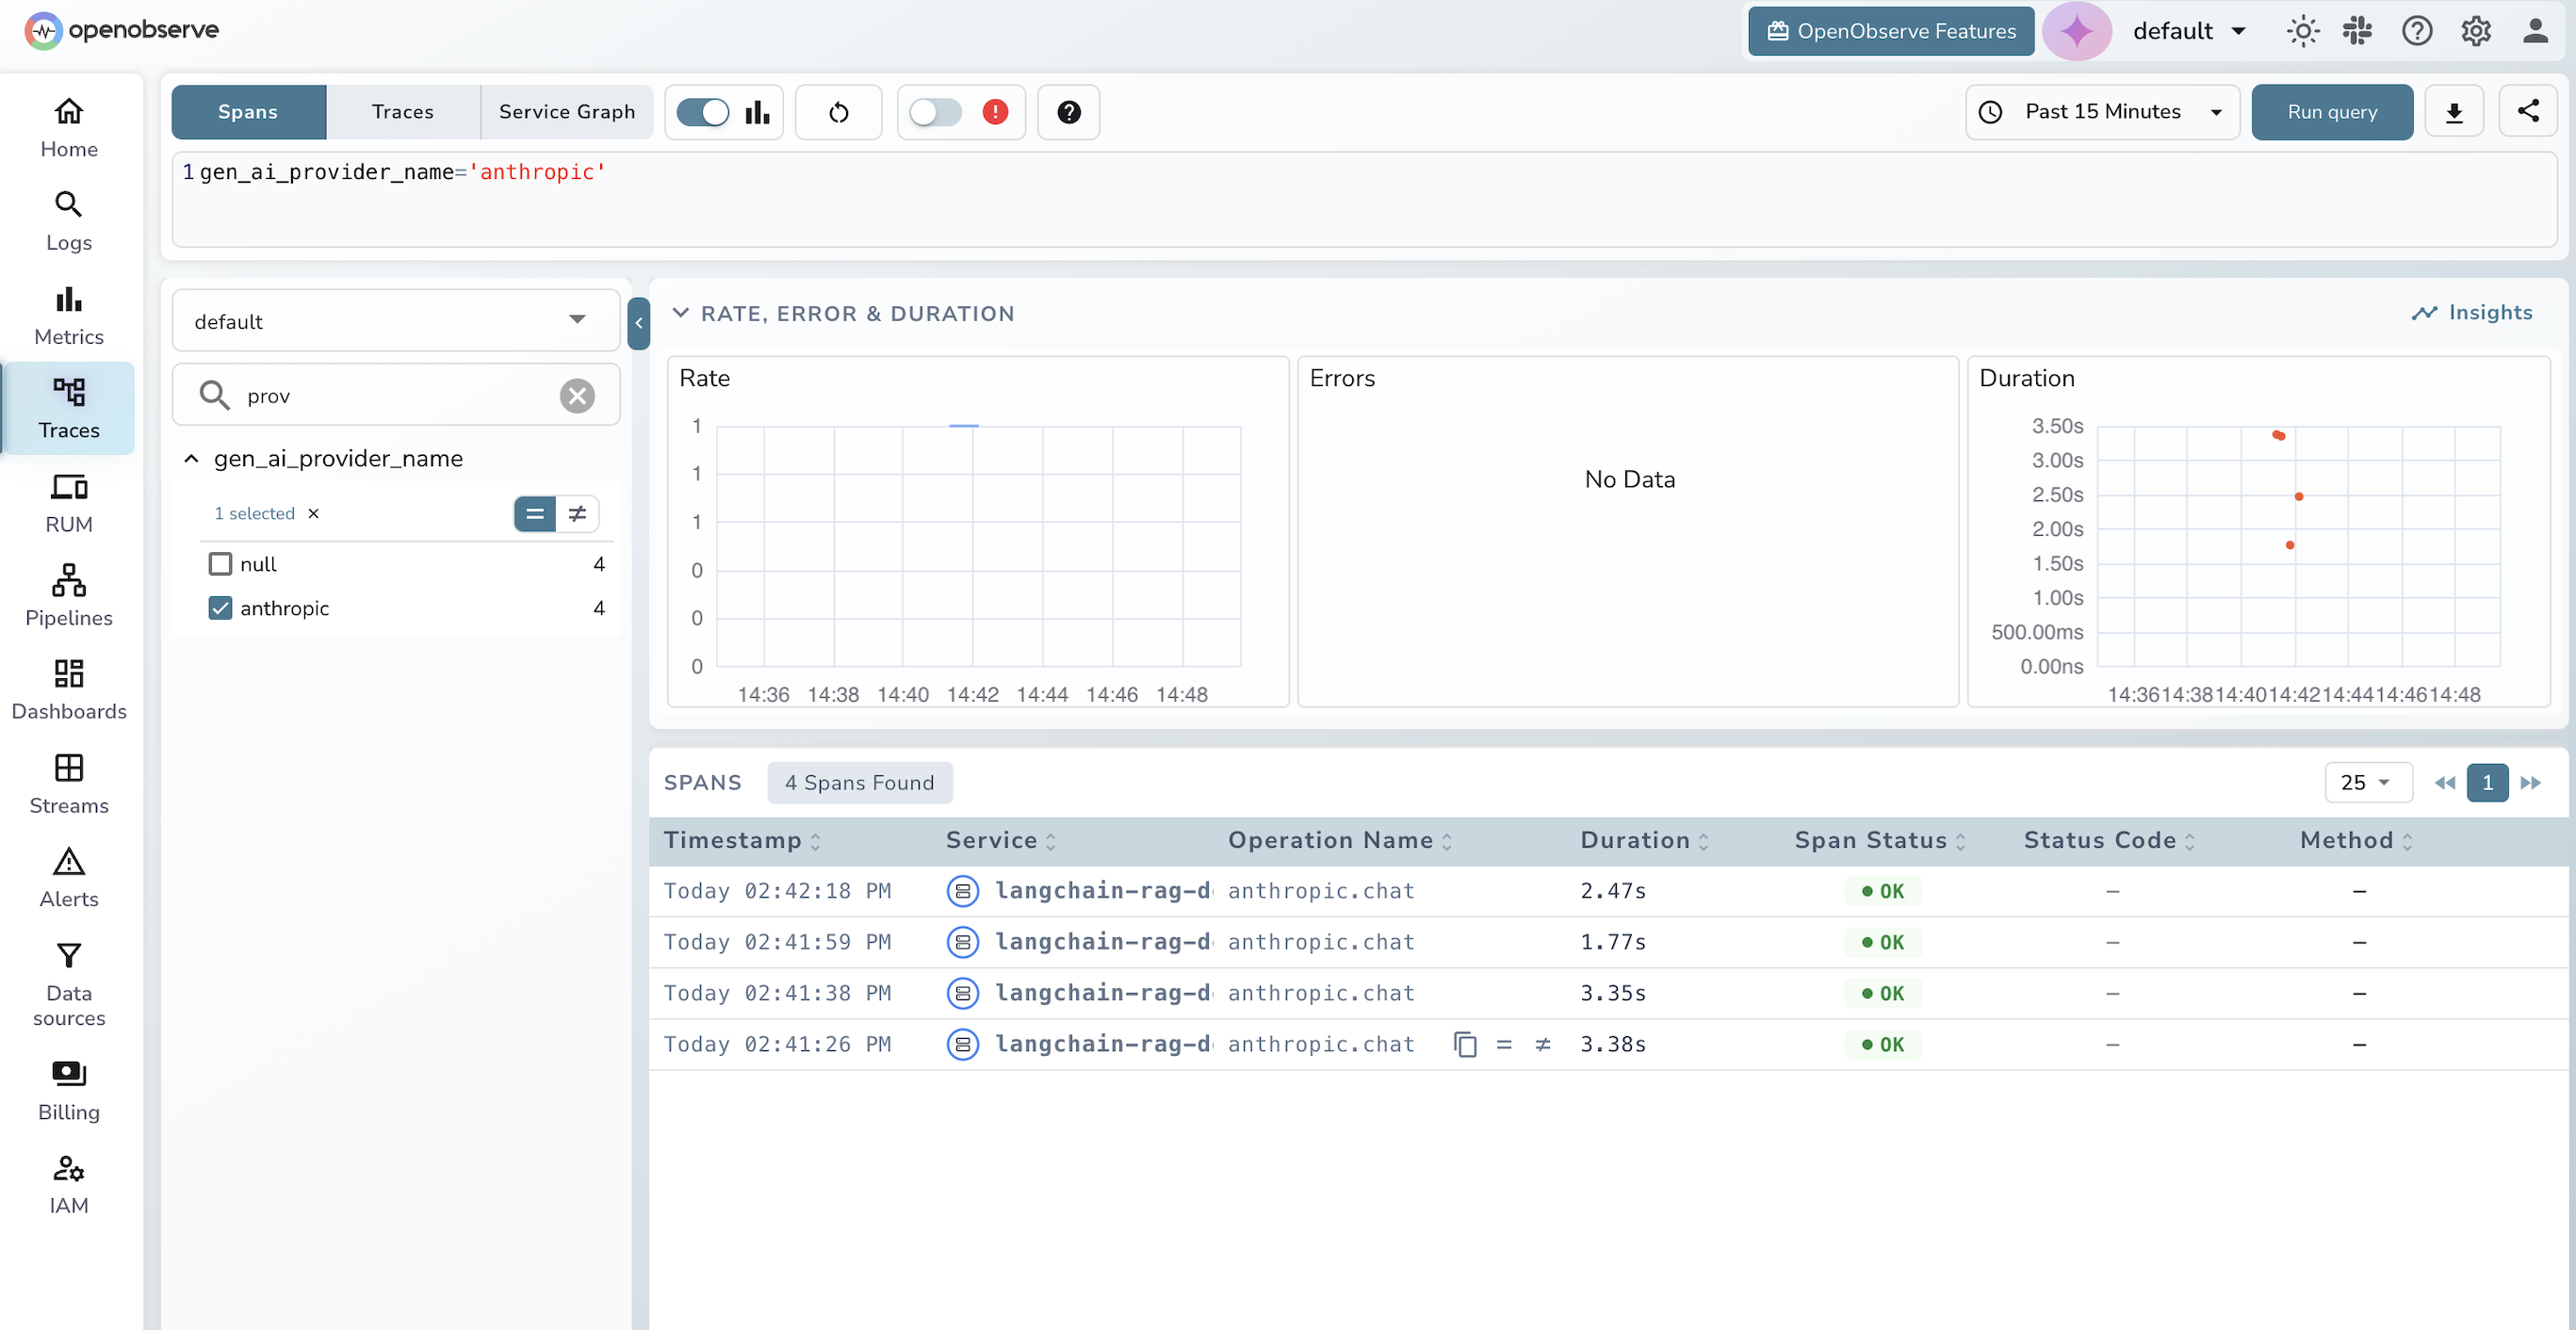
**The query editor** lets you filter spans by any `gen_ai.*` field, for example filtering by `gen_ai_provider_name: 'anthropic'` to see only LLM calls, or sorting by duration to find the slowest retrievals.
From here you can build dashboard panels for LLM cost over time (token usage multiplied by model pricing), p50 and p95 latency, and error rates. You can also set alerts, for example to notify when p95 LLM latency crosses 3 seconds or when completion tokens spike above a threshold. For teams that want proactive detection without writing manual alert rules, see how [anomaly detection in OpenObserve](https://openobserve.ai/blog/anomaly-detection/) can surface these patterns automatically.
## Why OpenObserve for LLM observability
If you are evaluating backends for LLM traces, a few things matter:
**Vendor neutrality.** OpenObserve consumes standard OpenTelemetry traces. If you switch backends tomorrow, your instrumentation code does not change. Compare this to LangSmith, which only works with LangChain and ties you to a specific vendor. For a practical walkthrough of the OpenTelemetry setup itself, [Auto-Instrumenting Distributed Services](https://openobserve.ai/blog/how-to-auto-instrument-distributed-services/) covers the full configuration from scratch.
**One platform for everything.** OpenObserve handles logs, metrics, and traces for your entire stack (infrastructure, applications, and LLM calls) in the same UI. LLM-specific tools like Langfuse cover the LLM layer only, leaving you to run a separate infrastructure observability stack. This unified view is especially useful for [AIOps](https://openobserve.ai/blog/what-is-aiops-complete-guide/) workflows, where correlating LLM behavior with infrastructure signals is key to root-cause analysis.
**Columnar storage at scale.** OpenObserve stores trace data in Parquet format, which matters as LLM trace volumes grow. Prompts and completions are large, and traditional observability backends are expensive to run at that volume. If you are evaluating OpenObserve for production LLM workloads, [LLM Monitoring Best Practices](https://openobserve.ai/blog/llm-monitoring-best-practices/) covers cost, retention, and storage planning in detail.
**Open source.** Self-hostable under AGPL. No per-span pricing surprises.
## Wrapping up
Distributed tracing for LangChain and LlamaIndex applications comes down to three choices: the instrumentation library (OpenLLMetry), the protocol (OpenTelemetry OTLP), and the backend (OpenObserve). Once you wire them up, every chain execution, every retrieval, every LLM call shows up as a span in a trace waterfall, and you get the same visibility into your AI workloads that you already have into your databases, APIs, and infrastructure.
The full working demo from this post (a runnable RAG app with LangChain and LlamaIndex backends, OpenTelemetry tracing, and a chat UI) is available at github.com/openobserve/langchain-llamaindex-tracing-demo. Clone it, fill in your credentials, and run `./run.sh` to choose your backend and start tracing in minutes.
**Ready to try it?** [Sign up for OpenObserve Cloud](https://cloud.openobserve.ai/web/signup) (free tier, no credit card required) or [self-host with a single binary](https://openobserve.ai/docs/getting-started/). You'll have traces flowing from your LangChain or LlamaIndex app in under 10 minutes.
_Have questions or feedback? Join the conversation in our [community Slack](https://openobserve.ai/marketing-opt-in/) or open an issue on GitHub._