# Log Searching and Filtering

> Search, filter, and analyze logs efficiently to uncover insights faster. Explore advanced log search techniques, query filters, and best practices for managing large-scale log data

Source: https://openobserve.ai/blog/log-searching-and-filtering/
Published: 2025-10-29
Authors: Simran Kumari
Category: How To
Tags: Logging

---

Logs are the heartbeat of modern applications. They help you debug issues, monitor system health, and understand user behavior. But with massive volumes of logs generated every second, finding relevant information quickly becomes challenging. That’s where **log searching and filtering** come in.

In this blog, we’ll cover:

* The fundamentals of log searching and filtering
* Common techniques used across platforms
* How OpenObserve enhances log exploration

If you're still evaluating platforms, see our [comparison of the best log analysis tools](https://openobserve.ai/blog/best-log-analysis-tools/) for how OpenObserve stacks up against the rest of the field.


## **What Logs Look Like**

Before diving into searching and filtering, it’s important to understand **what logs look like**. Broadly, logs fall into two categories:


### **1. Structured Logs (e.g., JSON or key-value pairs)**

Structured logs are machine-readable and contain clearly defined fields. For example:
```
{
  "timestamp": "2025-10-15T10:23:45Z",
  "service": "login",
  "level": "ERROR",
  "user_id": "12345",
  "message": "Failed login attempt"
}
```

**Advantages:**


* Fields can be directly queried and filtered.
* Easier to aggregate and visualize.

There are several structured log formats : JSON, key-value pairs, CSV-style lines, and even semi-structured formats generated by frameworks or log libraries.
For simplicity and consistency, we’ll focus on JSON logs, since they’re the most common.

### **2. Unstructured Logs (Plain Text)**

Unstructured logs are freeform text, often written by developers or applications without a defined schema:
```
2025-10-15 10:23:45 ERROR [login] User 12345 failed to login due to invalid password
```
**Challenges:**

* Requires parsing or pattern matching for meaningful queries.
* Harder to filter or aggregate automatically.


## Searching and Filtering Strategies

Whether structured or unstructured, the goal of log searching is the same: find relevant information quickly. Filtering helps narrow down results to meaningful subsets. 

Here’s a structured approach:


### Time Based Filtering

Time is usually the first filter you apply when exploring logs. Filtering logs within a specific time range, e.g., last hour, day, or week is essential for isolating incidents and analyzing trends.

OpenObserve lets you filter logs by time directly from the UI, without any queries. You can choose predefined relative ranges (last 5 minutes, hour, 24 hours, 7 days) for real-time monitoring, or select custom start and end times for detailed analysis or audits.

![Relative time based log filtering](/assets/relative_time_based_log_filtering_4f9de111ba.png)

![Absolute time based log filtering](/assets/absolute_time_based_log_filtering_7806b9e392.png)

### Field Based Filtering

Filtering logs by specific fields helps you zoom in on relevant information. Fields are attributes associated with logs, such as service name, log level, host, user ID, or custom tags.

* In most platforms, structured logs (like JSON) make it easy to filter by fields.
* For unstructured logs, fields may need to be extracted or parsed before filtering.

OpenObserve Approach:

* OpenObserve automatically extracts fields from logs and lets you filter directly from the UI.

 ![OpenObserve automatically extracts fields from logs](/assets/automatically_extracting_log_fields_76d26487ab.png)


* You can select a field (e.g., `service=login` or `level=ERROR`) and instantly see matching logs.

    ![Matching and filtering logs](/assets/matching_and_filtering_logs_873812506c.png)


* Multiple fields can be combined to focus on specific services, severity levels, hosts, or users, making investigations faser and more precise. You can make use of `AND` and `OR` to combine multiple conditions.

![Multiple condition based log Filtering](/assets/multiple_condition_based_filtering_e887f3cd31.png)


Besides categorical fields, numeric fields like status codes or response times can also be filtered using comparison operators. For numeric field comparison you can use statements like `status_code = 200 `, `status_code > 399`, `status_code is null `to filter out relevant data.

You can enable SQL mode and look for relevant fields and corresponding values using SQL queries.
![Enable SQL mode for query based filtering](/assets/sql_mode_for_sql_based_filtering_7c44f490bf.png)


### **Keyword and Pattern Searching**

Keyword search is the simplest way to find relevant logs: just look for specific words, phrases, or patterns.Pattern search (using regex or wildcards) allows finding more complex matches, especially in unstructured logs. 


OpenObserve Approach:


* To find field specific keyword or string matches you can make use of `str_match()` function

![Filtering logs using str_match function](/assets/filtering_logs_using_str_match_function_163bda51b8.png)

   Similarly there are a bunch of functions you can use to search for relevant keywords, check out the [full-text search function documentation](https://openobserve.ai/docs/reference/sql-functions/full-text-search/).

* OpenObserve supports [pattern matching on extracted fields or messages](https://openobserve.ai/docs/reference/sql-functions/full-text-search/#re_match) using functions like `re_match`, making it easy to identify repeated errors, exceptions, or unusual events.

![Filtering logs using regex match function](/assets/filtering_logs_using_regex_match_function_d0ce71f0d7.png)

* Keyword and pattern searches can be combined with field and time filters to quickly locate logs relevant to a specific incident. 

The type of log you’re dealing with influences how you search and filter. Structured logs allow direct field-based queries, while unstructured logs often require keyword or pattern searches. Regardless of the type, you can always apply time filters to narrow down your results.


### **OpenObserve Query Syntax Guide**

Once you understand filtering basics, here’s how to express them in OpenObserve.

**Note:** These functions are for additional help; you can always use SQL queries directly to filter, match, or search logs as needed.


#### **Basic Searches**


<table>
  <tr>
   <td><strong>Function</strong>
   </td>
   <td><strong>Syntax</strong>
   </td>
   <td><strong>Description</strong>
   </td>
   <td><strong>Example</strong>
   </td>
  </tr>
  <tr>
   <td><strong>str_match</strong>
   </td>
   <td><code>str_match(field, 'value')</code> Alias: <code>match_field(field, 'value')</code>
   </td>
   <td>Filters logs where the specified field contains the exact string (case-sensitive).
   </td>
   <td><code>SELECT * FROM "default" WHERE str_match(k8s_pod_name, 'main-openobserve-ingester-1')</code>
   </td>
  </tr>
  <tr>
   <td><strong>str_match_ignore_case</strong>
   </td>
   <td><code>str_match_ignore_case(field, 'value')</code> Alias: <code>match_field_ignore_case(field, 'value')</code>
   </td>
   <td>Filters logs where the field contains the string (case-insensitive).
   </td>
   <td><code>SELECT * FROM "default" WHERE str_match_ignore_case(k8s_pod_name, 'MAIN-OPENOBSERVE-INGESTER-1')</code>
   </td>
  </tr>
  <tr>
   <td><strong>match_all</strong>
   </td>
   <td><code>match_all('value')</code>
   </td>
   <td>Searches across all full-text indexed fields (case-insensitive).
   </td>
   <td><code>SELECT * FROM "default" WHERE match_all('openobserve-querier')</code>
   </td>
  </tr>
  <tr>
   <td><strong>re_match</strong>
   </td>
   <td><code>re_match(field, 'pattern')</code> Case-insensitive: <code>re_match(field, '(?i)pattern')</code>
   </td>
   <td>Filters logs by regex pattern. Useful for complex matches or multiple keywords.
   </td>
   <td><code>SELECT * FROM "default" WHERE re_match(k8s_container_name, 'openobserve-querier')</code>
   </td>
  </tr>
  <tr>
   <td><strong>re_not_match</strong>
   </td>
   <td><code>re_not_match(field, 'pattern')</code>
   </td>
   <td>Returns logs where the field <strong>does not match</strong> the regex pattern.
   </td>
   <td><code>SELECT * FROM "default" WHERE re_not_match(k8s_container_name, 'openobserve-querier')</code>
   </td>
  </tr>
</table>


#### **Practical Debugging Examples**


* Find all 5xx errors in the payments service. Quickly identifies server-side failures affecting your payment API.
```
service='payments' AND code >= 500
```
* Locate failed login attempts.Helps investigate authentication issues and potential security incidents.
```
service='login' AND message LIKE '%failed%'
```
* Identify slow API responses (>2000ms). Highlights performance bottlenecks in your services.
```
service='api' AND response_time > 2000
```
* Analyze payment service in staging environment:
```
match_all('staging') AND str_match(service, 'payments')
```
* Exclude system containers from error analysis:
```
re_not_match(k8s_container_name, 'openobserve-querier|controller')
```

## Search Around in Logs

When debugging, a single log line rarely tells the full story. You often need to see what happened before and after an error or warning to understand the root cause. That’s exactly what the Search Around feature in OpenObserve helps you do.

The **Search Around** feature retrieves log entries that were stored immediately before and after a selected record. 
Unlike filters or queries, it does **not** apply your original search conditions, this ensures you get the complete surrounding context as it appears in the backend storage.

Essentially, it helps you answer questions like:


* “What happened right before this error?”
* “Did any warnings appear just after this failure?”


### How to Use Search Around

1. Based on your search query, you can filter the records and expand on the target record. Locate the `search around` button at the bottom of the page:
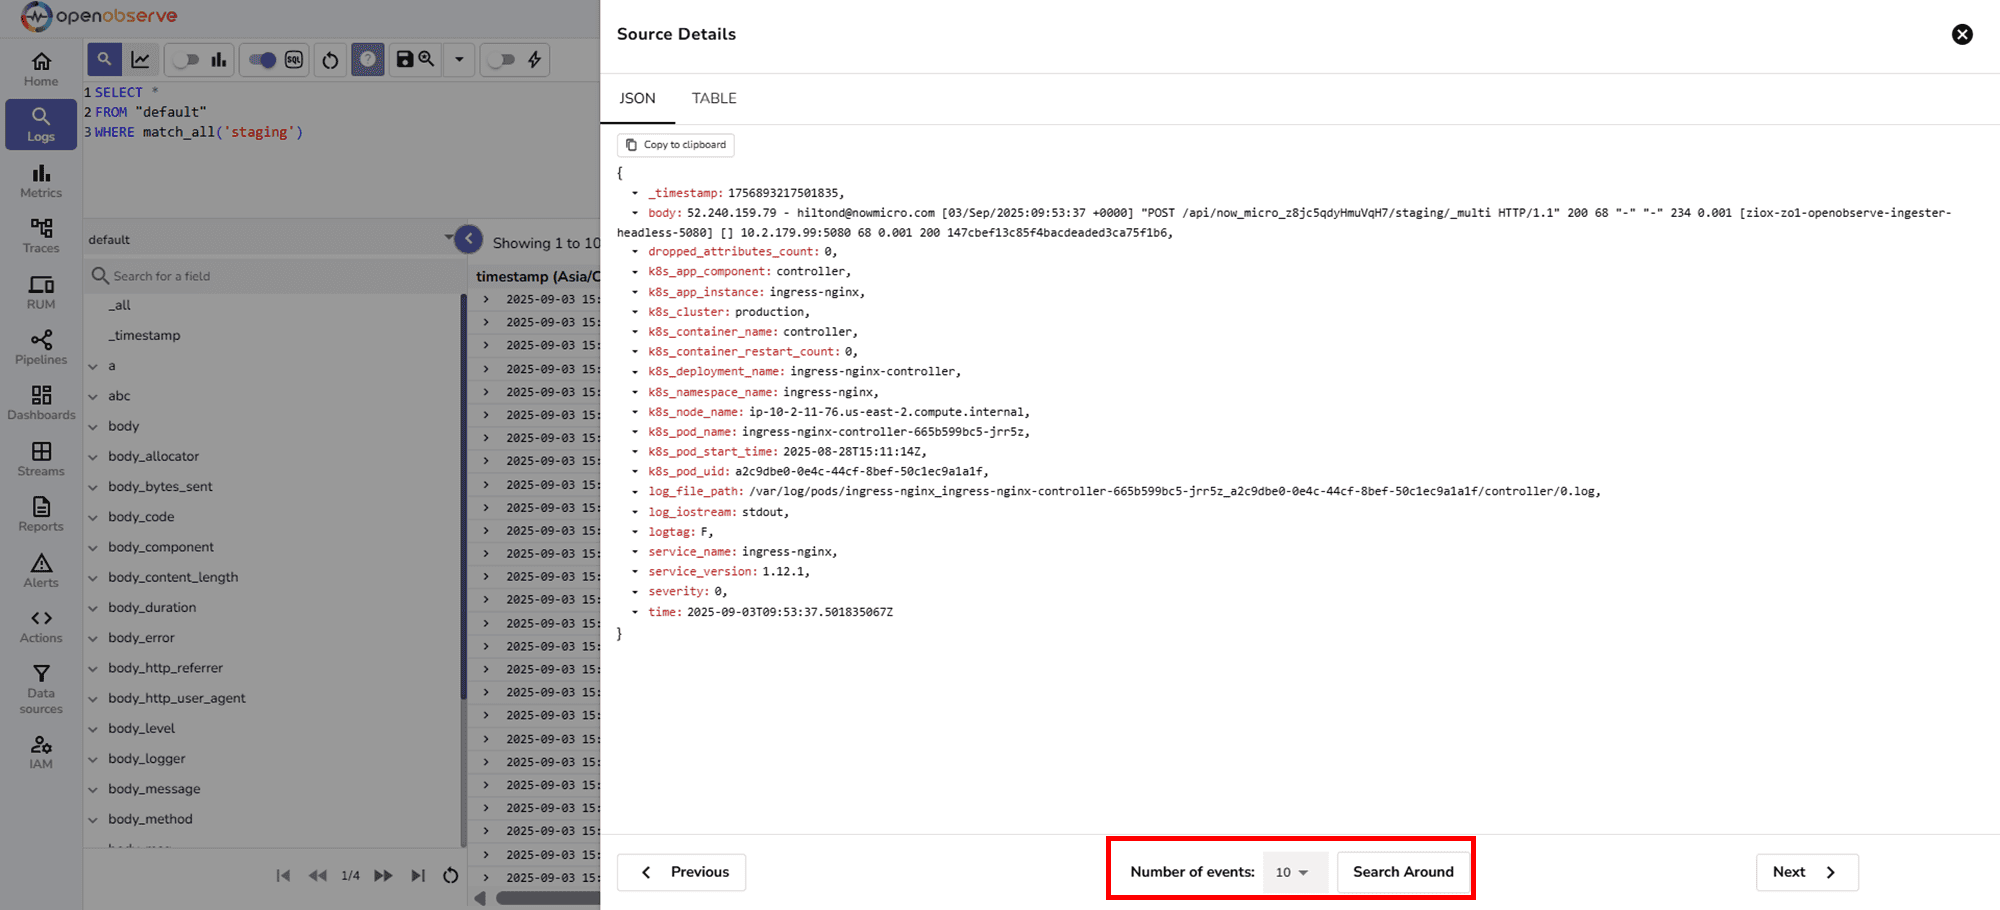
![Search around logs feature in OpenObserve.png](/assets/log_search_around_feature_in_openobserve_50d74e96be.png)
2. In the Number of events selector, choose how many records you want to retrieve in total, including the selected record and Click `Search Around`. 
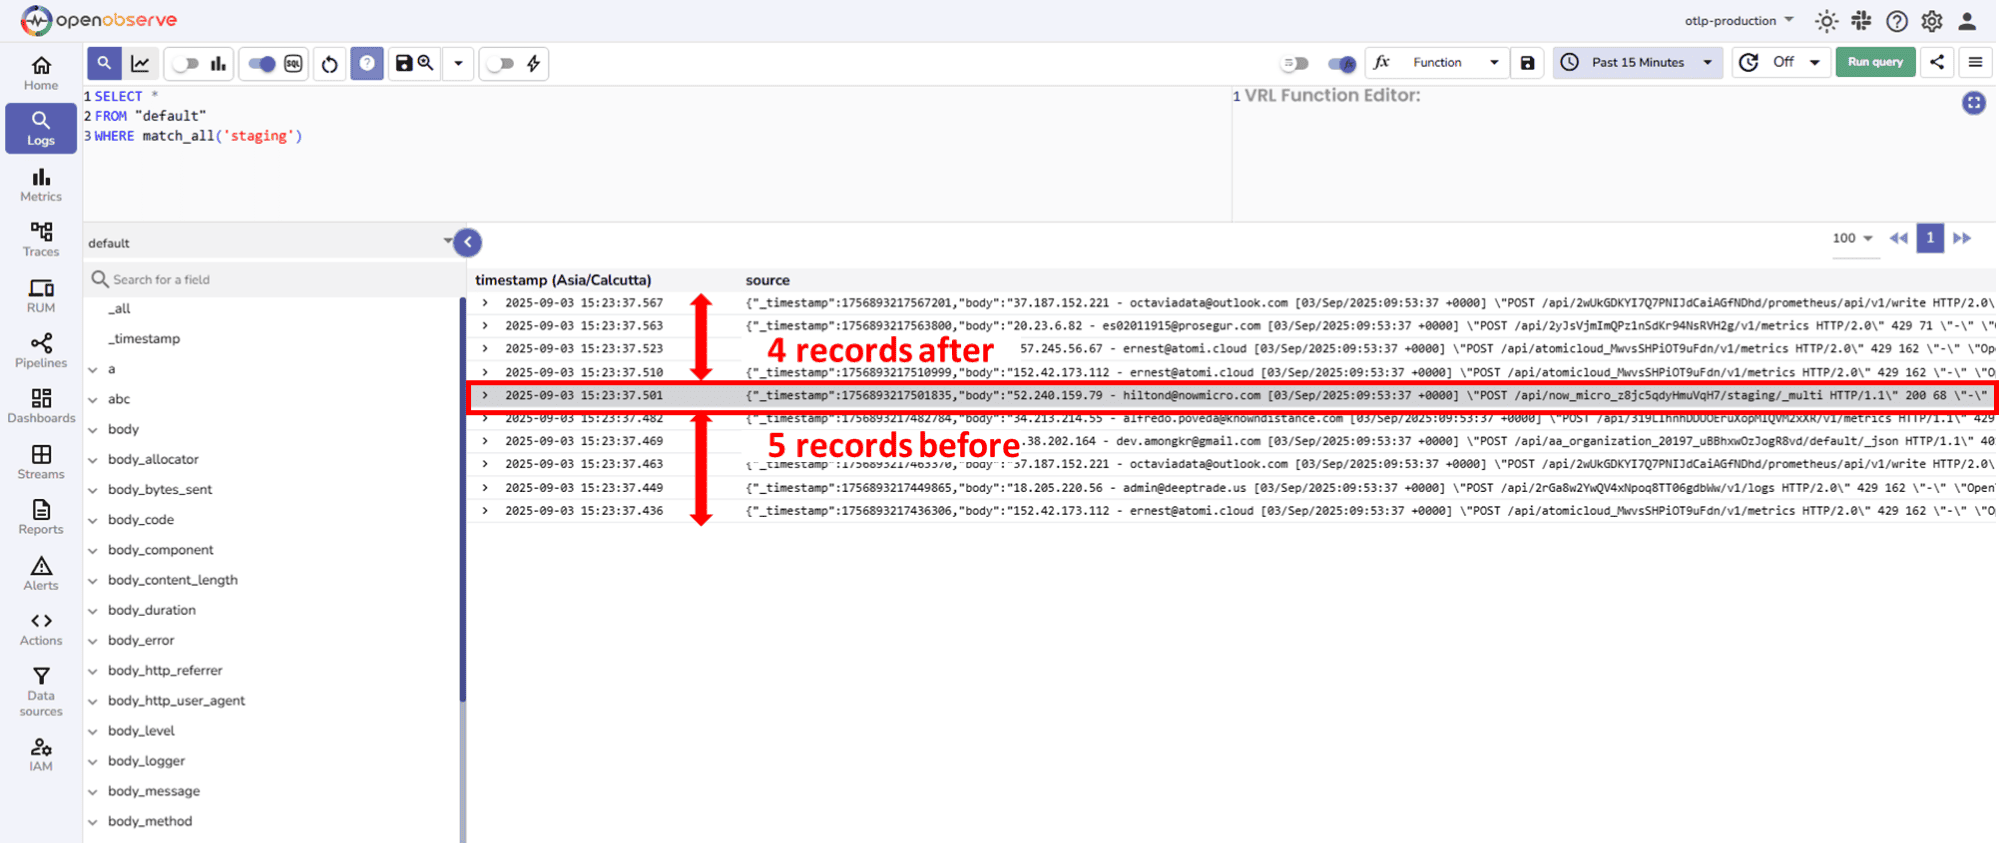
![Event selector for logs in search around feature](/assets/event_selector_for_logs_search_around_a4a44c481c.png)
For example, when you select 10, the result set contains 10 records in total, including the selected record. The split is 5 records before the selected record and 4 records after.


## Log Aggregation

Once you’ve searched and filtered logs, the next step is **aggregation**, summarizing log data to uncover trends, patterns, and insights that individual log lines alone cannot reveal.

Why Aggregation Matters

* Makes sense of large volumes of logs.
* Helps identify spikes, anomalies, or repetitive issues.
* Powers dashboards, alerts, and reports for operational visibility.

**Common Aggregation Techniques**

1. **Count & Group By**
    * Count logs grouped by fields like `service`, `level`, or `host`.
    * Example: Find which service generated the most errors in the last 24 hours. 
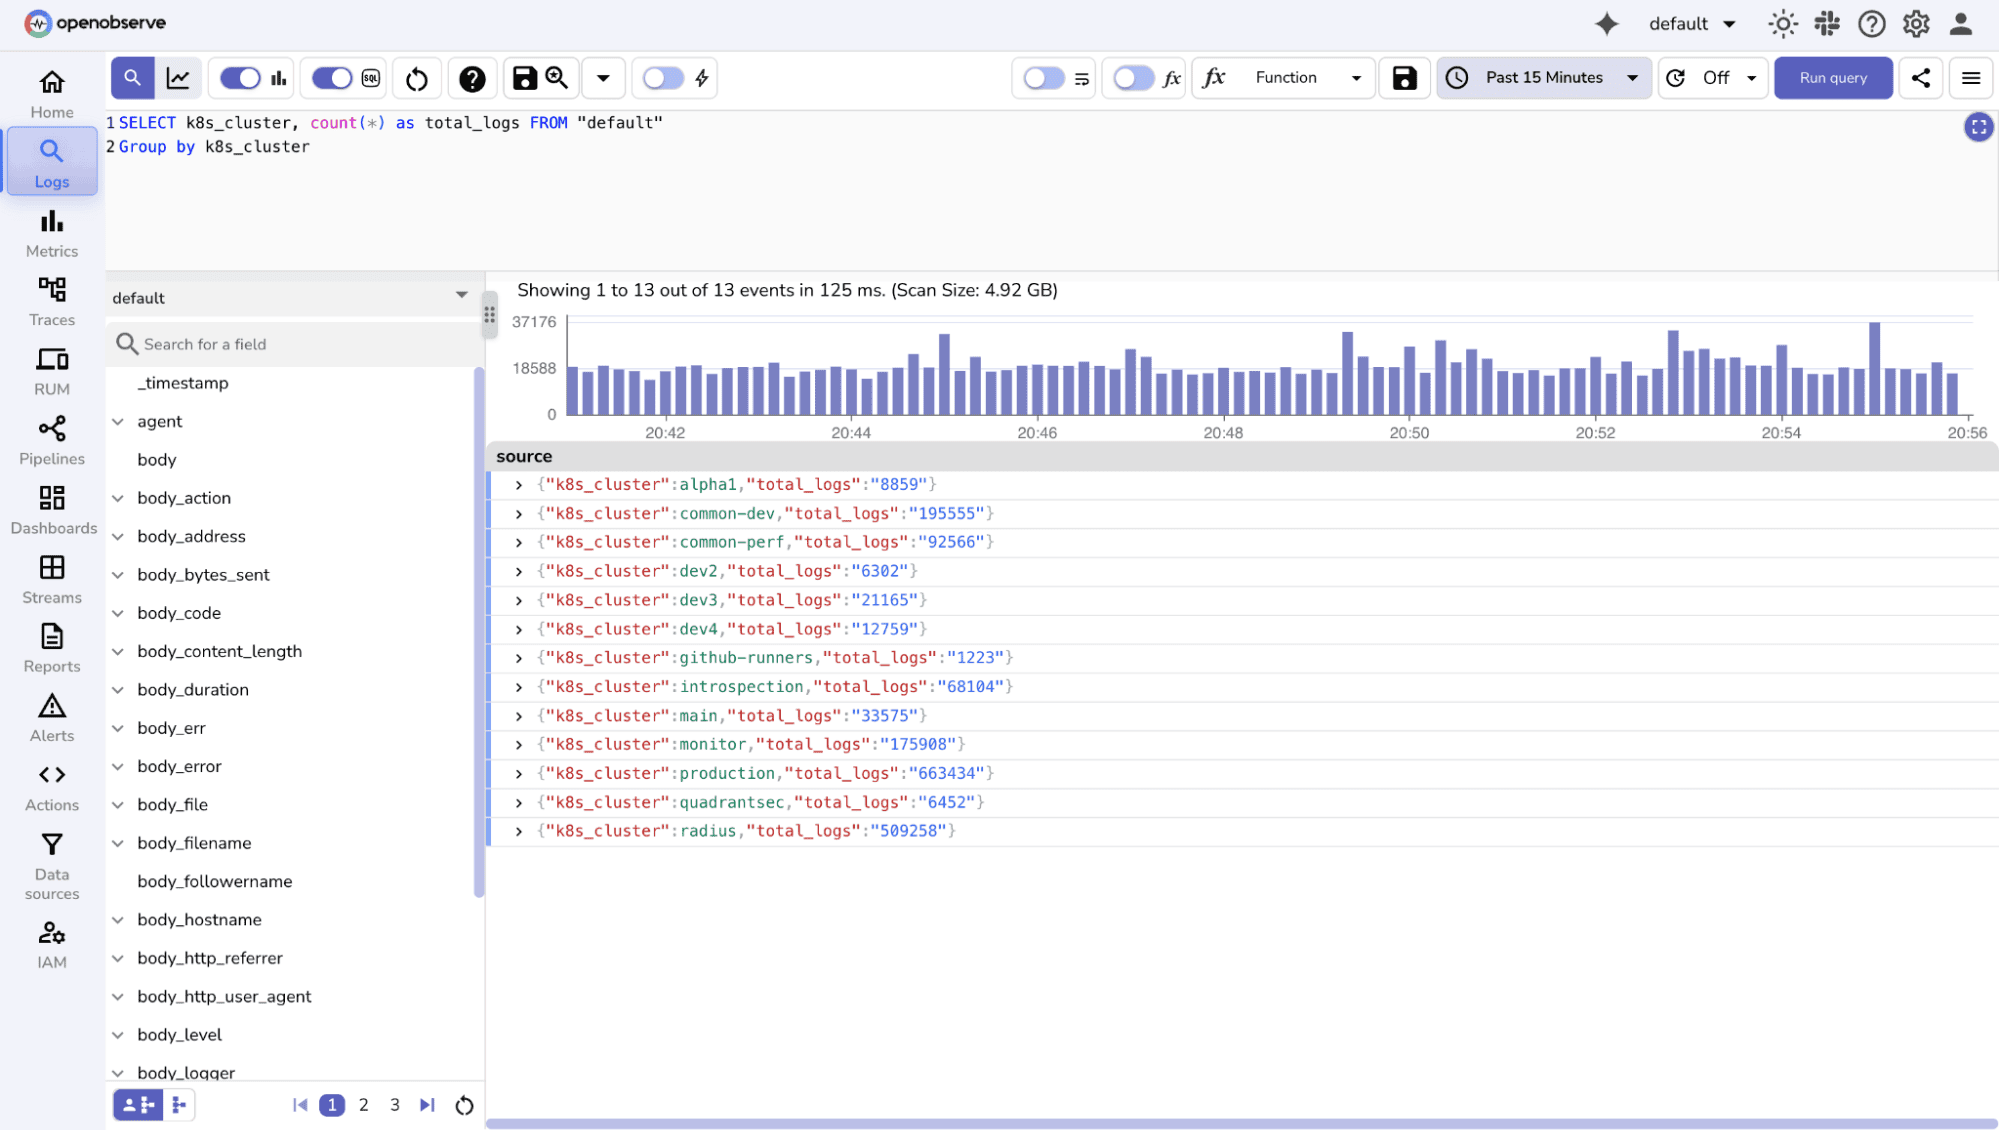
    ![Count and Group By function for Log Aggregation](/assets/count_and_groupby_function_for_log_aggregation_a91416256c.png)
    
2. **Time-Based Histograms**
    * Bin logs over time intervals (minutes, hours, days) to visualize trends.
    * Example: Number of login errors per hour for the last week.
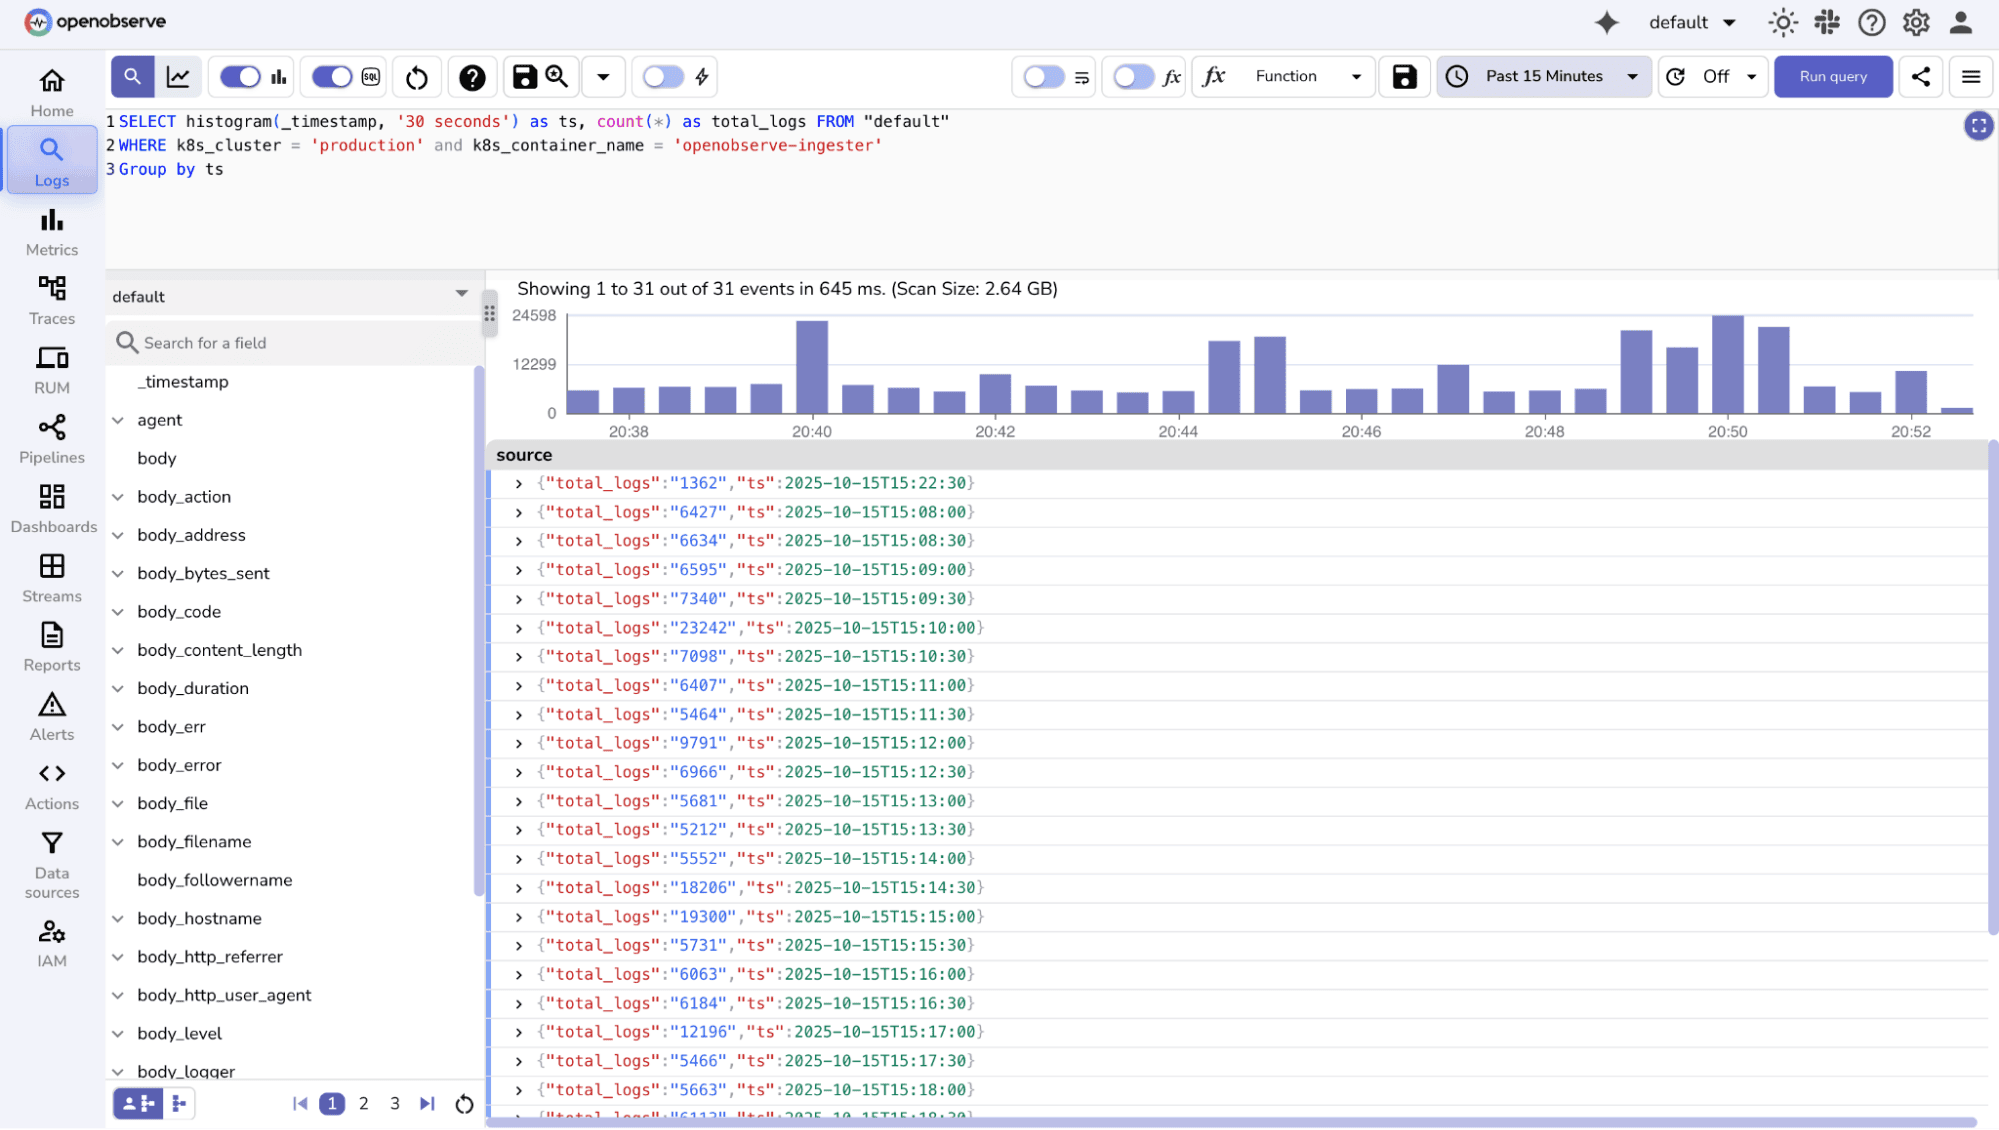
    ![Time based Histograms for log filtering](/assets/time_based_histograms_for_log_filtering_96c9fdc4da.png)
    
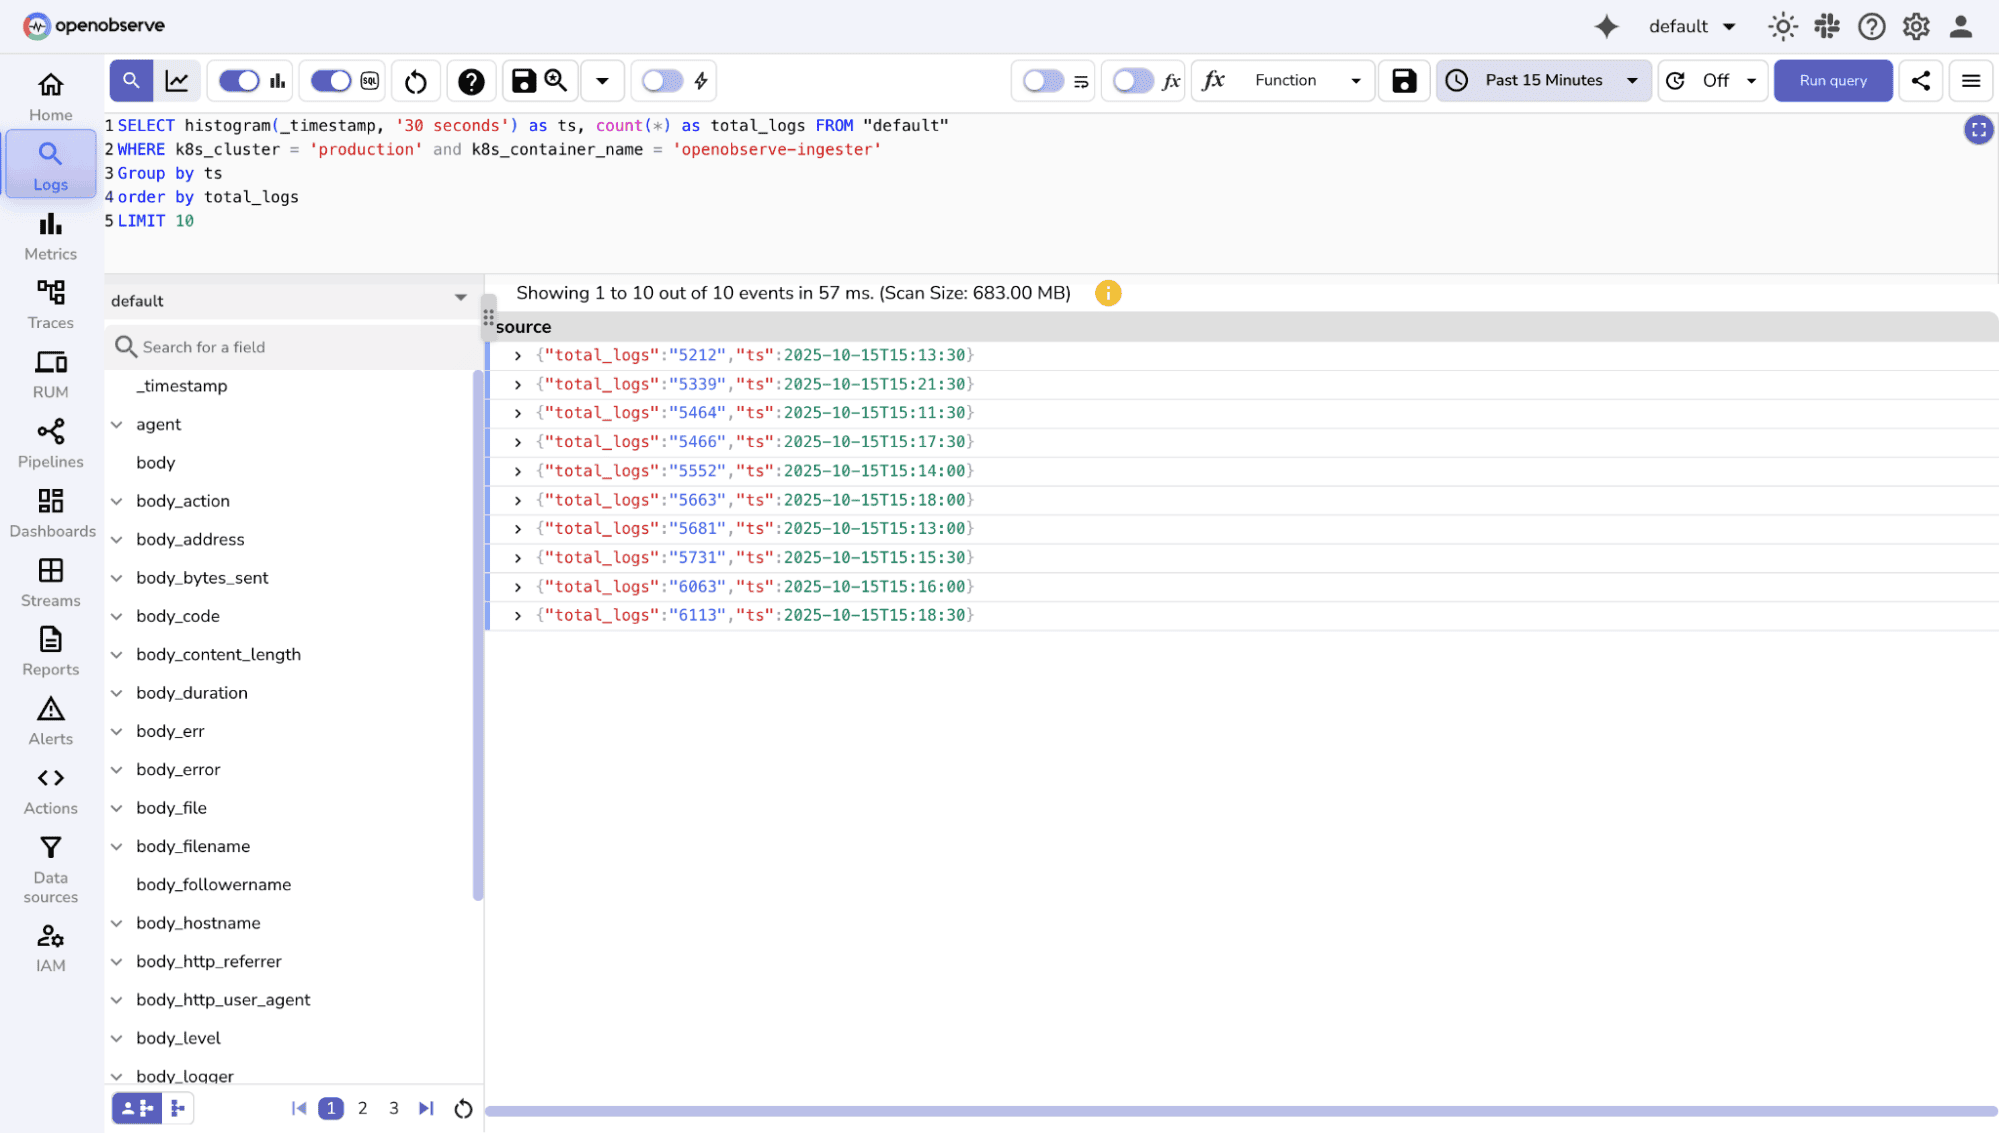
3. **Top-N Analysis**
    * Identify top IP addresses, users, or endpoints causing errors.
    * Example: Top 10 endpoints returning HTTP 500 errors. 
     ![Top N log Analysis in OpenObserve](/assets/top_n_log_analysis_in_openobserve_8cc775b407.png)

OpenObserve Approach

* **SQL Mode:** Aggregation queries are easy to write. Read the [aggregate function documentation](https://openobserve.ai/docs/reference/sql-functions/aggregate/) for the full list.
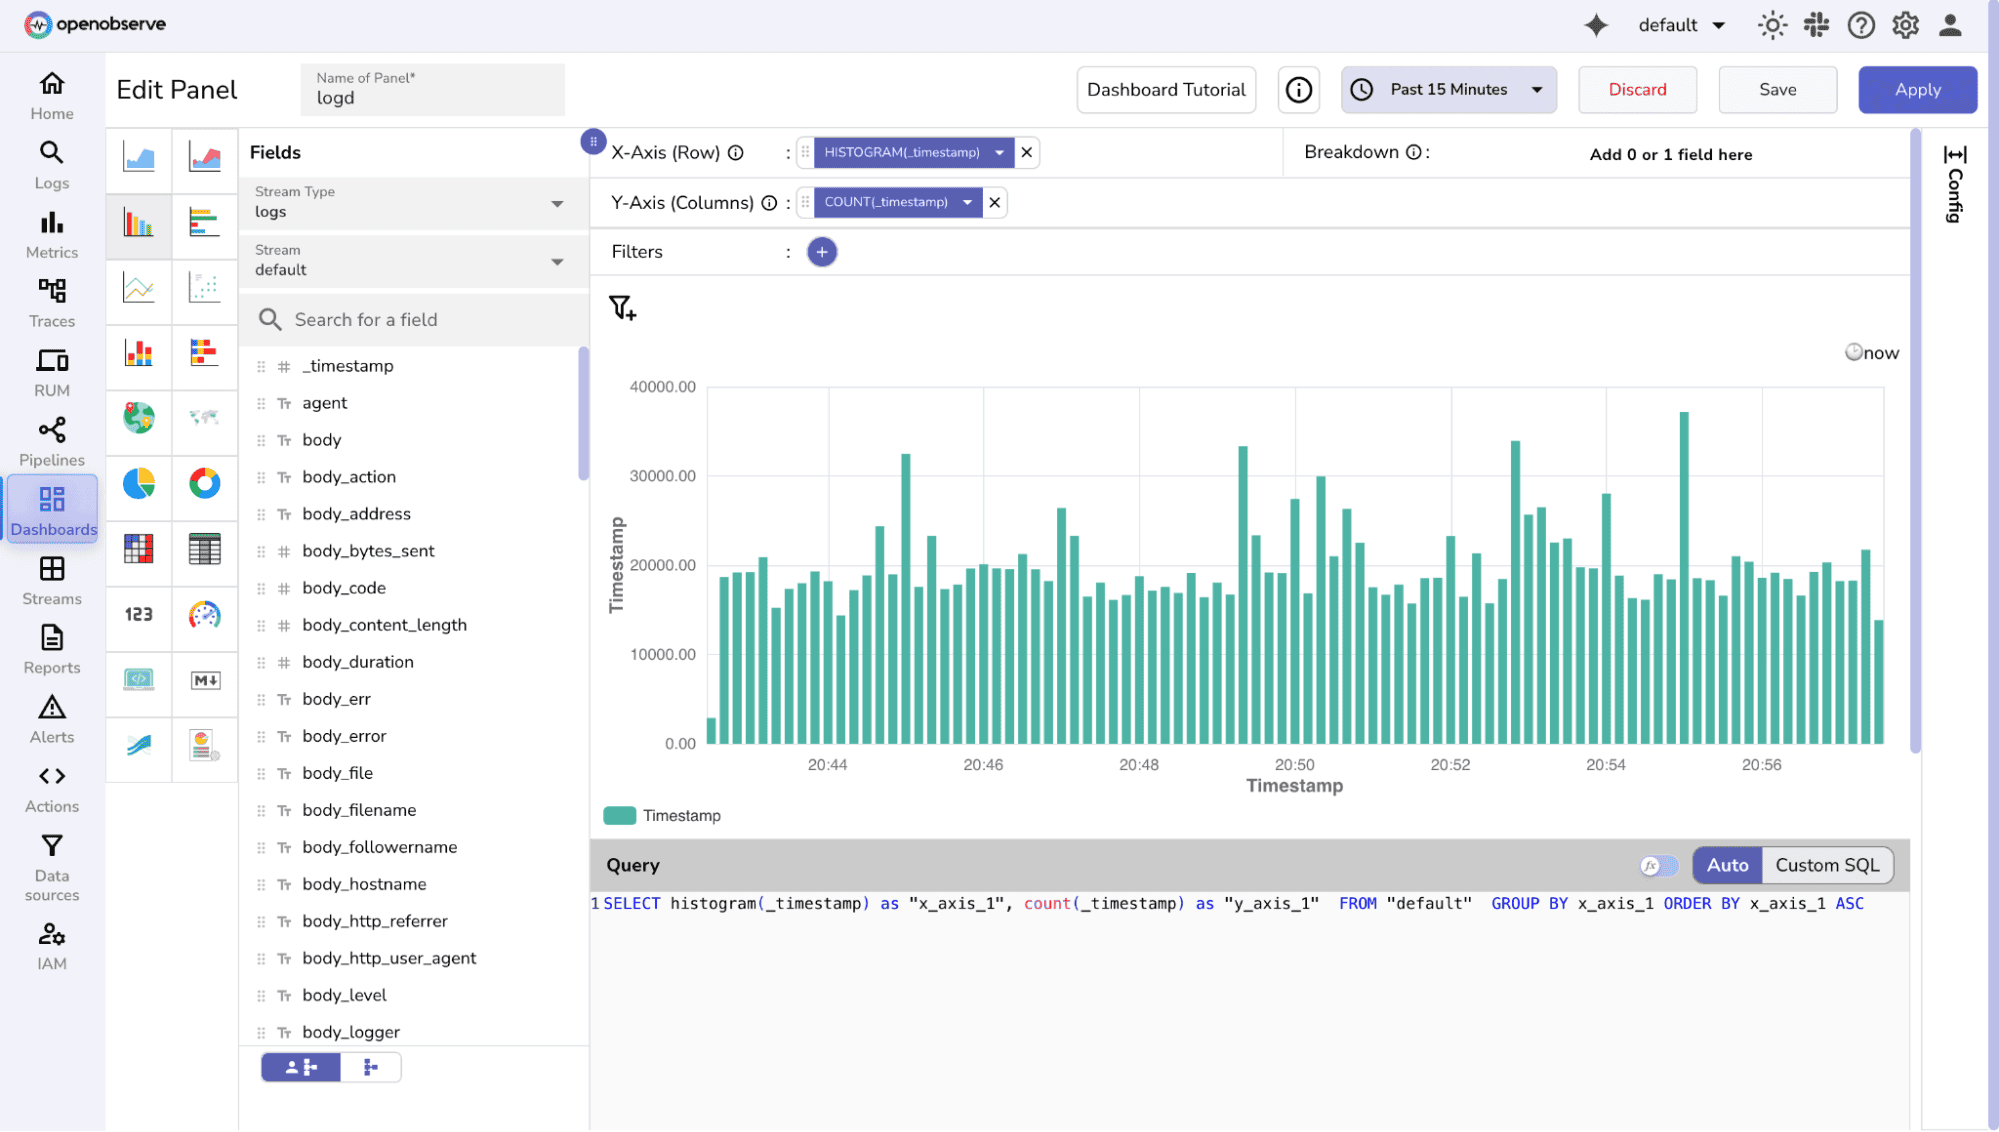
* **UI-Based Aggregation:**
    * OpenObserve dashboards allow drag-and-drop aggregation on fields.
    * Time histograms, top values, and counts can be visualized without writing queries.
    * Combine with filters (time, field, keyword) to create focused analytics.
![UI Based Log Aggregation and Dashboard Creation](/assets/ui_based_log_aggregation_and_dashboard_creation_0073e32afc.png)

**Best Practices**

* Always apply filters before aggregation to avoid noisy or irrelevant results.
* Use time bins appropriate for the volume of logs (e.g., hourly for high-volume services).
* Combine field, keyword, and numeric filters to make aggregations actionable.


## Saved Views

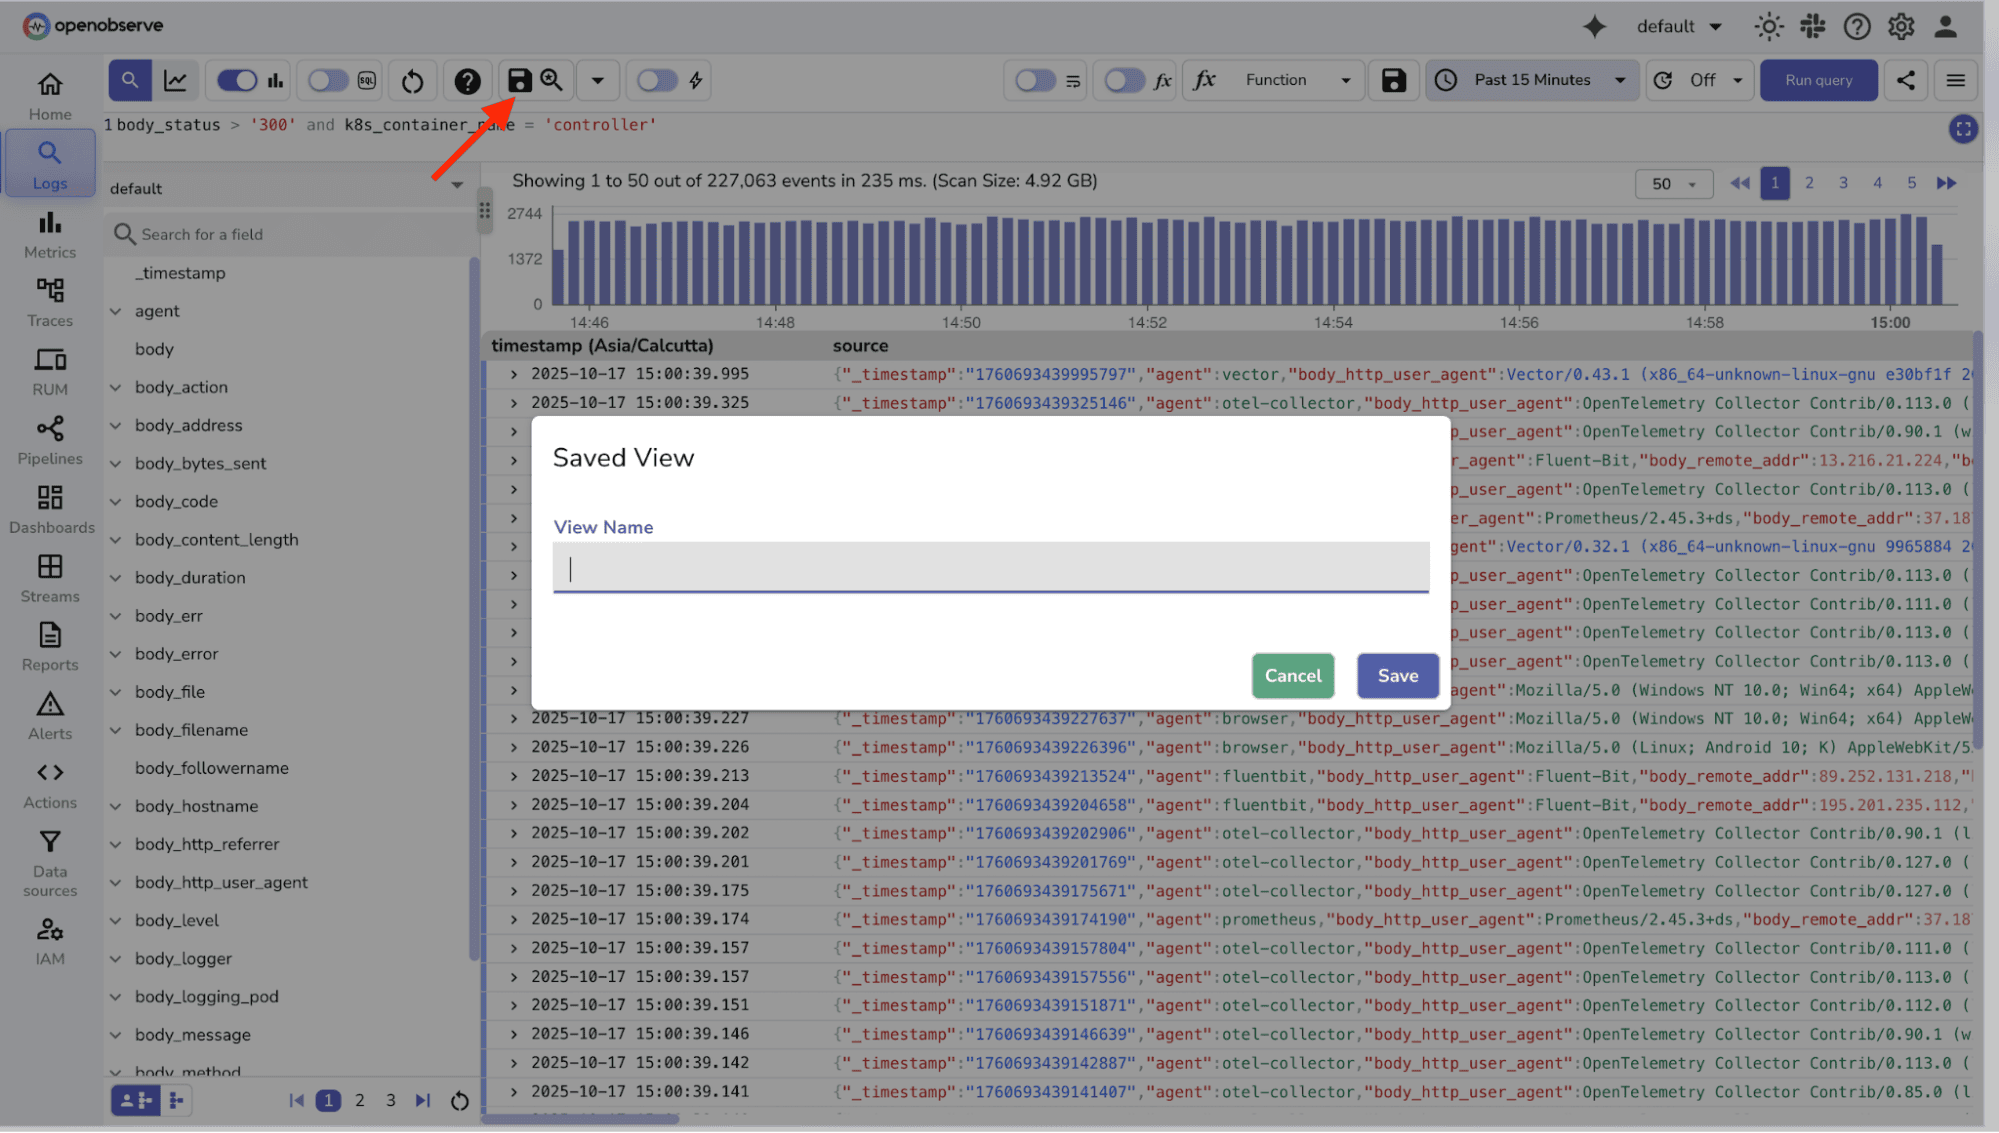
When you repeatedly search for similar patterns like login failures, 5xx errors, or latency spikes, **Saved Views** help you store and reuse those filters and queries.

With Saved Views, you can:

* Save a search query or combination of filters for future use.
* Reopen it anytime from the Saved Views section without rebuilding queries.
* Share views across your team to ensure consistent troubleshooting. 

**Example:** Save the query: `service='payments' AND code>=500 `as **“**Payment Errors**”**. 

Next time you need to debug API issues, you can simply open this Saved View without recreating the query.
![Creating saved views for Filtered logs](/assets/creating_saved_views_for_filtered_logs_d91de50588.png)

## VRL Transformations: Enrich, Redact, and Customize Logs

Raw logs often need refinement before they can be effectively searched, filtered, or visualized. OpenObserve leverages **VRL (Vector Remap Language)**, a flexible and powerful language designed to **transform, enrich, and clean log data** in real time during ingestion.


### **What is VRL?**

VRL is a lightweight scripting language specifically for observability pipelines. It allows you to manipulate logs: extracting fields, modifying values, redacting sensitive information, and adding contextual metadata without changing the original log source.


### **Key Use Cases**


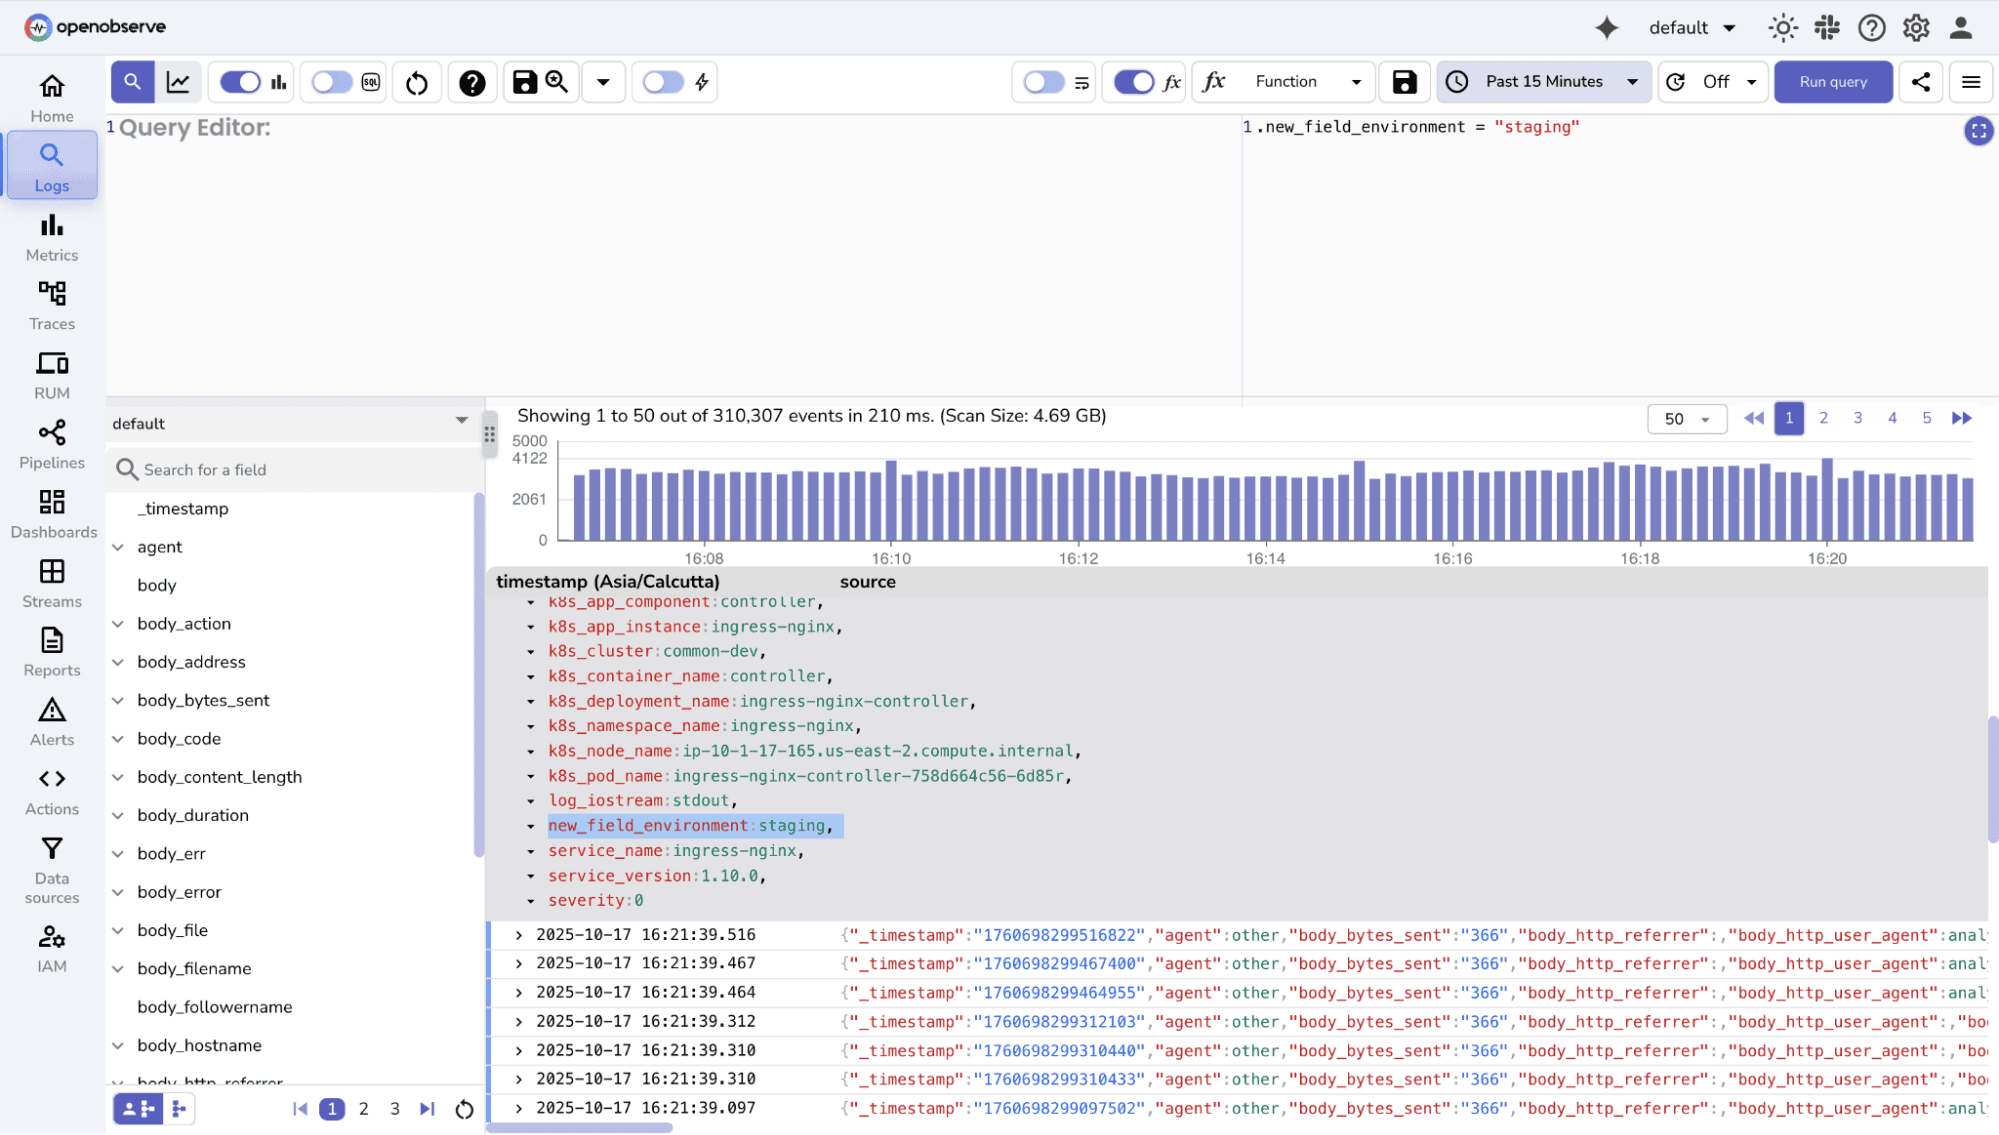
1. **Enrichment** : Add contextual information to logs to make them more actionable. For example:       
   * Add service names, environment labels (staging, production), or host details.
   ```
   .environment = "staging"
   ```
   ![Using VRL for log updating](/assets/using_vrl_for_log_updates_f4735948c8.png)
   
    * Generate derived fields like error categories, user regions, or request latency buckets. 

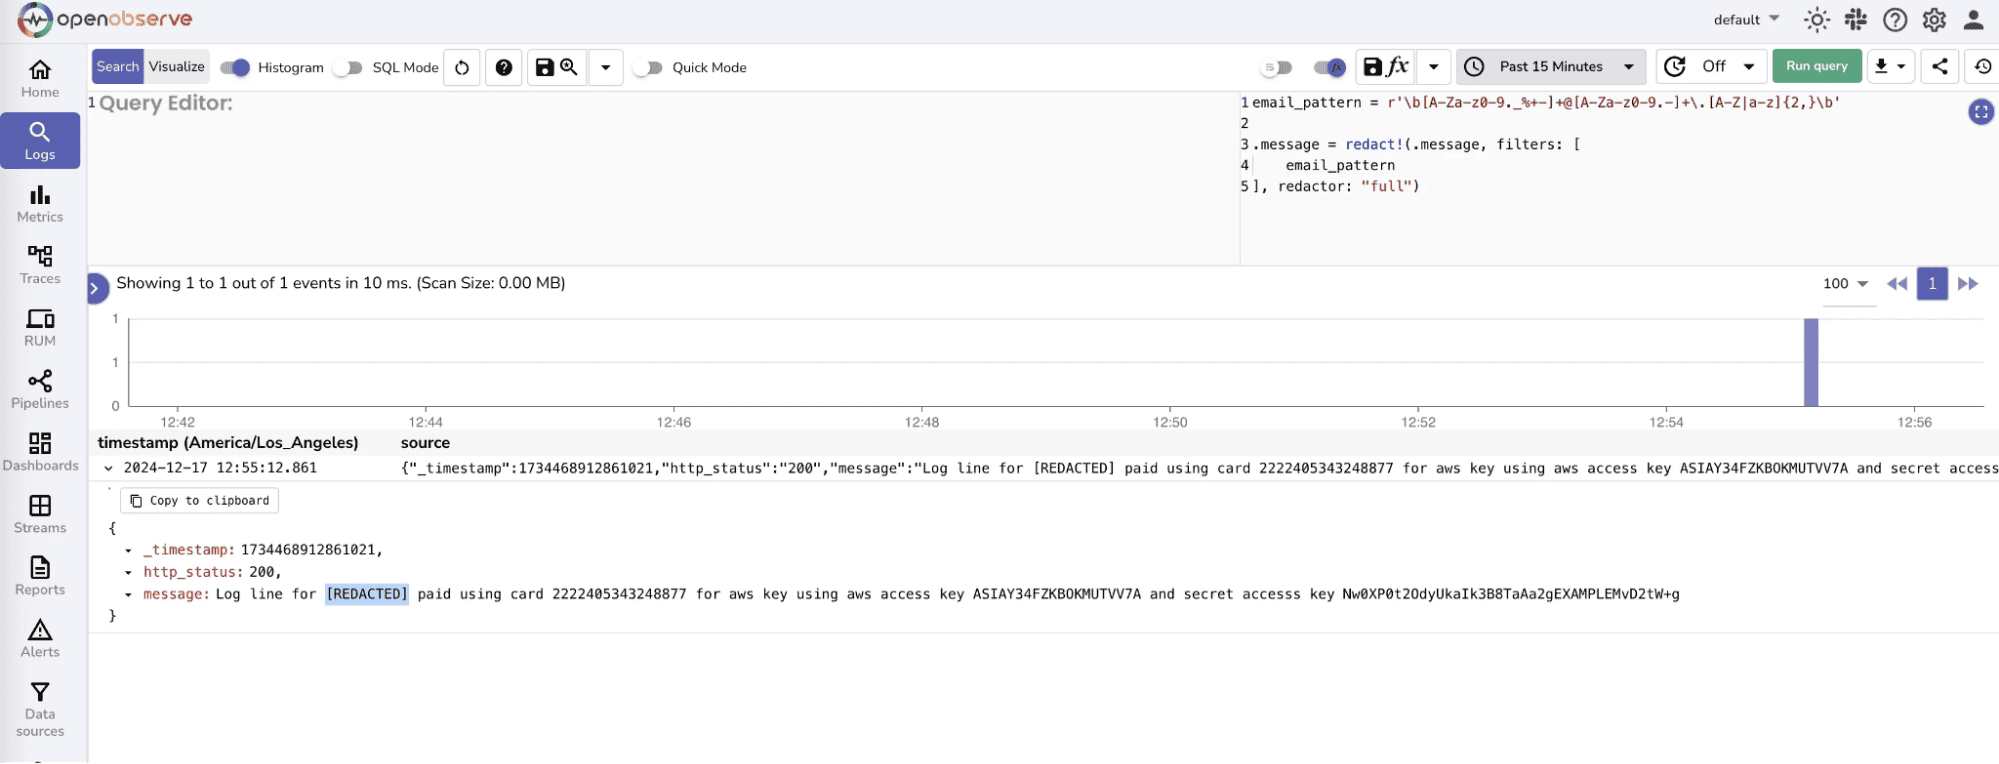
2. **Redaction:** Mask sensitive information like passwords, tokens, or PII before storing logs. This ensures compliance with privacy regulations. 
     ![Sensetive Data Redaction in Logs](/assets/sensetive_data_redaction_0c12497ee2.png)
	Learn more about [How to redact sensitive / PII data in your logs](https://openobserve.ai/blog/redact-sensitive-data-in-logs/) in detail.

3. **Field Transformation:** Convert or normalize log fields for consistency across services: \

    * Change timestamps to a standard format.
    * Normalize status codes or log levels.
    * Concatenate fields to create a single, searchable identifier.

	Read about <a href="https://vector.dev/docs/reference/vrl/functions/" target="_blank" rel="noopener noreferrer">VRL Functions</a> and <a href="https://vector.dev/docs/reference/vrl/expressions/" target="_blank" rel="noopener noreferrer">Expressions</a>. 

**4. Conditional Routing:** You can also use VRL to **tag or route logs** based on certain conditions, making downstream analysis easier:

```
if .level == "ERROR" {
    .priority = "high"
} else if .level == "WARN" {
    .priority = "medium"
} else {
    .priority = "low"
}
```
### **Conclusion**

Logs are the heartbeat of your applications, but finding what matters in a flood of data can be tricky. Understanding the difference between structured and unstructured logs helps you pick the right search and filter approach.

Time, field, and keyword-based filters let you zoom in on relevant events, and aggregation turns raw logs into insights you can act on. OpenObserve makes this easier by automatically extracting fields, supporting flexible searches, and letting you visualize trends all in one place.

By combining these techniques with good practices, you can investigate issues faster, reduce noise, and get a clearer picture of what’s happening in your systems.

Further Reads

* [Search Around Feature in OpenObserve Logs](https://openobserve.ai/docs/user-guide/data-exploration/logs/search-around/)
* [Log Management in OpenObserve](https://openobserve.ai/docs/features/logs/)
* [How Log parsing works in OpenObserve](https://openobserve.ai/blog/how-log-parsing-works-in-openobserve/)
* [Filters in OpenObserve Dashboards](https://openobserve.ai/docs/user-guide/analytics/dashboards/filters/filters/)


#### ***Get Started with OpenObserve Today\!***

*Sign up for a [14 day cloud trial](https://cloud.openobserve.ai/). Check out our <a href="https://github.com/openobserve" target="_blank" rel="noopener noreferrer">GitHub repository</a> for self-hosting and contribution opportunities.*
