# How to migrate from Datadog to OpenObserve
> Learn how to configure Datadog Agent to send metrics to OpenObserve using OpenTelemetry Collector. Complete guide with setup, troubleshooting & best practices.
Source: https://openobserve.ai/blog/migrate-datadog-metrics-openobserve-opentelemetry/
Published: 2025-03-19
Authors: Manas Sharma
Category: How To
Tags: Migration, OpenObserve
---
## Introduction
When migrating from [Datadog](/datadog-alternative/) to OpenObserve, one of the key challenges is moving your metrics while maintaining data consistency. This guide demonstrates how to configure your Datadog Agent to send metrics to OpenObserve using the OpenTelemetry Collector's StatsD receiver.
The setup works as follows:
1. The Datadog Agent collects metrics from your systems using the DogStatsD protocol
2. These metrics are forwarded to the OpenTelemetry Collector's StatsD receiver
3. The StatsD receiver translates these metrics into OpenTelemetry Protocol (OTLP) format
4. The transformed metrics are then exported to OpenObserve for analysis
The translation process is straightforward for most metric types:
- Datadog Gauge metrics → OpenTelemetry Gauge metrics
- Datadog Count and Rate metrics → OpenTelemetry Sum metrics (with interval adjustments for Rate)
- Datadog Distribution metrics → OpenTelemetry Exponential Histogram metrics
## Prerequisites
Before you begin, ensure you have:
- Datadog Agent installed and configured
- An OpenObserve instance (You can use [OpenObserve Cloud](https://cloud.openobserve.ai) or set up a [self-hosted installation](https://openobserve.ai/docs/quickstart/#self-hosted-installation)) up and running
- Basic understanding of metrics and observability concepts
## Getting Started
### Step 1: Install the OpenTelemetry Collector
> _NOTE: The default Otel Collector doesn't have all the receivers, including the StatsD one we are going to use to collect data from the datadog agent. It has support for receivers like Kafka, Prometheus, Jaeger, etc. So, instead of using opentelemetry-collector, we are going to use opentelemetry-collector-contrib._
1. Visit the OpenTelemetry Collector Contrib Releases page.
2. Download the latest release for your machine. You can use the following command in your terminal to download the Otel-Collector for macOS, replacing `v0.115.1` with the latest version number:
```bash
curl --proto '=https' --tlsv1.2 -fOL https://github.com/open-telemetry/opentelemetry-collector-releases/releases/download/v0.115.1/otelcol-contrib_0.115.1_darwin_arm64.tar.gz
```
3. Unzip the downloaded file:
```bash
tar -xvf otelcol-contrib_0.115.1_darwin_arm64.tar.gz
```
4. Move the binary to a directory in your PATH (e.g., /usr/local/bin):
```bash
sudo mv otelcol-contrib /usr/local/bin/
```
5. After installation, check the status of the OpenTelemetry Collector:
```bash
otelcol-contrib --version
```

### Step 2: Configure the OpenTelemetry Collector
Create a configuration file `config.yaml` for the collector:
```yaml
receivers:
statsd:
endpoint: "0.0.0.0:8125" # standard StatsD port
aggregation_interval: 60s
enable_metric_type: true
timer_histogram_mapping:
- statsd_type: "timing"
observer_type: "histogram"
histogram:
max_size: 100
- statsd_type: "histogram"
observer_type: "histogram"
histogram:
max_size: 100
processors:
batch:
timeout: 10s
send_batch_size: 10000
exporters:
logging:
verbosity: detailed
otlphttp/openobserve:
endpoint: YOUR_API_ENDPOINT
headers:
Authorization: Basic
stream-name: default
service:
telemetry:
logs:
level: debug
pipelines:
metrics:
receivers: [statsd]
processors: [batch]
exporters: [logging, otlphttp/openobserve]
```
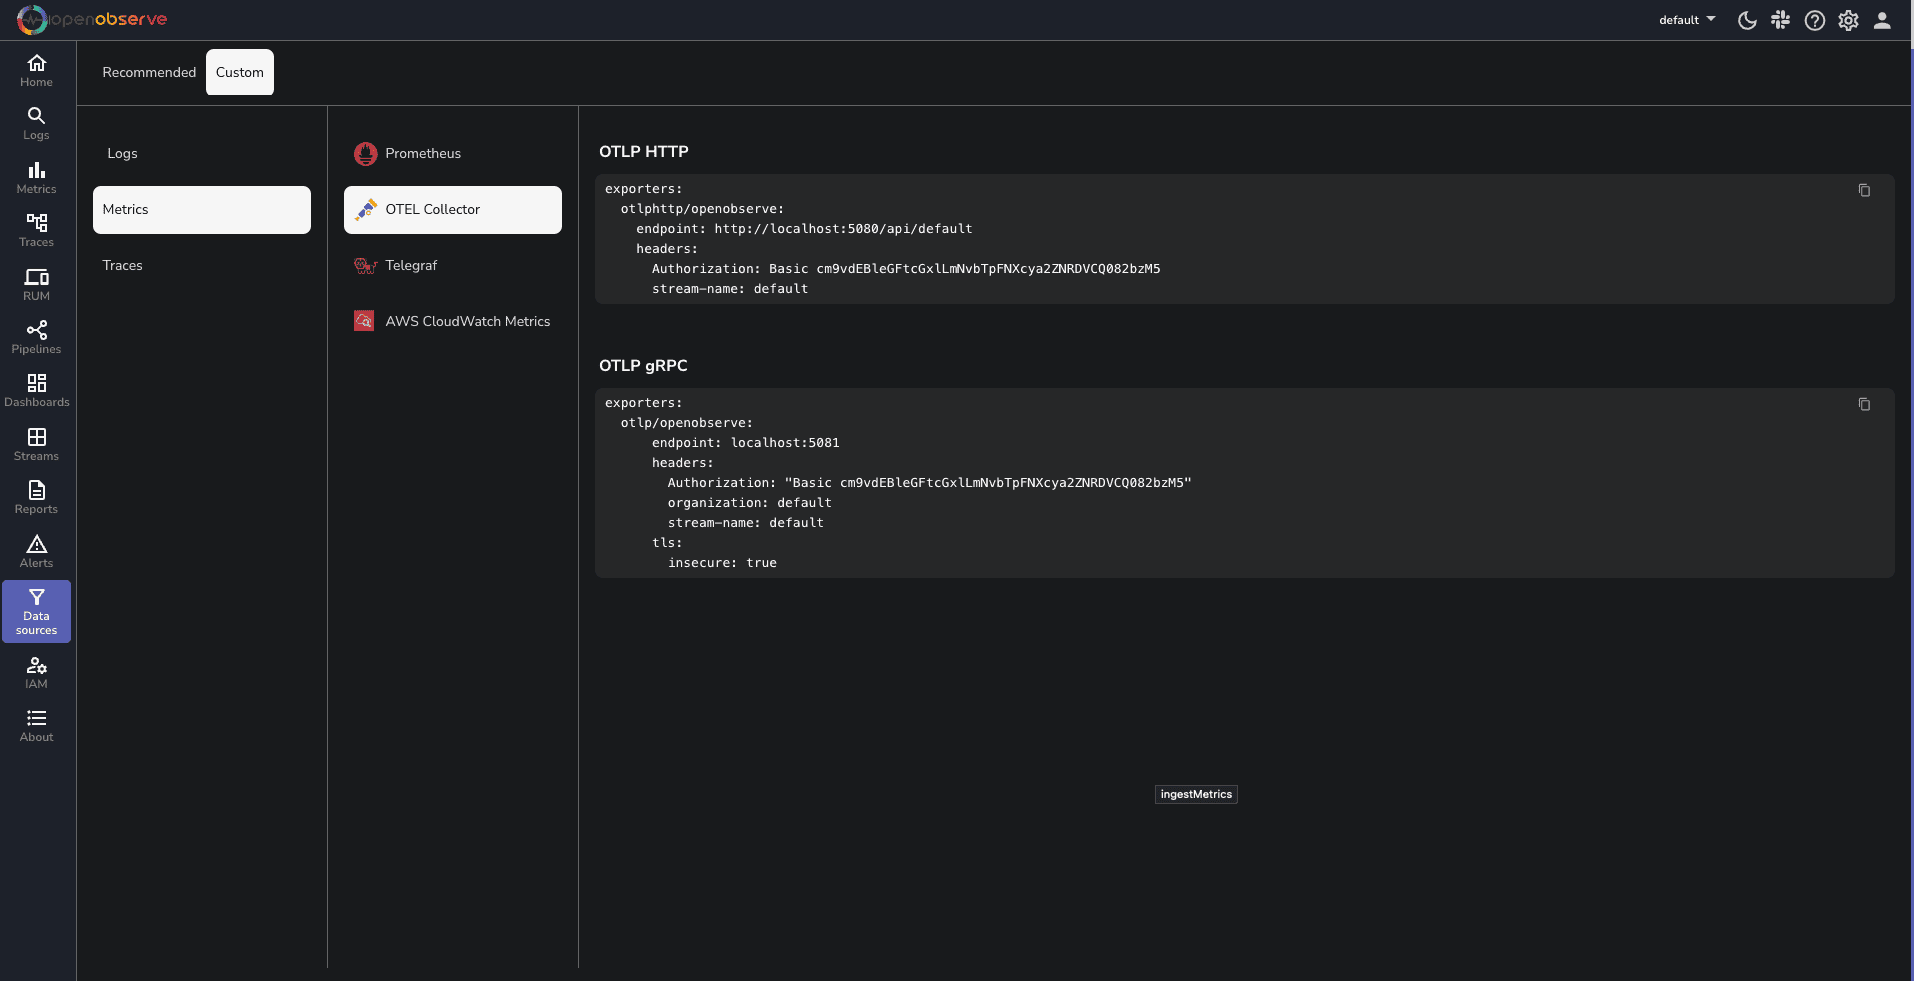
\*Replace `YOUR_API_ENDPOINT` and `YOUR_AUTH_TOKEN` with your actual OpenObserve API endpoint and authentication token, which you can find in your **Data Sources** -> **Custom** - > **Metrics** -> **Otel Collector\***
### Step 3: Configure the Datadog Agent
Edit the Datadog Agent configuration file `/opt/datadog-agent/etc/datadog.yaml`:
```yaml
## DogStatsD Configuration ##
use_dogstatsd: true
dogstatsd_port: 8125
dogstatsd_non_local_traffic: true
bind_host: 0.0.0.0
# Forward DogStatsD metrics
dogstatsd_forward_port: 8125 # Forward to OpenTelemetry StatsD receiver
dogstatsd_forward_host: localhost
# Debug settings
dogstatsd_stats_enable: true
dogstatsd_logging_enabled: true
log_level: debug
```
This configuration:
- Enables DogStatsD metric collection
- Sets up forwarding to the OpenTelemetry Collector
- Enables debug logging for troubleshooting
### Step 4: Start the Services
1. Start the OpenTelemetry Collector:
```bash
otelcol-contrib --config config.yaml
```
2. Restart the Datadog Agent to apply the new configuration:
```bash
sudo datadog-agent stop
sudo datadog-agent start
```
### Step 5: Verify the Metric Flow
After starting both services, you should see metrics flowing into OpenObserve. Here are some metrics you might see:
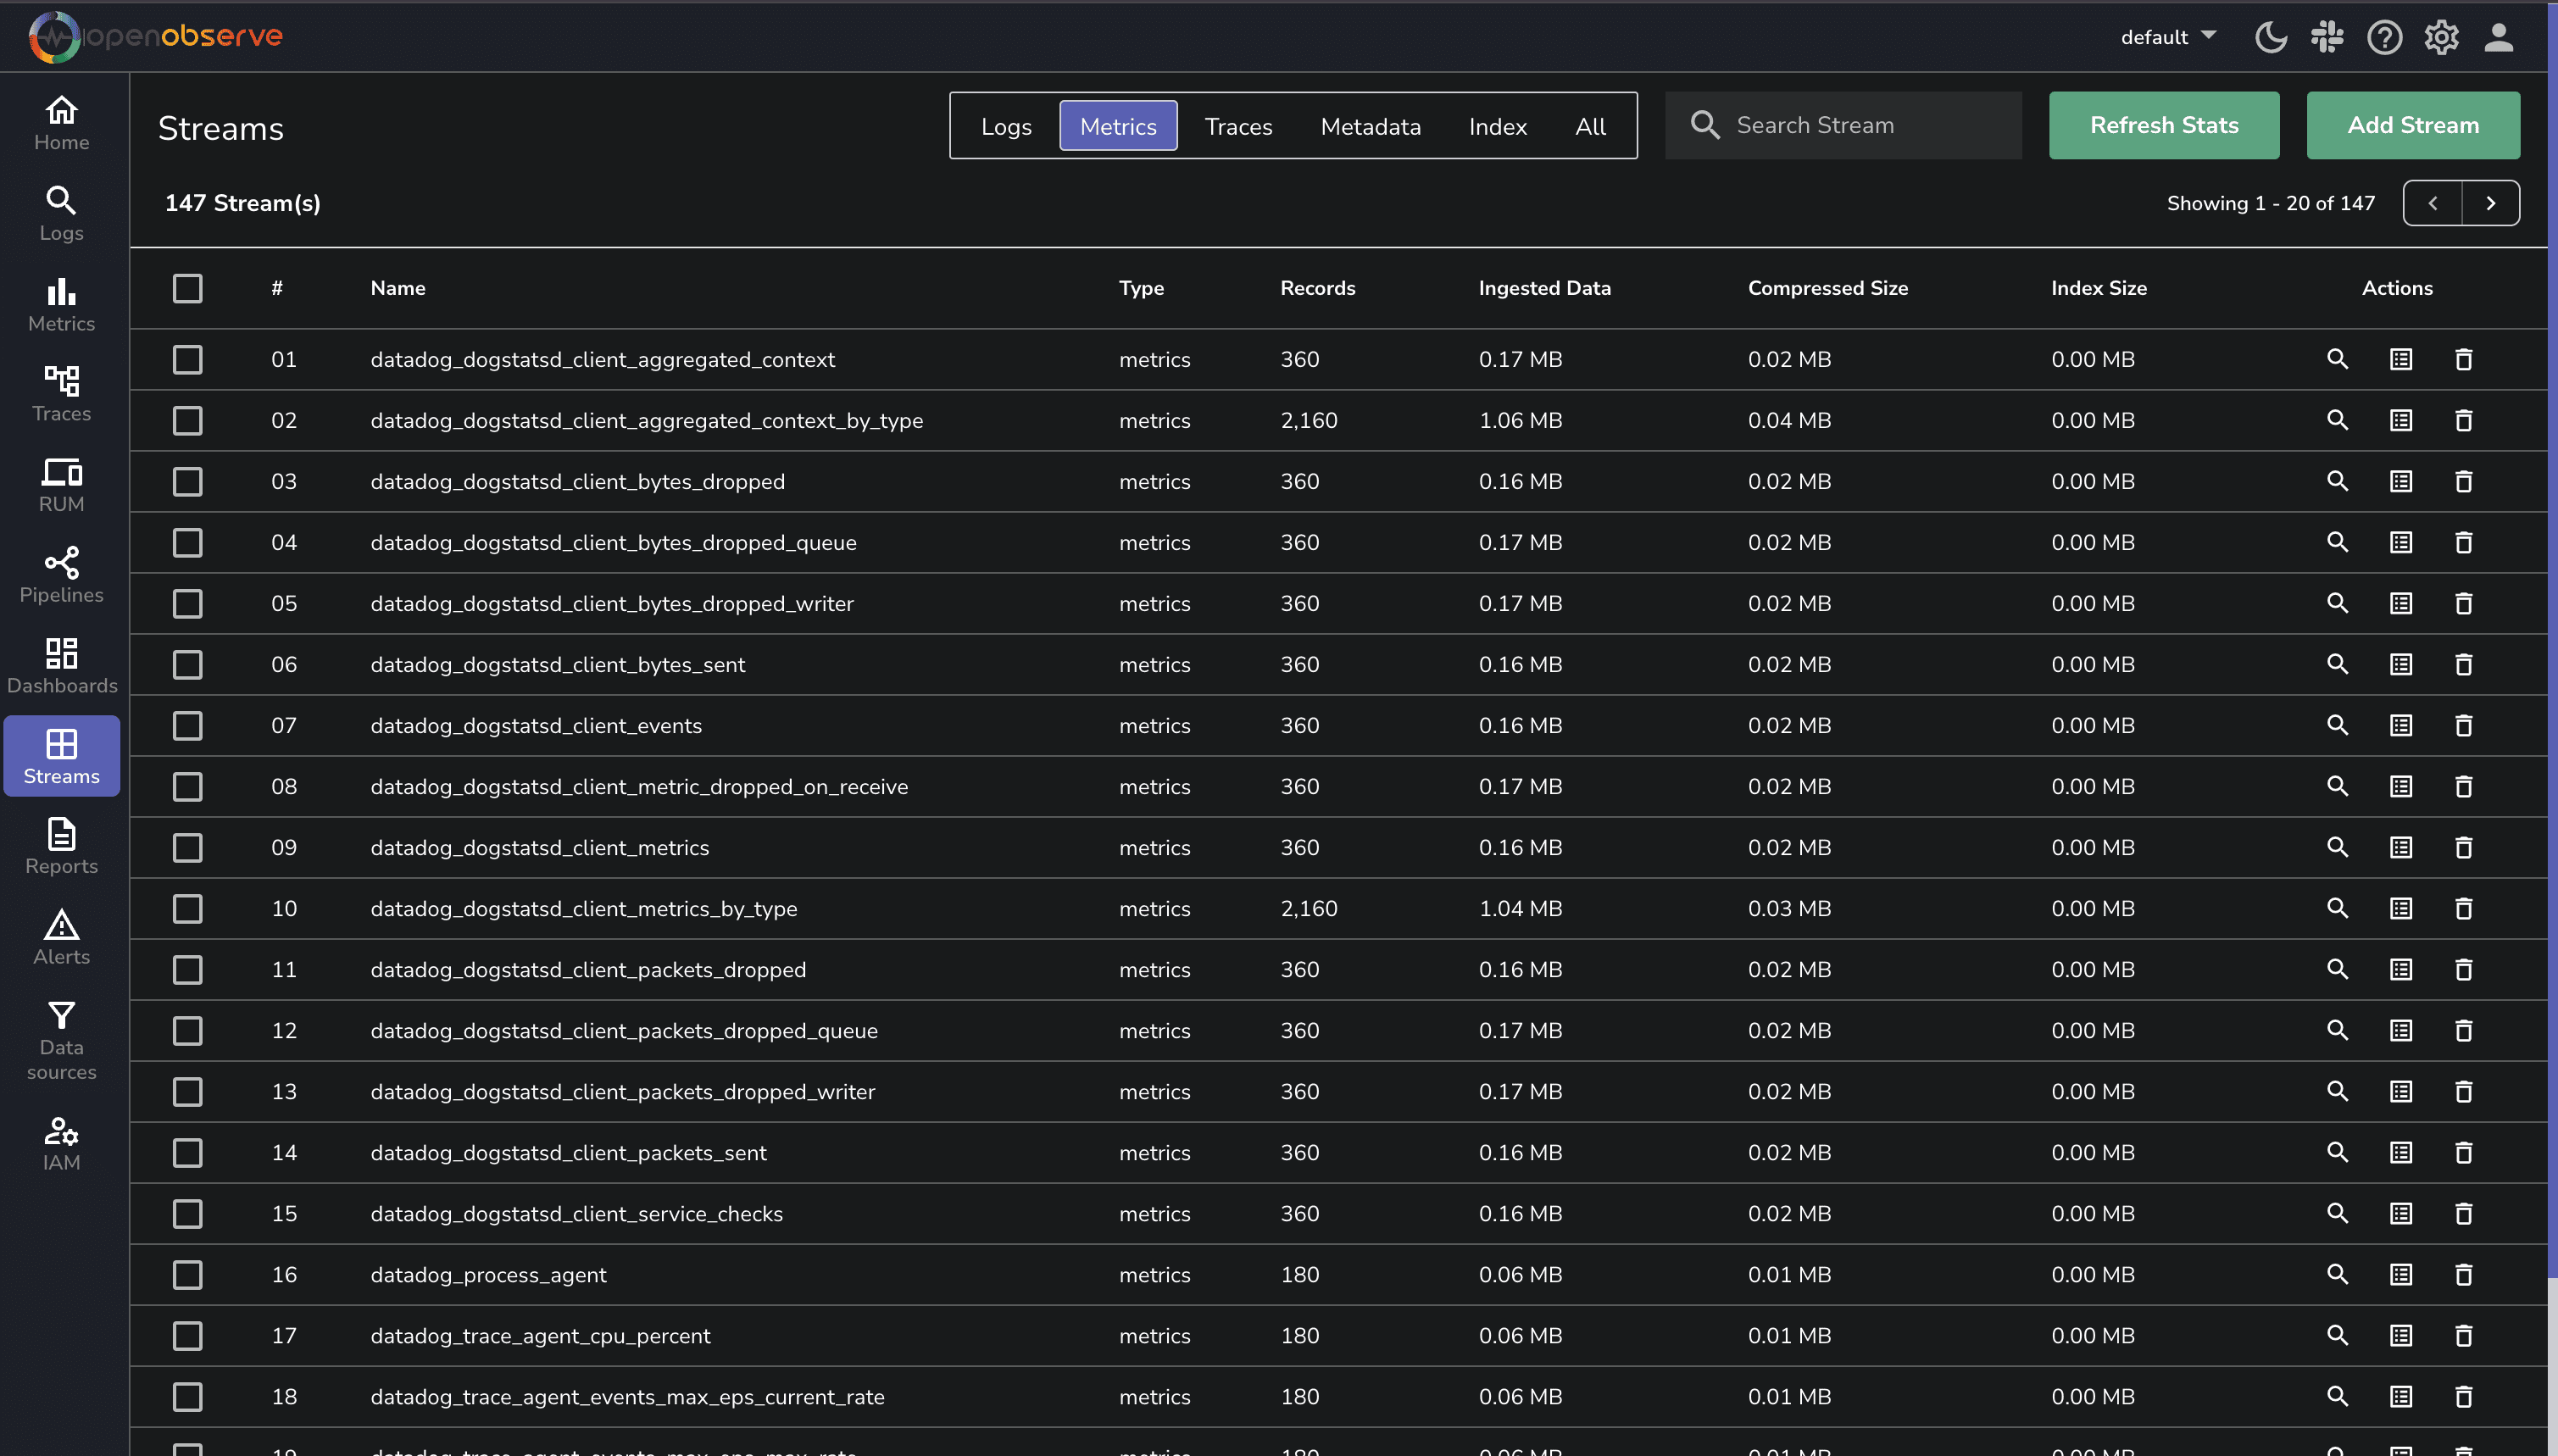
The StatsD receiver processes metrics through aggregation and translation. When the Datadog Agent collects metrics, it forwards them using the DogStatsD protocol in this format:
```bash
:||@|#:
```
The receiver then aggregates these metrics every 60 seconds based on their name, type, and labels. During this process, different metric types are translated:
- **Counters** become OpenTelemetry Sum metrics (integer values)
- **Gauges** are converted to OpenTelemetry Gauge metrics (double values)
- **Timers/Histograms** are transformed into OpenTelemetry Histogram metrics
To verify your setup is working correctly, you can send a test metric:
```bash
echo "test.metric:42|c|#myKey:myVal" | nc -w 1 -u localhost 8125
```
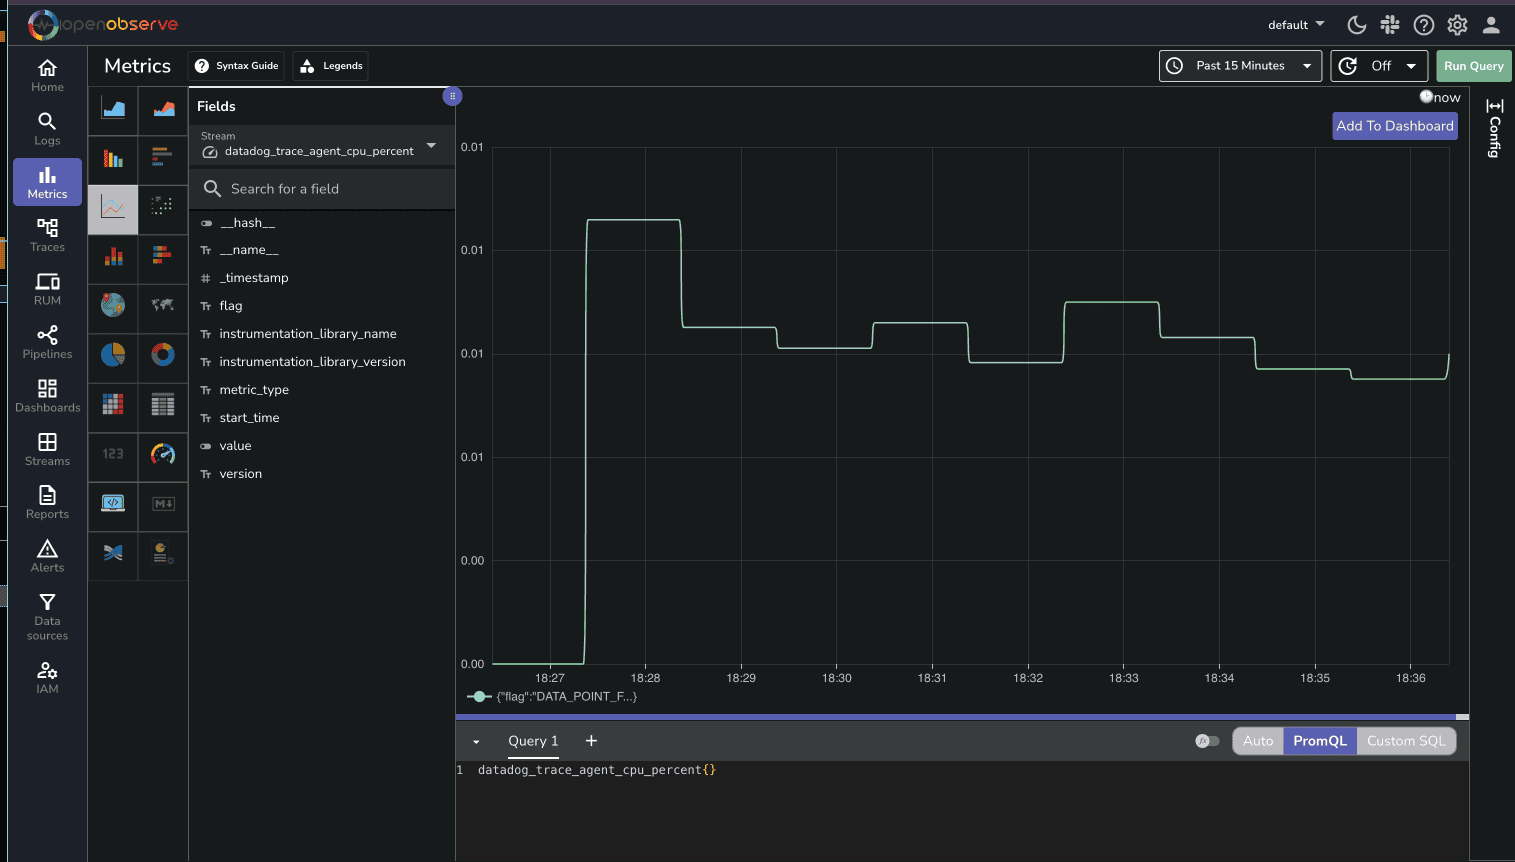
Then check your OpenObserve UI for metrics like `datadog_trace_agent_cpu_percent` and `datadog_dogstatsd_client_aggregated_context_by_type`.
## Toubleshooting
If you're experiencing issues with metric collection, start by checking the logs:
```bash
# Check Datadog Agent logs
sudo tail -f /var/log/datadog/dogstatsd.log
```
**Buffer Overflow**:
If you see "dropping last second stats, buffer full", adjust your batch processor configuration:
```yaml
processors:
batch:
send_batch_size: 20000 # Increase from default 10000
timeout: 20s # Increase processing window
```
**Connection Problems**
Verify your ports are available and network connectivity is working:
```bash
nc -zv localhost 8125 # Should connect to StatsD port
```
## Next Steps
Consider exploring the Datadog receiver for more advanced use cases. It provides native support for Datadog's APM traces and better handling of Datadog's API endpoints.
For production deployments, monitor your metric pipeline and set up alerts in OpenObserve to catch any issues early. You might also want to explore custom metric transformations and implement trace collection.
**Useful Resources:**
- StatsD Receiver Documentation
- OpenTelemetry Collector Configuration