# Loki Migration Guide: Moving from Grafana Loki to OpenObserve
> Move logs from Grafana Loki to OpenObserve: repoint Alloy, Promtail, the OpenTelemetry Collector, Fluent Bit, or Vector, run both side by side, translate LogQL to SQL, and rebuild dashboards and alerts.
Source: https://openobserve.ai/blog/migrate-loki-to-openobserve/
Published: 2026-11-17
Authors: Manas Sharma
Category: How To
Tags: OpenObserve, Logging, Integrations, OpenTelemetry, Comparisons
---
**Loki migration** to OpenObserve is mostly a change of push URL: OpenObserve accepts Loki's push API, so Grafana Alloy, Promtail, and other Loki clients can send to it with a new endpoint and credentials. This guide covers repointing each collector, running both backends side by side, translating LogQL to SQL, and moving dashboards and alerts.
## TL;DR
- **Migrating from Loki to OpenObserve starts with the collectors**: point Alloy's `loki.write`, Promtail's client, or your other shippers at OpenObserve's Loki-compatible push endpoint.
- **Promtail is end of life as of March 2, 2026**, so move Promtail pipelines to Grafana Alloy or the OpenTelemetry Collector as part of the migration.
- **Run both backends in parallel** for a few days by sending to Loki and OpenObserve at once, then compare results before cutting over.
- **OpenObserve is the better home for Loki users' logs**: full-text search and SQL on every field, columnar storage on object storage, and metrics, traces, dashboards, and alerts in the same platform.
## Why migrate from Grafana Loki to OpenObserve?
Loki indexes labels, not log content. That keeps ingestion simple, but it shapes everything you do afterwards:
- **Searching inside log lines scans chunks** for the selected streams, so broad searches over long ranges get slow.
- **Labels must stay low-cardinality.** Grafana's documentation warns that high cardinality causes Loki "to build a huge index, and to flush thousands of tiny chunks to the object store," which "can lead to significant performance degradation." (Source: Grafana Loki docs, Cardinality, November 2026)
- **Logs are one piece of the stack.** Metrics, traces, dashboards, and alerting live in other Grafana components to deploy and connect.
OpenObserve stores logs as compressed Parquet on object storage, with SQL and full-text search across every field, so a value like `user_id` or `trace_id` can be a searchable field without becoming a label. For the full picture of replacing every Grafana component, see [replacing the Grafana LGTM stack](/blog/replacing-grafana-lgtm-stack/).
## Can OpenObserve receive logs from Promtail and Alloy?
Yes. OpenObserve implements the Grafana Loki push API at `POST /api//loki/api/v1/push`, so any Loki client, including Promtail, Grafana Agent, and Alloy, can send to it without a plugin. The endpoint accepts the snappy-compressed Protobuf that Promtail sends as well as JSON (optionally gzip-compressed), reads nanosecond timestamps, keeps Loki stream labels as fields, and returns `204 No Content` on success, just like Loki. (Source: OpenObserve docs, [Loki ingestion API](https://openobserve.ai/docs/reference/api/ingestion/logs/loki/), November 2026)
That means a Loki migration usually starts with a one-line change in each collector:
## Prerequisites
- An OpenObserve instance: [OpenObserve Cloud](https://cloud.openobserve.ai) or self-hosted.
- Your organization name (for example `default`) and an ingestion user's email and password or token.
- Access to your collector configurations: Alloy, Promtail, the OpenTelemetry Collector, Fluent Bit, or Vector.
## Step 1: Repoint Grafana Alloy
Add a `loki.write` component that sends to OpenObserve. OpenObserve's Loki-compatible push endpoint is `/api//loki/api/v1/push`. (Source: OpenObserve docs, Migrate logs from Grafana Loki, November 2026)
```alloy
loki.write "openobserve" {
endpoint {
url = "https:///api//loki/api/v1/push"
basic_auth {
username = ""
password = ""
}
}
}
```
Then add `loki.write.openobserve.receiver` to the `forward_to` list of the components that currently forward to Loki. Keep your existing Loki receiver in the list for now; Step 4 uses both.
Logs go to the stream named by an `o2_stream_name` or `stream_name` label, or to `default` if neither is set. Add one of those labels in your relabel rules to keep, say, application and infrastructure logs in separate streams.
## Step 2: Repoint Promtail, then plan its replacement
If you still run Promtail, change its client URL:
```yaml
clients:
- url: https:///api//loki/api/v1/push
basic_auth:
username:
password:
```
Grafana's documentation says Promtail is end of life as of March 2, 2026, with all future development in Grafana Alloy, and provides a tool to convert Promtail configurations to Alloy. (Source: Grafana Loki docs, Promtail agent, November 2026) Repointing Promtail gets data flowing today; schedule the move to Alloy or the OpenTelemetry Collector soon after.
## Step 3: Repoint the OpenTelemetry Collector, Fluent Bit, or Vector
Other shippers switch from a Loki output to OpenObserve's native endpoints:
| Collector | Change | Where to get the new config |
|---|---|---|
| OpenTelemetry Collector | Replace the `loki` exporter with `otlphttp` | **Data > Data sources > Custom > Logs > OTEL Collector** |
| Fluent Bit | Replace the `loki` output with `http` | **Data > Data sources > Custom > Logs > FluentBit** |
| Vector | Replace the `loki` sink with `http` | **Data > Data sources > Custom > Logs > Vector** |
The OpenObserve UI generates each config with your endpoint and credentials filled in. Open **Data sources**, choose **Custom > Logs**, and select your collector:
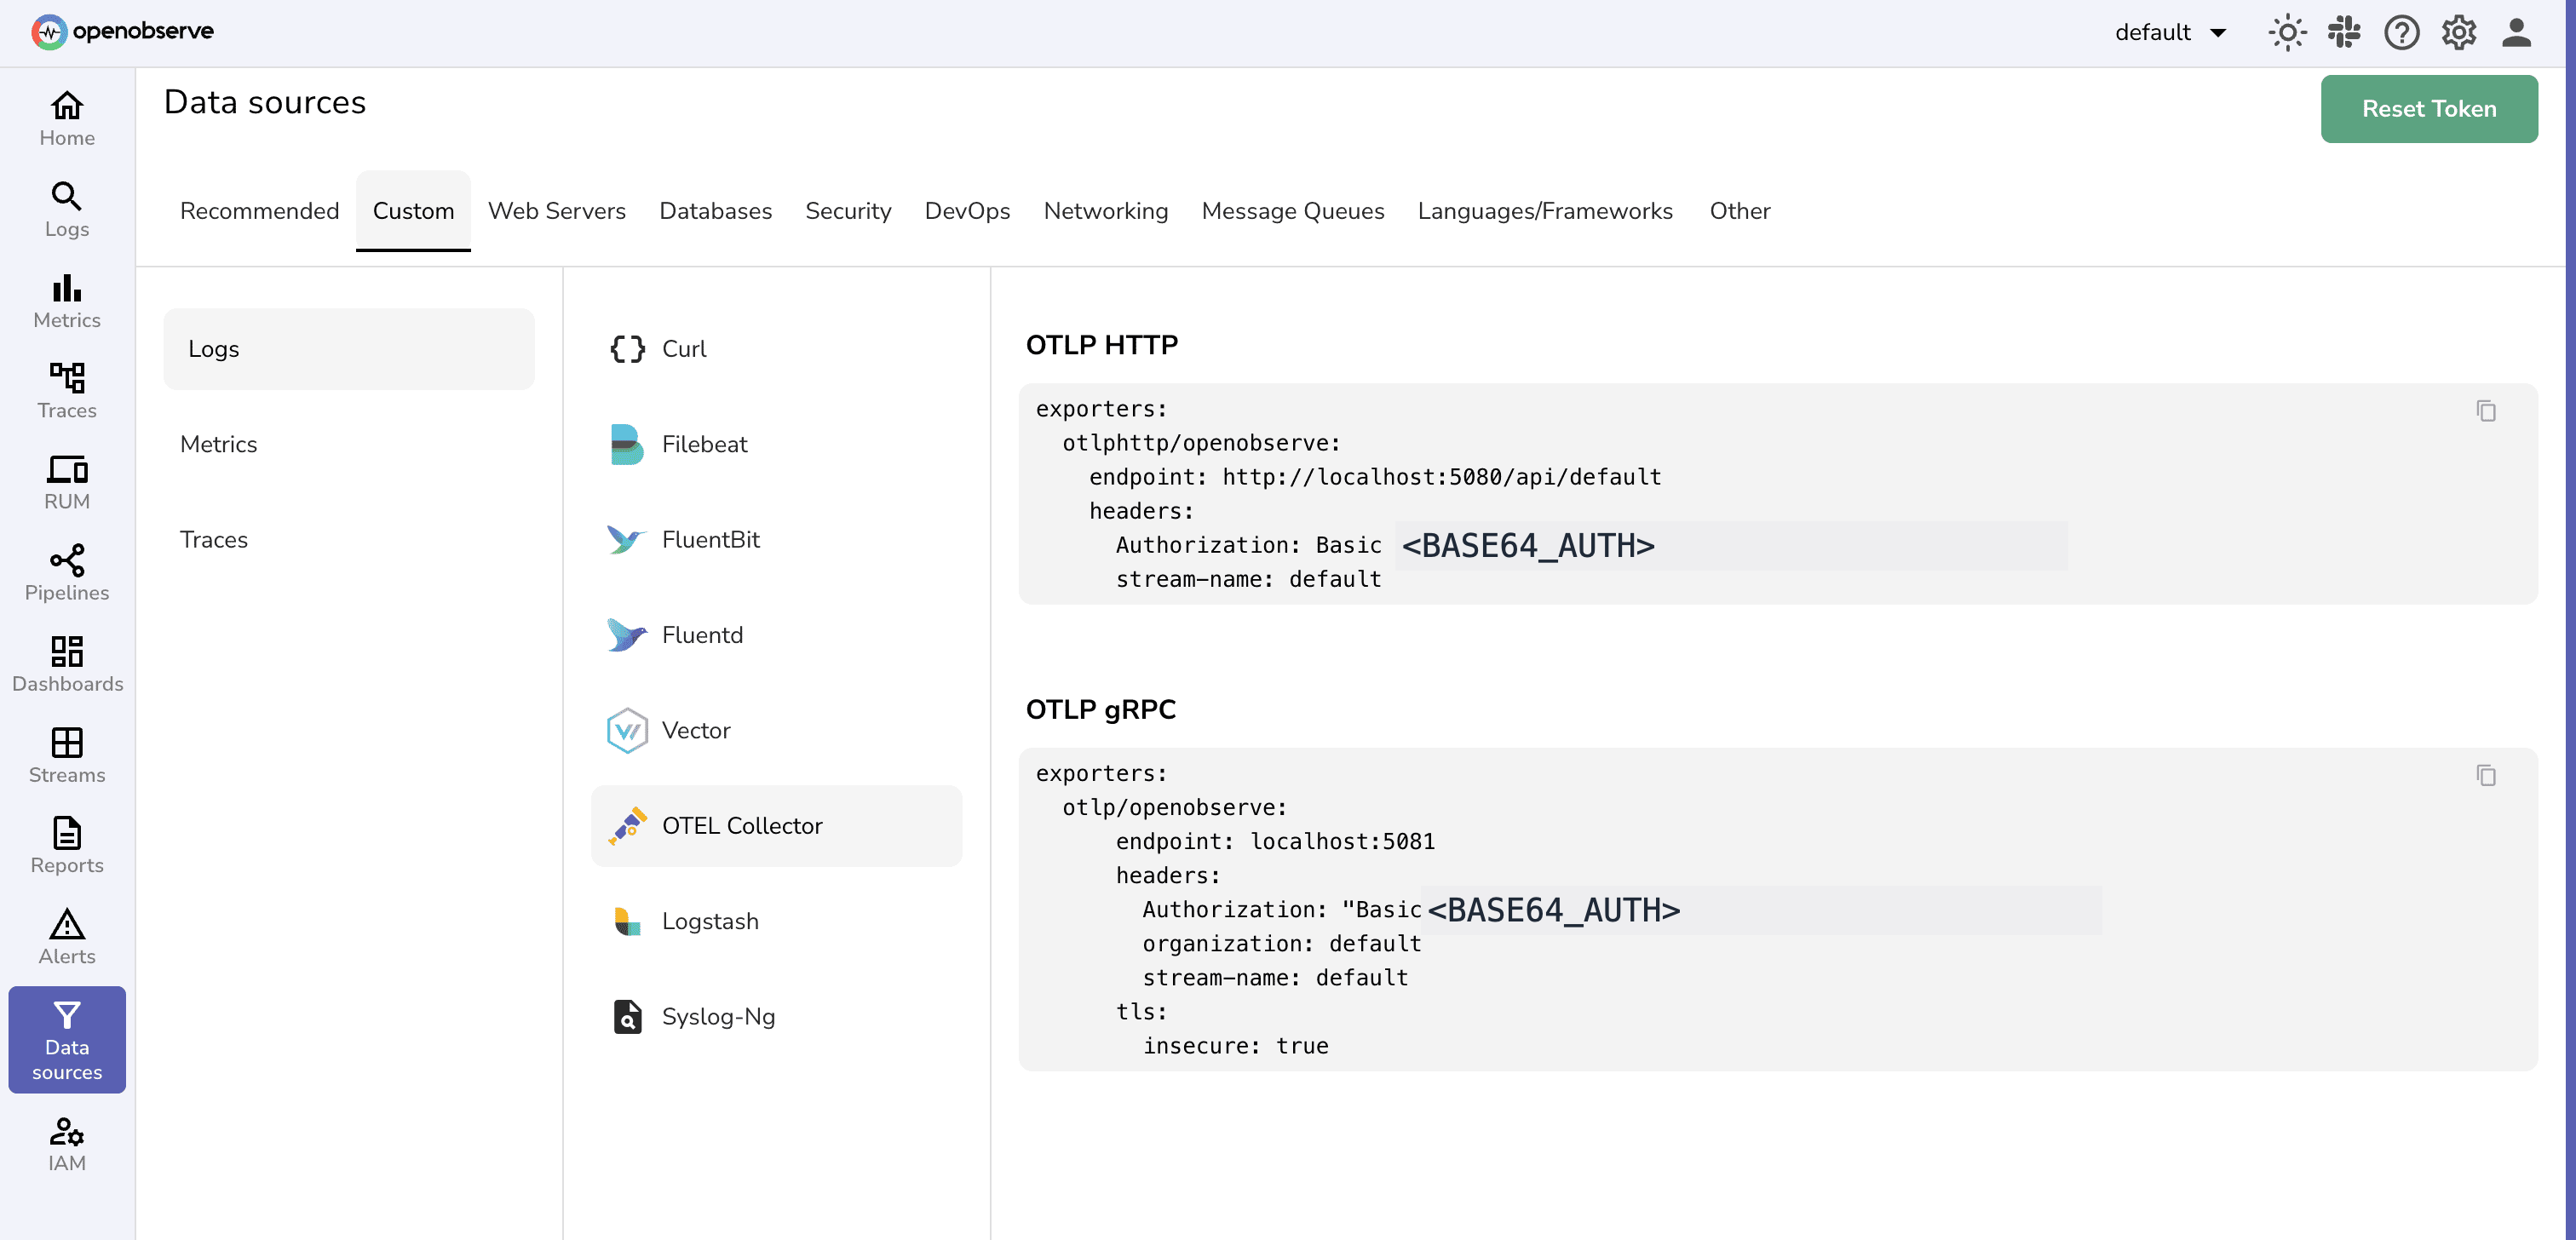
Copy the exporter block into your collector configuration. If you're choosing a new shipper anyway, the OpenTelemetry Collector keeps logs, metrics, and traces on one pipeline; see our comparison of [telemetry agents](/blog/best-telemetry-agents/).
## Step 4: Run Loki and OpenObserve side by side
Send to both backends for a few days before cutting over. In Alloy, list both receivers:
```alloy
loki.source.file "app" {
targets = local.file_match.app.targets
forward_to = [loki.write.loki.receiver, loki.write.openobserve.receiver]
}
```
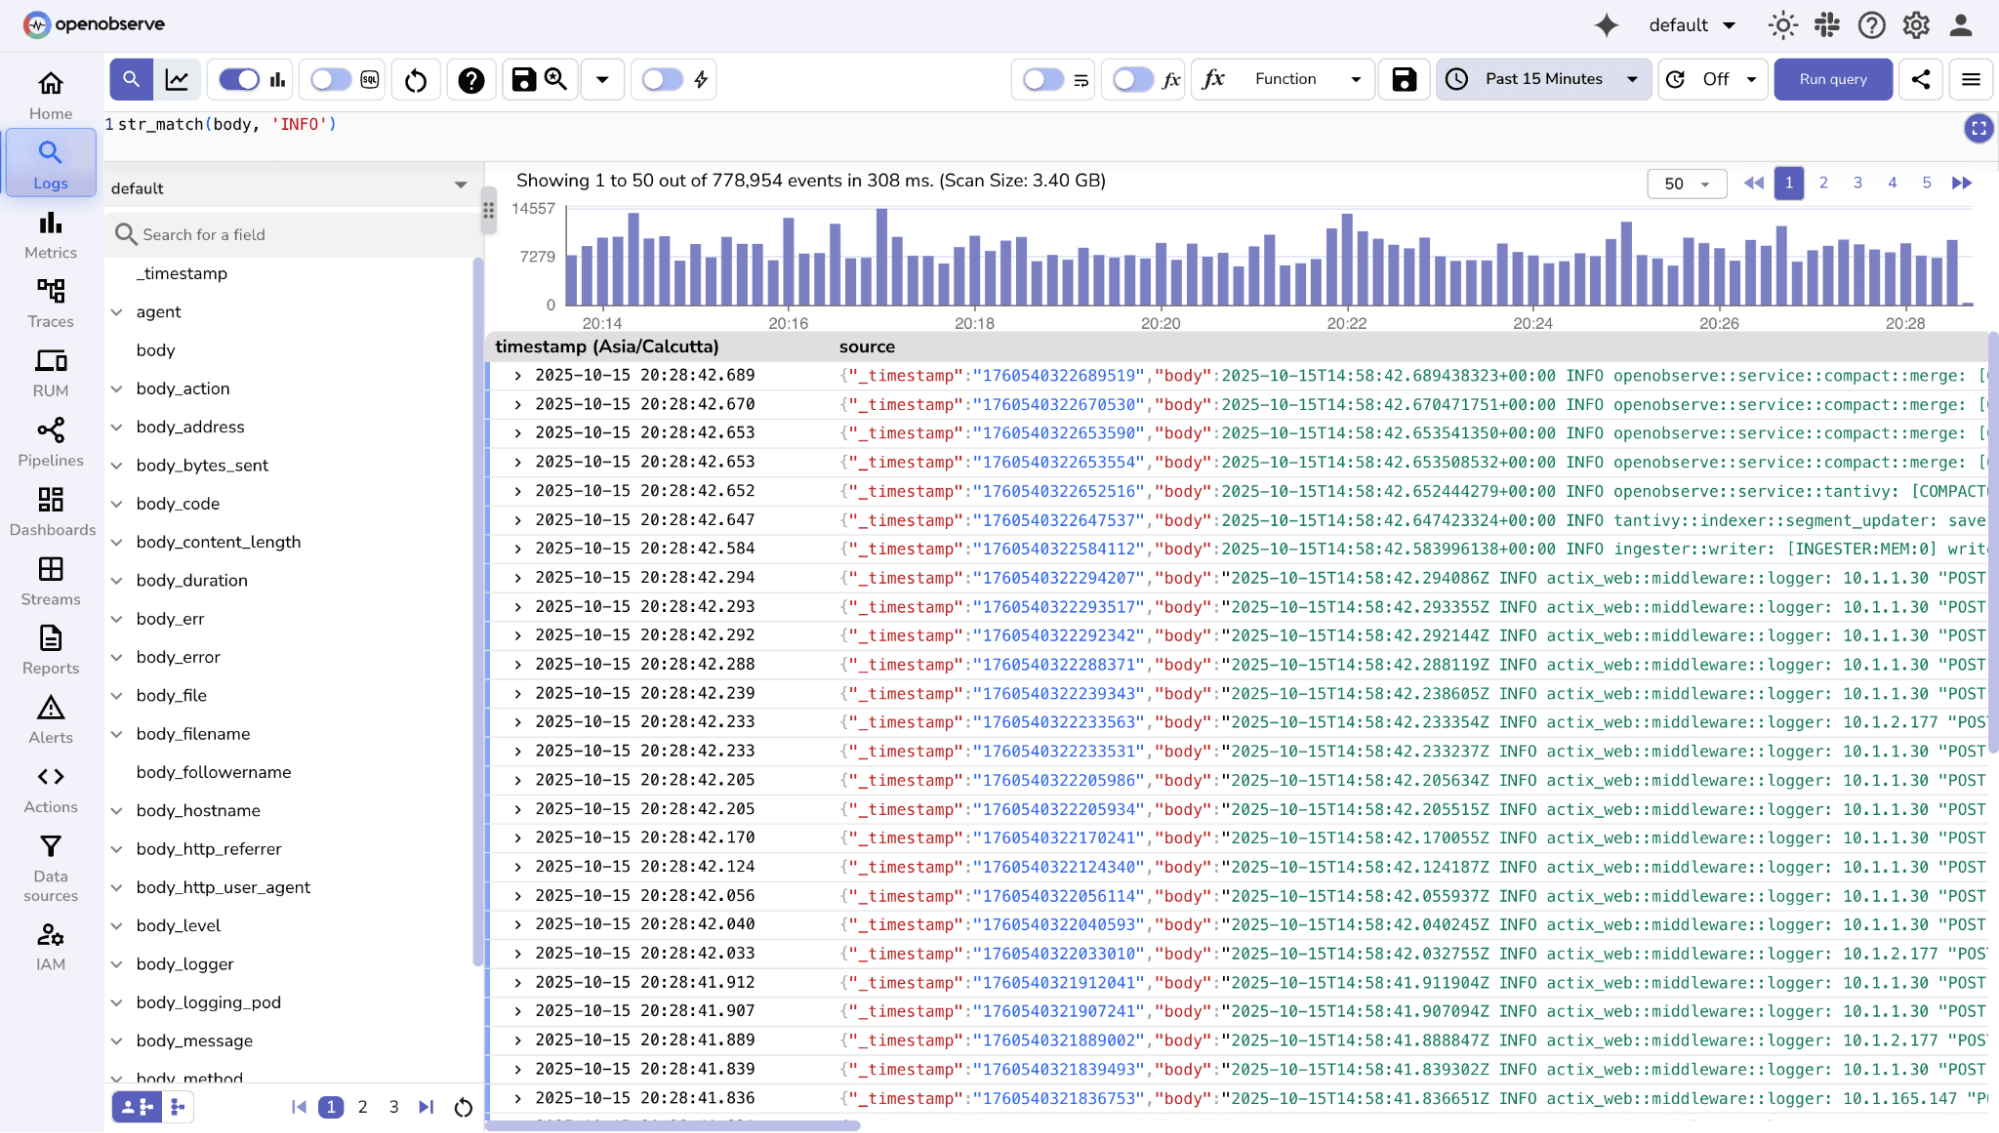
During the overlap, compare event counts per stream and check that the fields you filter on, such as `level`, `service`, and `trace_id`, appear as columns in OpenObserve.
## Step 5: Verify logs in OpenObserve
Open **Logs**, select your stream, and run:
```sql
SELECT * FROM "default" ORDER BY _timestamp DESC
```
If no streams appear, check the collector's logs for HTTP errors and confirm the organization in the URL path matches. If authentication fails, regenerate the Base64 credential, because stray whitespace breaks it.
## Step 6: Translate LogQL queries to SQL
OpenObserve queries logs with SQL and [full-text search functions](https://openobserve.ai/docs/reference/sql-functions/full-text-search/). Common LogQL patterns map like this:
| Task | LogQL | OpenObserve SQL |
|---|---|---|
| Select a stream | `{app="checkout"}` | `SELECT * FROM "default" WHERE app = 'checkout'` |
| Line contains text | `{app="checkout"} \|= "timeout"` | `SELECT * FROM "default" WHERE app = 'checkout' AND match_all('timeout')` |
| Field contains text | `{app="checkout"} \| json \| msg=~".*timeout.*"` | `SELECT * FROM "default" WHERE str_match(msg, 'timeout')` |
| Regex match | `{app="checkout"} \|~ "5\\d\\d"` | `SELECT * FROM "default" WHERE re_match(message, '5\d\d')` |
| Count over time | `count_over_time({app="checkout"} \|= "error" [5m])` | `SELECT histogram(_timestamp, '5m') AS t, COUNT(*) AS errors FROM "default" WHERE app = 'checkout' AND match_all('error') GROUP BY t ORDER BY t` |
| Count by field | `sum by (level) (count_over_time({app="checkout"} [5m]))` | `SELECT level, COUNT(*) AS n FROM "default" WHERE app = 'checkout' GROUP BY level` |
Because every JSON field is a column at ingestion, you rarely need a parsing stage like `| json` in the query.
## Step 7: Rebuild dashboards and alerts
- **Dashboards:** recreate panels with SQL or PromQL in OpenObserve dashboards, which support variables and scheduled PDF, PNG, or CSV reports. Our guide to [migrating dashboards from Grafana, Datadog, Kibana, and CloudWatch](/blog/migrate-dashboards-datadog-grafana-kibana-cloudwatch-openobserve/) walks through it.
- **Alerts:** turn Loki ruler alerts into [OpenObserve alerts](https://openobserve.ai/docs/user-guide/analytics/alerts/). A scheduled alert runs a SQL query like the count-over-time example above and fires when the count crosses a threshold; real-time alerts evaluate as data arrives.
## Step 8: Cut over and retire Loki
1. Remove the Loki receiver from `forward_to` and from other shippers.
2. Keep Loki read-only until its retention period has passed, or until you no longer need older data.
3. Set retention per stream in OpenObserve, and use extended retention for the time ranges you need to keep longer.
## Loki migration checklist
- [ ] Every Alloy `loki.write`, Promtail client, and other shipper points at `/api//loki/api/v1/push` or an OpenObserve native endpoint.
- [ ] Streams are named with an `o2_stream_name` label so logs don't all land in `default`.
- [ ] Both backends received the same data for a few days, and event counts match.
- [ ] Fields you filter on (`level`, `service`, `trace_id`) appear as columns.
- [ ] Saved LogQL queries are rewritten in SQL.
- [ ] Grafana dashboards and Loki ruler alerts are rebuilt in OpenObserve.
- [ ] Promtail is replaced with Alloy or the OpenTelemetry Collector.
- [ ] Retention is set per stream, and Loki is retired after its retention period.
## What you get after migrating
OpenObserve is an open-source (AGPL-3.0) observability platform, so your logs land next to everything else Loki users usually run separately:
- **Telemetry:** logs, metrics (PromQL and SQL), and traces with a service graph and service catalog, plus continuous profiles.
- **Frontend monitoring:** real user monitoring (RUM), session replay, and error tracking.
- **Synthetic monitoring:** scheduled browser and protocol checks.
- **AI:** AI Assistant, SRE Agent for AI root cause analysis, an MCP server, LLM observability and evaluations, anomaly detection, log patterns, and insights.
- **Alerting and reliability:** scheduled, real-time, composite, and anomaly alerts, incident management, and SLOs with error budgets and burn rates.
- **Dashboards and reports:** real-time dashboards and scheduled PDF, PNG, or CSV reports.
- **Data processing:** pipelines, VRL functions, enrichment tables, and metrics downsampling.
- **Storage and cost:** Parquet on object storage, Bring Your Own Bucket, extended retention, and ingest-based pricing with no per-host or per-user fees.
- **Security and governance:** SSO, RBAC, multi-tenancy, sensitive data redaction, audit trail, cipher keys, and federated search.
- **Compliance:** SOC 2 Type II, ISO 27001, and GDPR via the EU-Central 1 (Frankfurt) region.
- **Open standards:** OpenTelemetry-native ingestion, Loki-compatible push, and PromQL and SQL querying.
For a side-by-side comparison first, read [OpenObserve vs Grafana](/blog/openobserve-vs-grafana/).
## Get started with OpenObserve
- Start a free trial of [OpenObserve Cloud](https://cloud.openobserve.ai) and point one Alloy pipeline at it.
- Follow the [Loki migration docs](https://openobserve.ai/docs/migration/migrate-from-grafana-to-openobserve/logs/) for every collector.
- Related reading: [replacing the Grafana LGTM stack](/blog/replacing-grafana-lgtm-stack/).