# Monitoring ArgoCD Deployments with Prometheus and OpenObserve
> Unlock the full potential of your ArgoCD deployments with Prometheus and OpenObserve monitoring. Get real-time insights into application health, sync status, and reconciliation performance.
Source: https://openobserve.ai/blog/monitor-argo-cd-with-openobserve/
Published: 2025-04-10
Authors: Manas Sharma
Category: How To
Tags: DevOps, Integrations
---
## Introduction to GitOps and Argo CD
Argo CD is a leading open-source declarative GitOps continuous delivery tool for Kubernetes. With over 14,000 GitHub stars and a growing community, it has become the de facto standard for implementing GitOps workflows. GitOps is a paradigm where the desired state of your infrastructure is defined in Git repositories, and automated processes ensure the actual state matches this definition.
In the GitOps model implemented by Argo CD:
1. The desired state of applications is versioned in Git
2. Changes to infrastructure are made via pull requests
3. Automated systems detect and reconcile drift between desired and actual states
4. The entire system becomes auditable, traceable, and reproducible
Argo CD implements these principles through three main components:
- **API Server**: Exposes the API for the web UI, CLI, handles auth, and manages application deployments
- **Repository Server**: Maintains a local cache of Git repositories and generates Kubernetes manifests
- **Application Controller**: Continuously compares the actual state in the cluster with the desired state in Git
As organizations adopt Argo CD for production workloads, monitoring becomes crucial for ensuring reliability and performance.
## Prerequisites
- A running Kubernetes cluster
- Argo CD installed on the cluster
- OpenObserve account or self-hosted instance
- kubectl and helm installed on your workstation
## Understanding Argo CD Metrics
Argo CD exposes Prometheus metrics from several components:
1. **Application Controller** (port 8082): Provides metrics about applications, their sync status, and reconciliation performance
2. **API Server** (port 8083): Offers metrics about API requests and responses
3. **Repo Server** (port 8084): Exposes metrics about Git operations and repository management
4. **ApplicationSet Controller** (port 8080): Provides metrics for application sets
5. **Redis HA Proxy** (port 9101): Metrics for the Redis high-availability setup
6. **Notifications Controller** (port 9001): Metrics for the notifications system
Some of the most critical metrics to monitor include:
- `argocd_app_info`: Information about applications with labels for sync status and health status
- `argocd_app_reconcile`: Application reconciliation performance in seconds
- `argocd_app_sync_total`: Counter for application sync history
- `argocd_git_request_total`: Number of git requests performed
- `argocd_cluster_connection_status`: The Kubernetes cluster connection status
## Verifying Argo CD Metrics Exposure
First, let's verify that Argo CD services are running and exposing metrics:
```bash
kubectl get svc -n argocd
```
The output should show various Argo CD services including:
```
NAME TYPE CLUSTER-IP EXTERNAL-IP PORT(S) AGE
argocd-applicationset-controller ClusterIP 172.20.19.231 7000/TCP,8080/TCP 359d
argocd-metrics ClusterIP 172.20.112.153 8082/TCP 359d
argocd-notifications-controller-metrics ClusterIP 172.20.194.56 9001/TCP 359d
argocd-redis-ha-haproxy ClusterIP 172.20.162.192 6379/TCP,9101/TCP 359d
argocd-repo-server ClusterIP 172.20.39.109 8081/TCP,8084/TCP 359d
argocd-server-metrics ClusterIP 172.20.26.5 8083/TCP 359d
```
Check that metrics annotations are properly set in your Argo CD deployments:
```bash
kubectl get deployment argocd-redis-ha-haproxy -n argocd -o yaml | grep -A 10 annotations
```
You should see annotations like:
```yaml
annotations:
prometheus.io/path: /metrics
prometheus.io/port: "9101"
prometheus.io/scrape: "true"
```
If metrics annotations are missing, you may need to update your Argo CD deployment manifests to include them:
```yaml
apiVersion: apps/v1
kind: Deployment
metadata:
name: argocd-redis-ha-haproxy
# ...
spec:
template:
metadata:
annotations:
prometheus.io/path: /metrics
prometheus.io/port: "9101"
prometheus.io/scrape: "true"
```
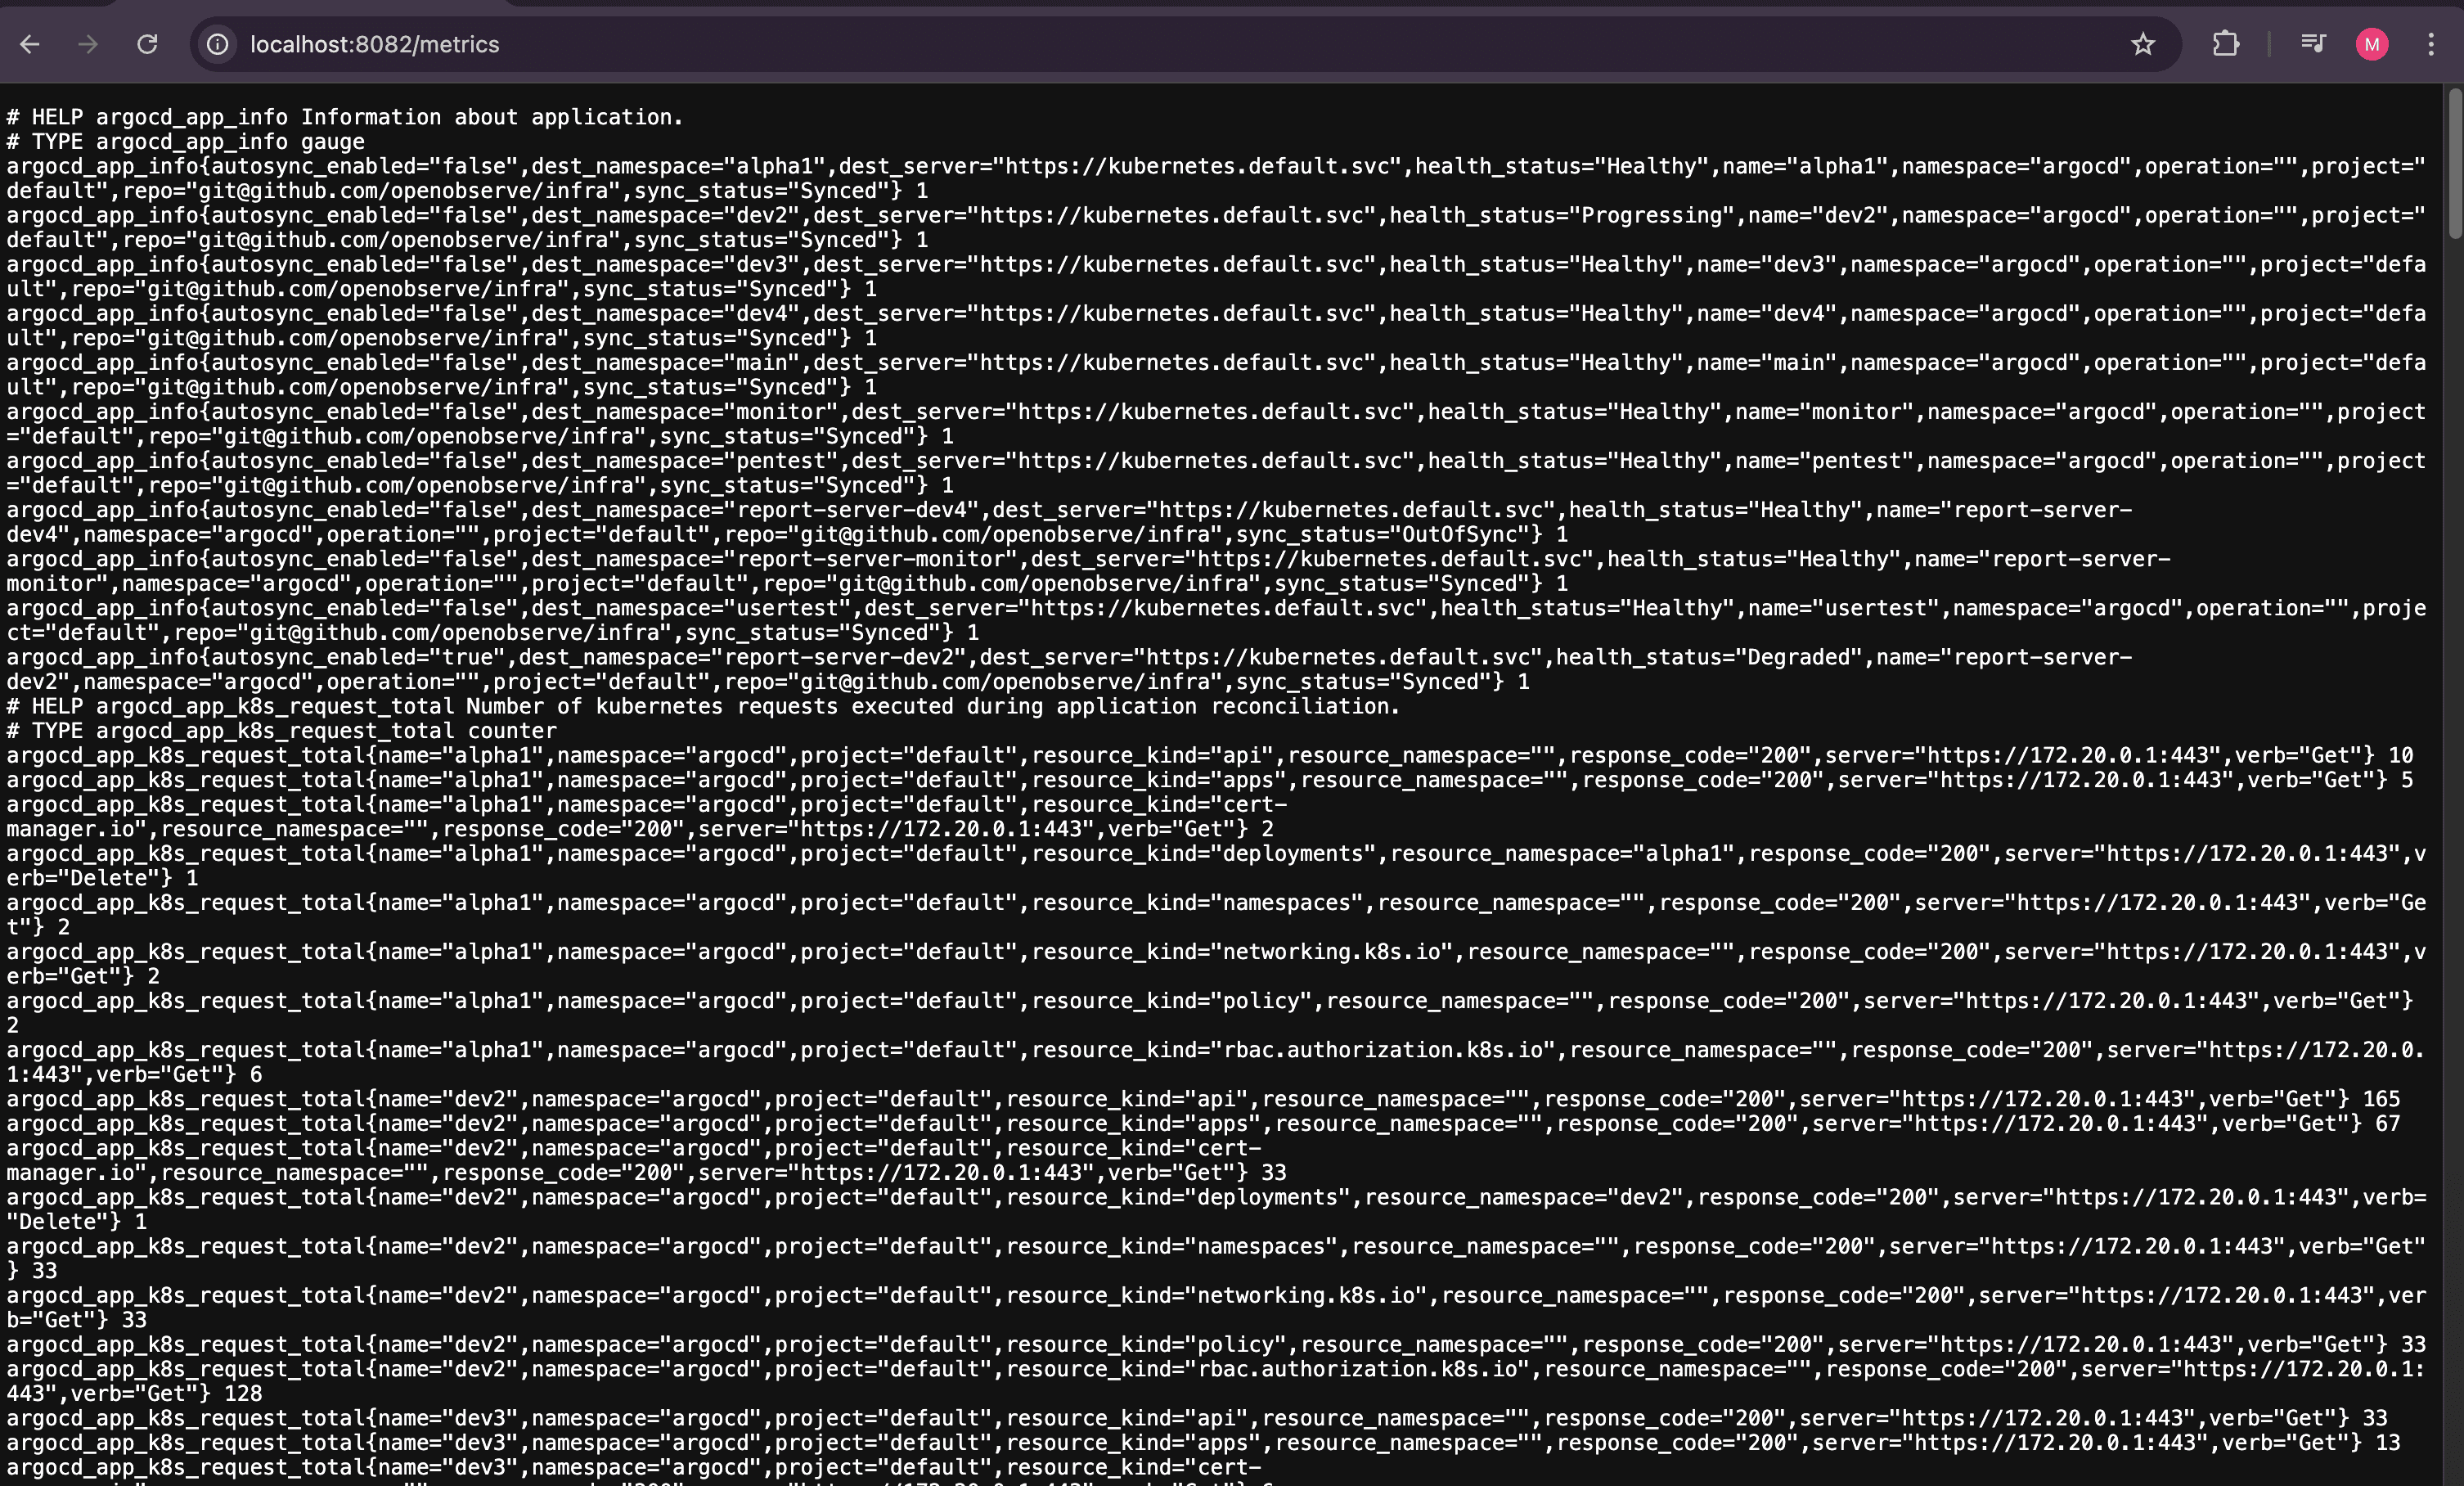
## Verifying Metrics Endpoints
You can verify that metrics are being exposed by port-forwarding to the respective services:
```bash
# For Application Controller metrics
kubectl port-forward svc/argocd-metrics -n argocd 8082:8082
```
In another terminal
```bash
curl http://localhost:8082/metrics
```
## Deploying OpenObserve Collector
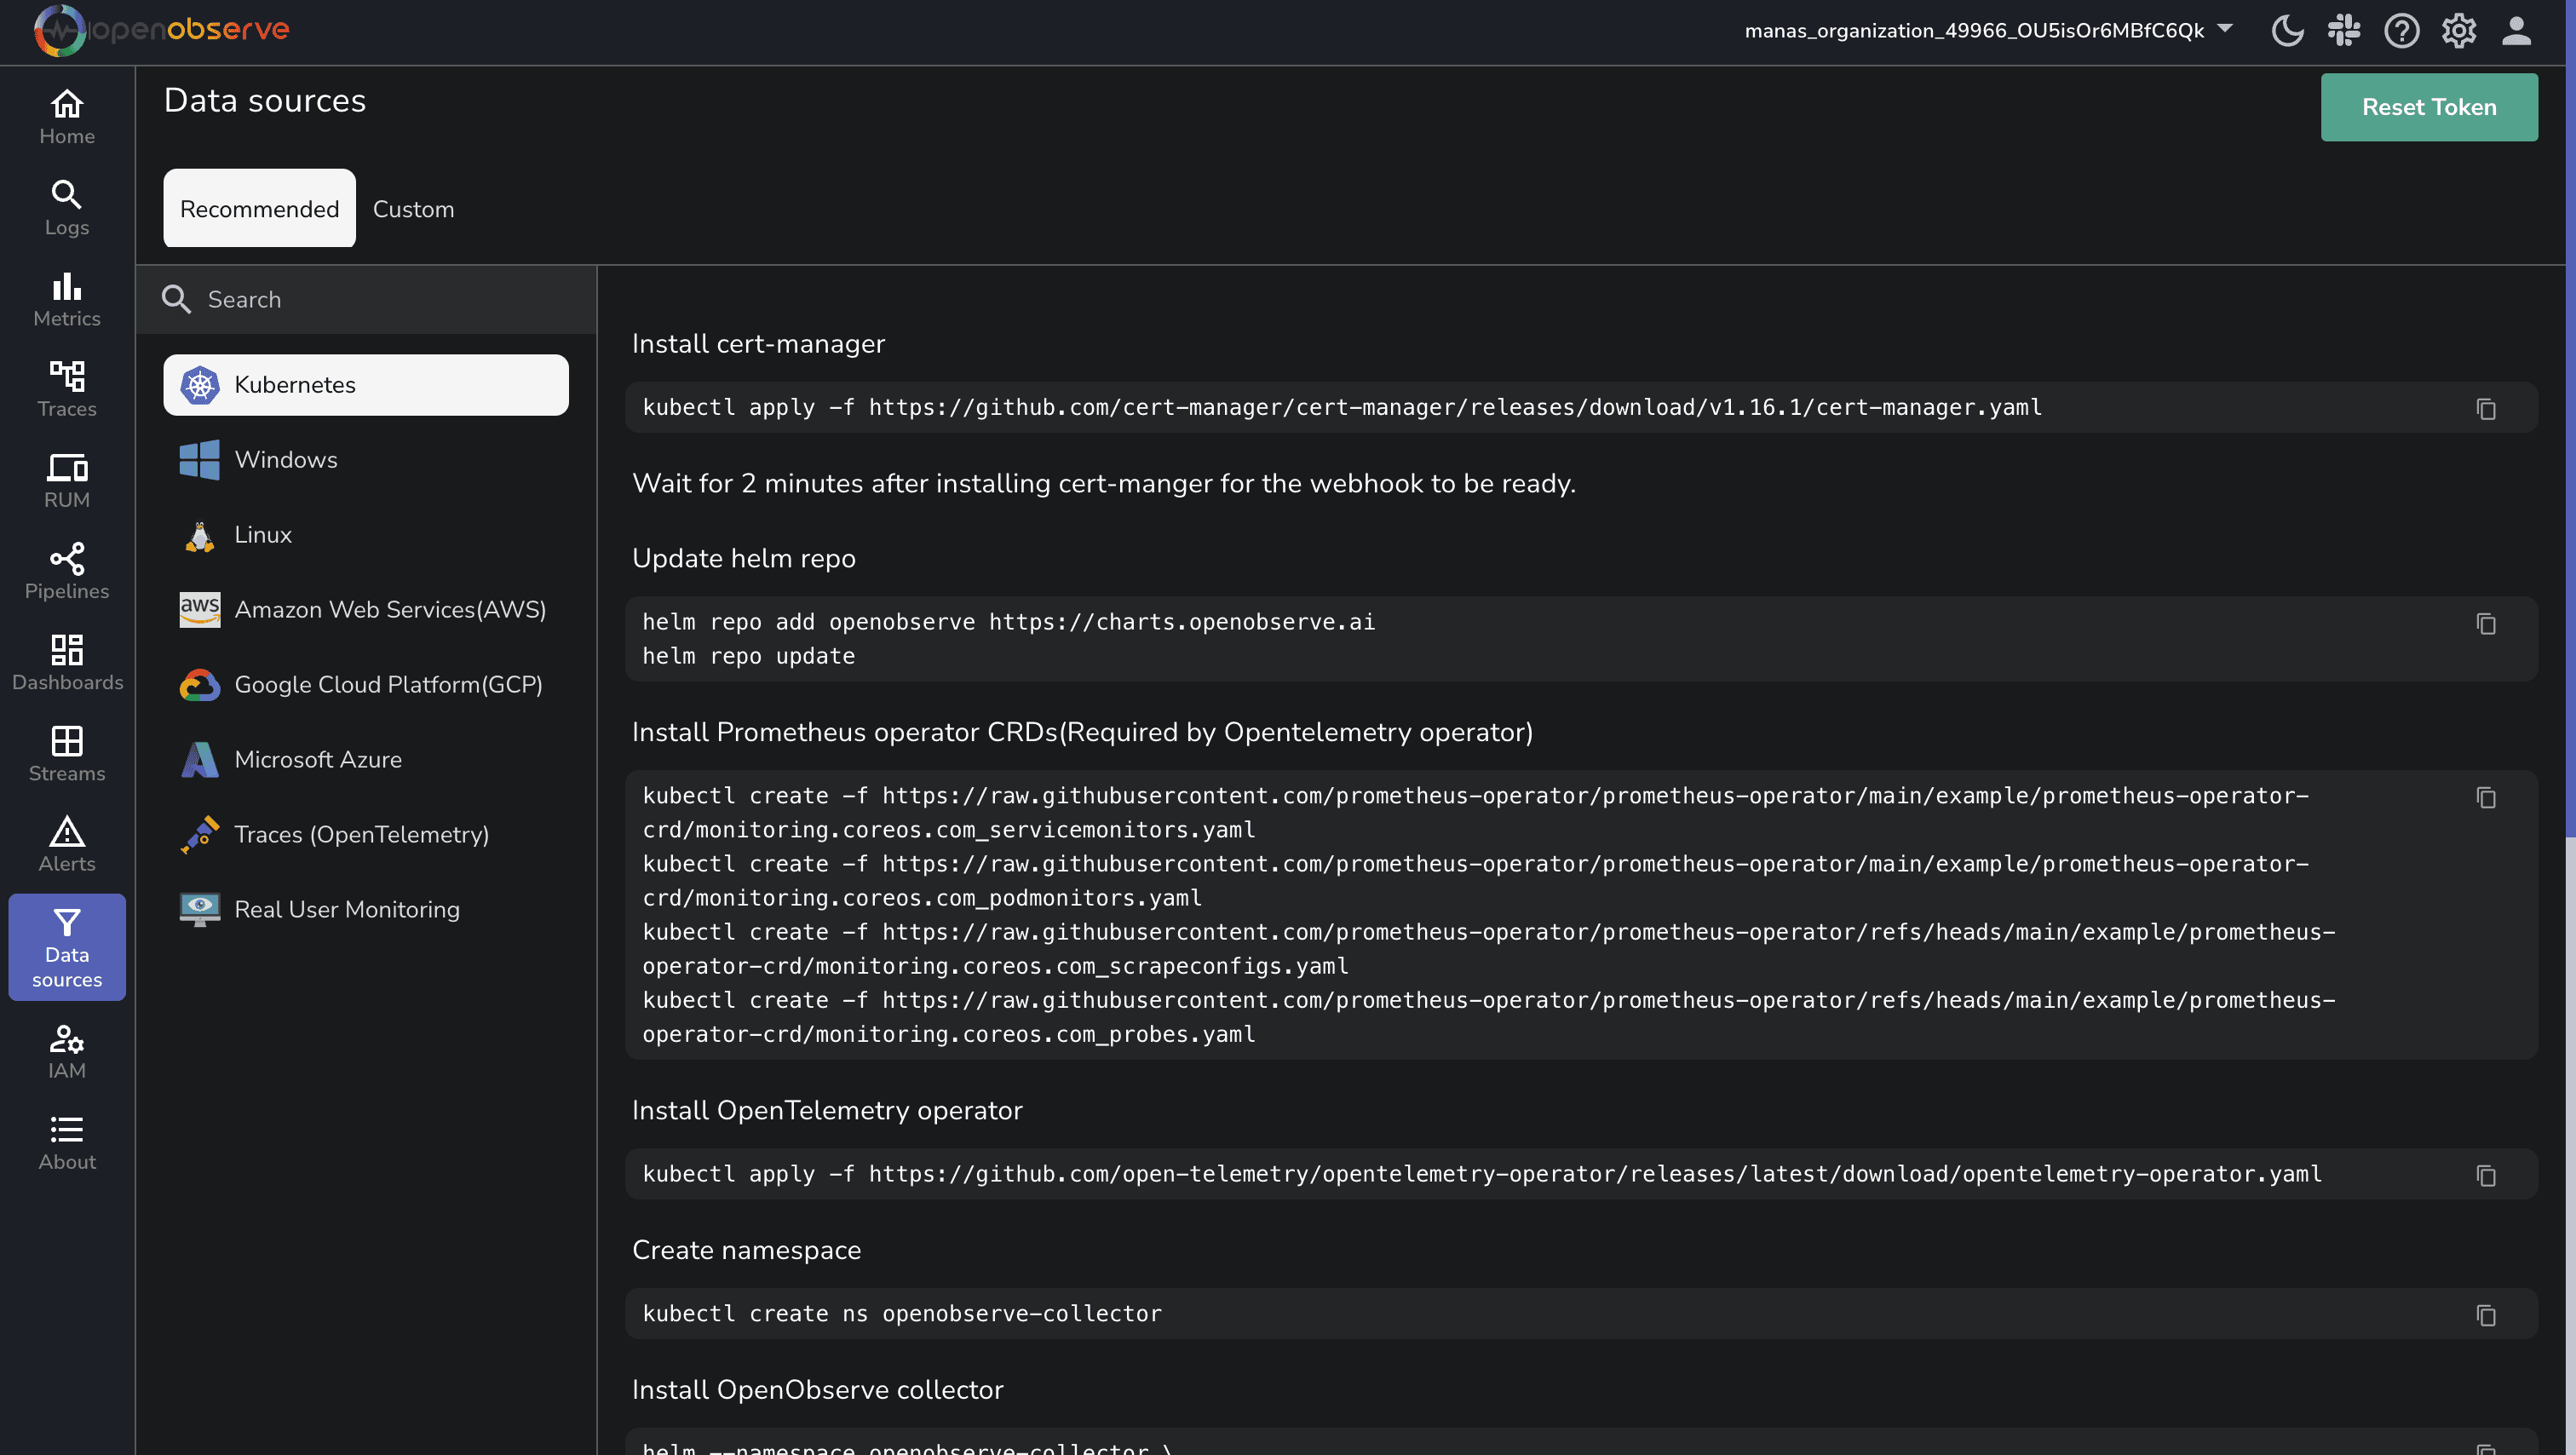
The most efficient way to collect Argo CD metrics and forward them to OpenObserve is by using the OpenObserve Collector. This collector is based on OpenTelemetry and can be deployed as a DaemonSet in your Kubernetes cluster.
> **Note**: You can find the below steps in the "Data Sources" section as well once you log in to OpenObserve.
### Step 1: Install Cert-Manager
Cert-Manager is a tool to automate the management of TLS certificates within Kubernetes:
```bash
kubectl apply -f https://github.com/cert-manager/cert-manager/releases/download/v1.13.1/cert-manager.yaml
```
Cert-Manager will handle the certificates and ensure secure connections between services.
### Step 2: Add the OpenObserve Helm Repository
Add the OpenObserve Helm repository to make the OpenObserve components available for installation:
```bash
helm repo add openobserve https://charts.openobserve.ai
helm repo update
```
Helm makes it easy to deploy and manage OpenObserve components in your Kubernetes cluster.
### Step 3: Apply Prometheus Operator CRDs
The Prometheus Operator manages Kubernetes monitoring components like ServiceMonitors and PodMonitors:
```bash
kubectl apply -f https://raw.githubusercontent.com/prometheus-operator/prometheus-operator/main/example/prometheus-operator-crd/monitoring.coreos.com_servicemonitors.yaml
kubectl apply -f https://raw.githubusercontent.com/prometheus-operator/prometheus-operator/main/example/prometheus-operator-crd/monitoring.coreos.com_podmonitors.yaml
```
This step is essential for monitoring pods and services and pushing their metrics to OpenObserve.
### Step 4: Deploy the OpenTelemetry Operator
OpenTelemetry Operator is an open-source observability tool designed to collect, process, and export metrics and logs from Kubernetes:
```bash
kubectl apply -f https://github.com/open-telemetry/opentelemetry-operator/releases/latest/download/opentelemetry-operator.yaml
```
The OpenTelemetry Operator will be responsible for collecting telemetry data (logs, metrics, and traces) from your Kubernetes cluster.
### Step 5: Create Namespace for OpenObserve Collector
To isolate the OpenObserve collector deployment, create a separate namespace:
```bash
kubectl create ns openobserve-collector
```
This step helps organize resources and manage permissions more effectively.
### Step 6: Deploy OpenObserve Collector with Helm
Now, install the OpenObserve collector using Helm:
```bash
# Copy the below command from the Data Sources section of OpenObserve
# once you login, that will provide you with prefilled auth_token
helm --namespace openobserve-collector \
install o2c openobserve/openobserve-collector \
--set exporters."otlphttp/openobserve".endpoint=https://api.openobserve.ai/api/default \
--set exporters."otlphttp/openobserve".headers.Authorization="Basic " \
--set exporters."otlphttp/openobserve_k8s_events".endpoint=https://api.openobserve.ai/api/default \
--set exporters."otlphttp/openobserve_k8s_events".headers.Authorization="Basic "
```
This command configures the OpenObserve collector to use the OTLP HTTP exporter to send logs and metrics directly to the specified OpenObserve endpoint. Ensure the provided authorization token is secure and base64-encoded.
### Step 7: Verify the Setup
Once the installation is complete, check if the pods are running successfully:
```bash
kubectl get pods -n openobserve-collector
```
You should see OpenObserve Collector pods in the Running state. If not, inspect the logs to diagnose issues:
```bash
kubectl logs -f -n openobserve-collector
```
## Configuring the Collector to Scrape Argo CD Metrics
After deploying the OpenObserve collector, we need to modify its configuration to collect metrics from Argo CD.
### Step 1: Extract the Current Configuration
First, let's get the current values used by the collector:
```bash
helm get values o2c -n openobserve-collector -o yaml > current-values.yaml
```
### Step 2: Modify the Configuration
Now, add the Prometheus receiver for Argo CD to the configuration file (`current-values.yaml`). You'll need to add or update the `prometheus` receiver under the `agent.receivers` section:
```yaml
agent:
receivers:
prometheus:
config:
scrape_configs:
- job_name: otel-collector
scrape_interval: 5s
static_configs:
- targets:
- 0.0.0.0:8888
# Argo CD metrics scraping configuration
- job_name: argocd-metrics
scrape_interval: 15s
kubernetes_sd_configs:
- role: service
namespaces:
names:
- argocd
relabel_configs:
- source_labels: [__meta_kubernetes_service_name]
regex: 'argocd-metrics|argocd-server-metrics|argocd-repo-server|argocd-applicationset-controller|argocd-redis-ha-haproxy|argocd-notifications-controller-metrics'
action: keep
- source_labels: [__meta_kubernetes_service_port_name]
regex: 'metrics|http-exporter-port'
action: keep
- source_labels: [__meta_kubernetes_service_name]
target_label: service
- source_labels: [__meta_kubernetes_pod_name]
target_label: pod
- source_labels: [__meta_kubernetes_namespace]
target_label: namespace
```
Also, make sure that the `prometheus` receiver is included in the metrics pipeline under `agent.service.pipelines.metrics.receivers`:
```yaml
agent:
service:
pipelines:
metrics:
receivers:
- kubeletstats
- hostmetrics
- prometheus # Make sure this is included
```
### Step 3: Apply the Updated Configuration
After modifying the configuration, apply it using Helm:
```bash
helm upgrade o2c openobserve/openobserve-collector \
-f current-values.yaml \
-n openobserve-collector
```
### Step 4: Verify the Configuration is Applied
Check if the new configuration is applied by looking at the logs:
```bash
kubectl logs -n openobserve-collector -l app.kubernetes.io/name=openobserve-collector
```
Look for entries related to scraping Argo CD metrics to confirm the configuration is working.
## Enabling Additional Metrics (Optional)
You can enable additional metrics by modifying the Argo CD Application Controller.
### Application Labels as Metrics
To expose Argo CD application labels as Prometheus metrics:
```bash
kubectl patch statefulset argocd-application-controller -n argocd --type=json -p='[
{
"op": "add",
"path": "/spec/template/spec/containers/0/args/-",
"value": "--metrics-application-labels=team-name"
},
{
"op": "add",
"path": "/spec/template/spec/containers/0/args/-",
"value": "--metrics-application-labels=business-unit"
}
]'
```
### Application Conditions as Metrics
Similarly, to expose application conditions as metrics:
```bash
kubectl patch statefulset argocd-application-controller -n argocd --type=json -p='[
{
"op": "add",
"path": "/spec/template/spec/containers/0/args/-",
"value": "--metrics-application-conditions=OrphanedResourceWarning"
},
{
"op": "add",
"path": "/spec/template/spec/containers/0/args/-",
"value": "--metrics-application-conditions=ExcludedResourceWarning"
}
]'
```
## Verifying Metrics in OpenObserve
Once the OpenObserve Collector is running, you can verify that metrics are being collected by:
1. Log in to your OpenObserve instance
2. Navigate to the "Metrics" page
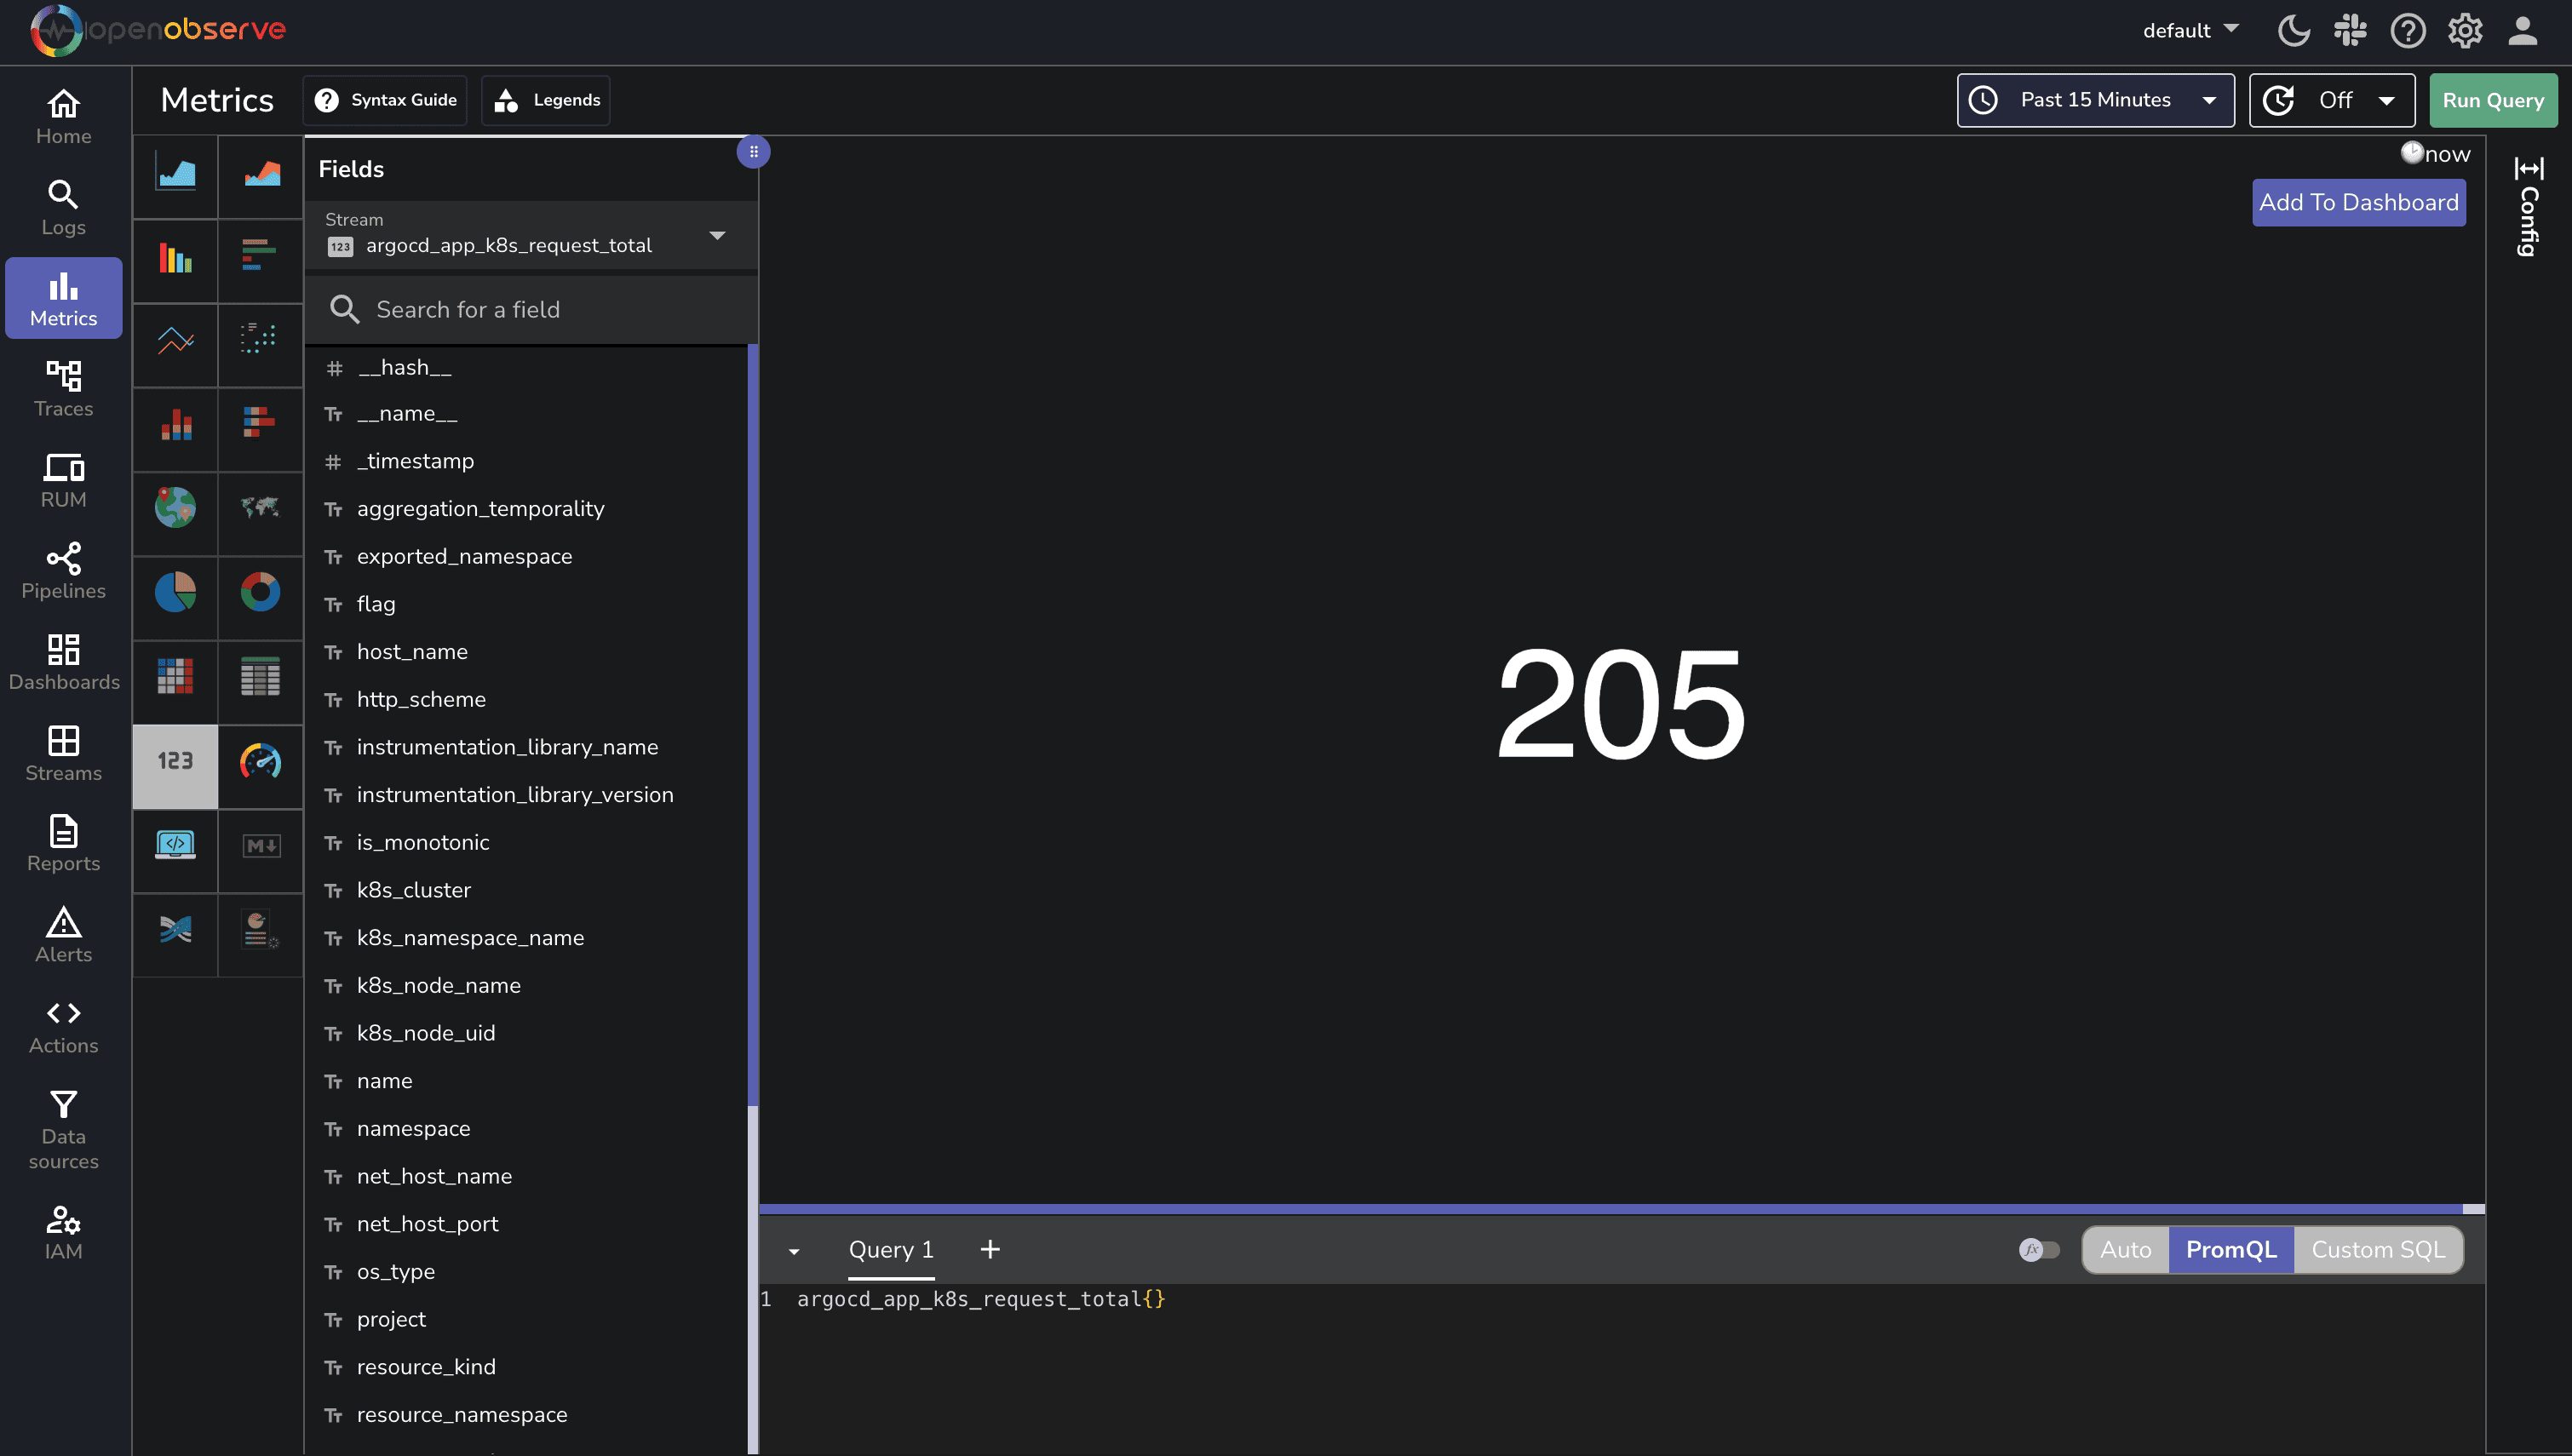
3. Check for other Argo CD metrics like `argocd_git_request_total`
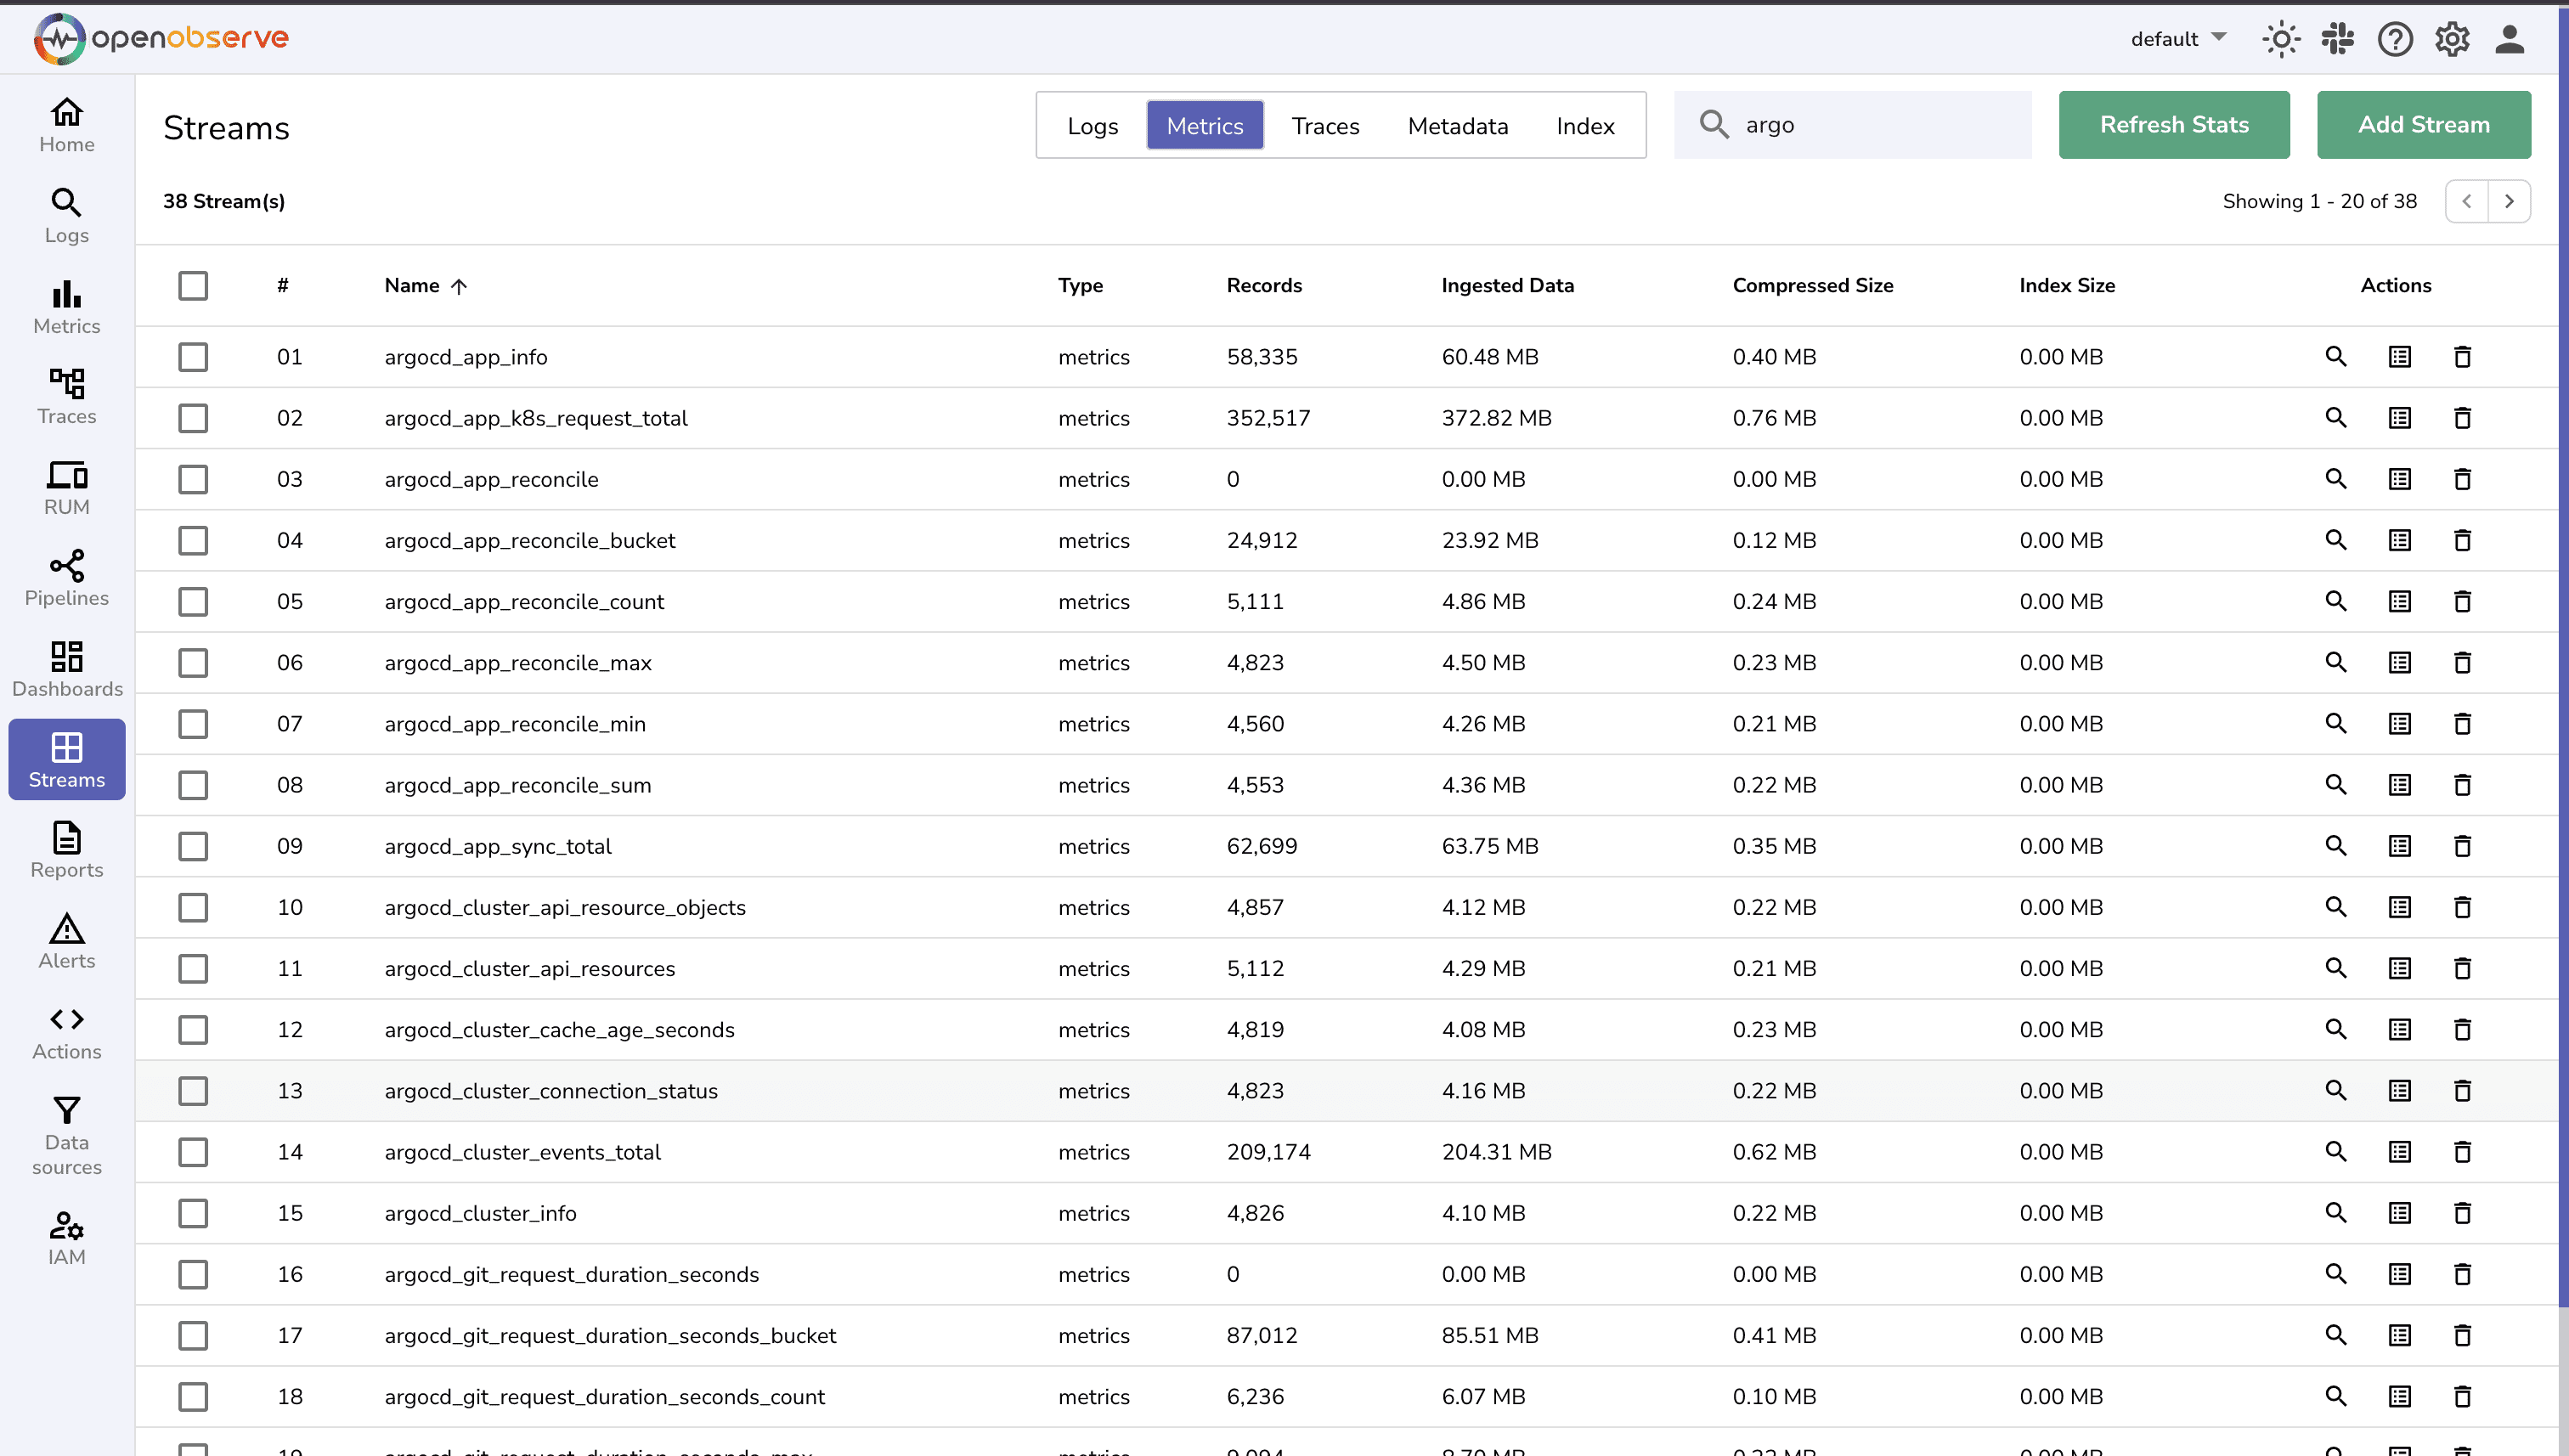
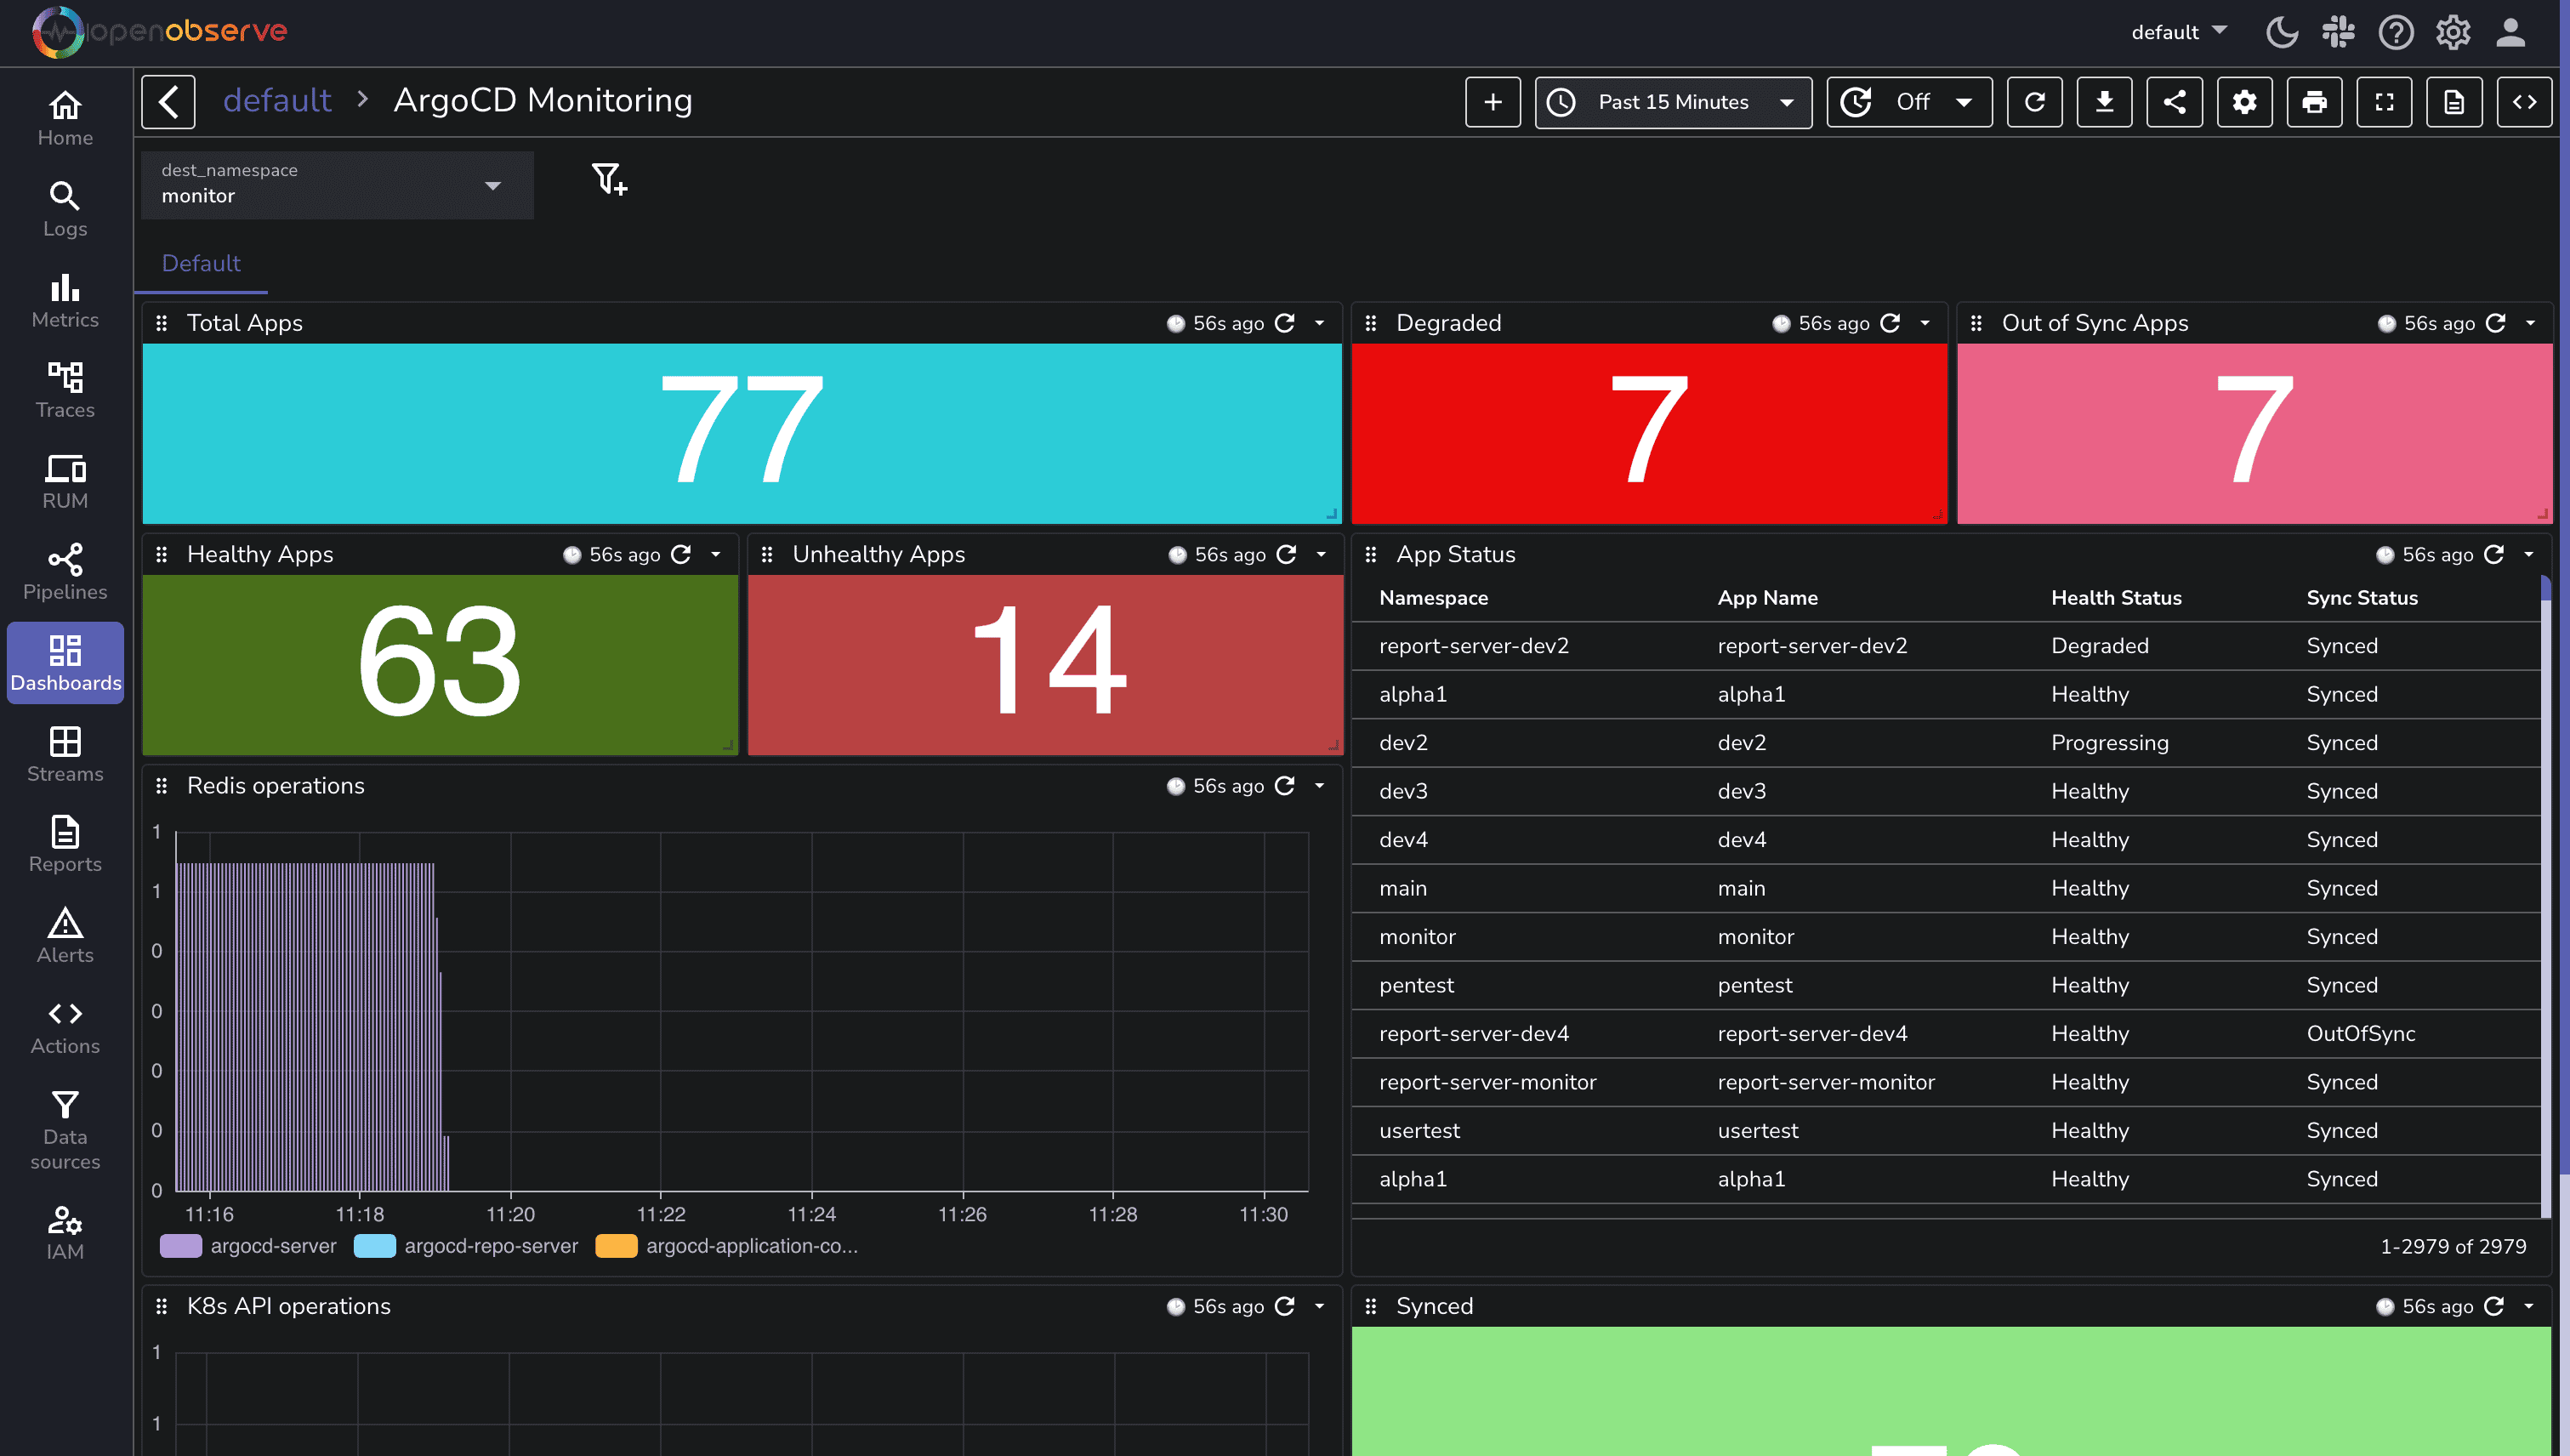
Here is a pre-built ArgoCD metrics monitoring dashboard that you can directly import into your OpenObserve instance. Simply navigate to the Dashboards section and click on "Import Dashboard" to access this ready-to-use monitoring solution.
## Troubleshooting
If metrics aren't appearing in OpenObserve, check:
1. OpenObserve Collector logs:
```bash
kubectl logs -n openobserve-collector -l app.kubernetes.io/name=openobserve-collector
```
2. Ensure the Prometheus receiver configuration is correct
3. Verify that authentication information for OpenObserve is correct
4. Check if metrics are actually exposed by Argo CD by port-forwarding to the metrics endpoints
## Conclusion
By following this guide, you've set up monitoring for your Argo CD installation using OpenObserve and OpenTelemetry. This approach provides a scalable and cloud-native way to monitor your GitOps deployment pipeline.
Next steps after setting up this monitoring solution:
1. Create focused dashboards in OpenObserve to visualize application health, sync status, and reconciliation performance
2. Set up alerts for critical conditions like application health degradation or sync failures
3. Extend your monitoring to include other components of your GitOps pipeline, such as CI systems and Git repositories
4. Integrate with incident management and notification systems for a complete observability solution
The beauty of this approach is that you're using the same OpenTelemetry standard for both your applications and infrastructure components, creating a unified observability stack.
Happy monitoring! 🚀