# Why Use OpenObserve for Heroku Log Monitoring?
> Learn how to set up Heroku Log Drains to seamlessly send logs to OpenObserve using a forwarding app.
Source: https://openobserve.ai/blog/monitor-heroku-logs-developer-guide/
Published: 2025-03-20
Authors: Nitya Timalsina
Category: How To
Tags: Infrastructure, Logging
---
Heroku simplifies app deployment, letting you launch a Python script, Node.js API, or PHP site in minutes. But once your app is live, monitoring its behavior can be tricky. Are your dynos crashing? Is an API call slowing down? Heroku’s Logplex provides real-time logs via heroku logs \--tail, but it’s limited-capping at 1,500 lines or one week of retention. For deeper debugging or historical analysis, you need a better solution. Enter OpenObserve, a scalable, cost-effective platform that captures every log type in a structured format, empowering you with real-time insights, dashboards, and alerts.
In this step-by-step guide, we’ll walk you through setting up Heroku, deploying a Node.js app to generate diverse logs, creating a forwarding app to parse and ingest those logs into OpenObserve Cloud, and troubleshooting to ensure everything works seamlessly. Whether you’re a developer debugging a production issue or a DevOps engineer monitoring app health, this guide will help you unlock the full potential of your Heroku logs.
## Why Use OpenObserve for Heroku Log Monitoring?
Heroku’s Logplex aggregates logs from your app (stdout/stderr), router (HTTP requests), and system events (dyno restarts) into a single stream. It’s handy for quick checks-like spotting status codes or basic errors-but it falls short when you need deeper analysis. Let’s break down the challenges with Logplex and see how OpenObserve overcomes them.
| Aspect | Heroku Logplex Limitations | OpenObserve Benefits |
| :---- | :---- | :---- |
| Retention | Capped at 1,500 lines or one week. | Unlimited retention, enabling long-term historical analysis. |
| Log Structure | Raw text, hard to filter or analyze. | Structured JSON logs for easy querying and filtering (e.g., source:app). |
| Historical Insights | No querying beyond the retention limit. | Query logs anytime with a fast engine, uncovering trends and past issues. |
| Cost Efficiency | Not optimized for large-scale storage. | Columnar storage cuts costs by up to 140x compared to Elasticsearch. |
| Real-Time Insights | Basic visibility, no advanced features. | Dashboards, real-time queries, and alerts (e.g., for status:500) keep you proactive. |
| Scalability | Struggles with high log volumes. | Scales seamlessly from small projects to production apps. |
For Heroku users, OpenObserve transforms log monitoring into a powerful tool. You can pinpoint dyno failures, trace API timeouts, and analyze historical trends-all in one place. Let’s dive into setting this up.
## Prerequisites
Before we begin, ensure you have the following:
* **Heroku Account:** Sign up at heroku.com. The free tier works for this guide.
* **Heroku CLI**: This lets you manage your Heroku apps from the terminal.
* **Node.js and npm:** Install from nodejs.org (verify with node \-v and npm \-v).
* **Git:** Install from git-scm.com (verify with git \--version).
* **Terminal:** Any shell (bash, PowerShell, etc.) for CLI commands.
* **OpenObserve Account:** Sign into [Cloud](https://cloud.openobserve.ai/) or select a [download](https://openobserve.ai/downloads/).
With these tools in place, you’re ready to start.
---
## Step 1: Log in to Heroku
## 1.1 Verify Installation
Check the version:
```
heroku --version
```
You should see something like heroku/10.3.0 darwin-arm64 node-v23.10.0 (version may vary).
## 1.2 Log In to Heroku
Authenticate your CLI:
```
heroku login
```
Press any key to open the browser, log in, and confirm: Logged in as your-email@domain.com.
---
## Step 2: Build and Deploy a Node.js App on Heroku
Let’s create a Node.js app using Express to generate diverse logs-app logs, router logs, error logs, and system logs. We’ll deploy it via the Heroku dashboard for a user-friendly experience.
## 2.1 Set Up the App Locally
### 1\. Create the Project
In your terminal, create a new directory and initialize a Node.js project:
```
mkdir heroku-log-demo
cd heroku-log-demo
npm init -y
```
### 2\. Install Express
Install Express as a dependency:
```
npm install express
```
### 3\. Write the App Code
Create index.js to generate various log types:
```javascript
const express = require('express');
const app = express();
// Middleware to simulate router logs
app.use((req, res, next) => {
console.log(`[Router] ${req.method} request to ${req.path} from ${req.ip} at ${new Date().toISOString()}`);
next();
});
// Simulate app activity logs
app.get('/', (req, res) => {
const timestamp = new Date().toISOString();
console.log(`[App] GET / at ${timestamp}`);
res.send('Heroku Log Demo');
});
// Simulate error logs
app.get('/error', (req, res) => {
const timestamp = new Date().toISOString();
console.error(`[Error] /error failure at ${timestamp}`);
res.status(500).send('Server Error');
});
// Simulate health check logs
app.get('/health', (req, res) => {
const timestamp = new Date().toISOString();
console.log(`[Health] Health check passed at ${timestamp}`);
res.send('OK');
});
// Simulate periodic system logs
setInterval(() => {
console.log(`[System] Dyno heartbeat at ${new Date().toISOString()}`);
}, 60000); // Log every 60 seconds
const port = process.env.PORT || 3000;
app.listen(port, () => console.log(`[System] Server started on port ${port} at ${new Date().toISOString()}`));
```
* **What This Does:**
* **Router Logs:** Logs each request with the method, path, and IP.
* **App Logs:** Logs successful GET requests to /.
* **Error Logs:** Logs errors on /error with a 500 status.
* **System Logs:** Logs a heartbeat every 60 seconds and a startup message.
### 4\. Configure Heroku
Create a Procfile to tell Heroku how to run the app:
```
web: node index.js
```
Update package.json with a start script:
```
{
"name": "heroku-log-demo",
"version": "1.0.0",
"main": "index.js",
"scripts": {
"start": "node index.js"
},
"dependencies": {
"express": "^4.21.2"
}
}
```
## 2.2 Deploy the App via the Heroku Dashboard
### 1\. Initialize Git
Set up Git for deployment:
```
git init
git add .
git commit -m "App with diverse logs"
```
### 2\. Create the App in the Heroku Dashboard
* Go to dashboard.heroku.com/apps.
* Click **Create new app**.
* In the “Create New App” screen:
* **App name:** Enter heroku-log-demo (must be unique; if taken, try heroku-log-demo-123).
* **Location:** Select **Common Runtime** and **United States** (or Europe).
* Leave **Add this app to a pipeline** unchecked.
* Click **Create app**.
### 3\. Connect Git and Deploy
* On the app’s dashboard, go to the Deploy tab.
* Under Deployment method, select Heroku Git.
* Follow the CLI instructions:
* Add the remote:
```
heroku git:remote -a heroku-log-demo
```
* Push the code:
```
git push heroku main
```
* Note the deployed URL (e.g., https://heroku-log-demo-d1dbe34d60a5.herokuapp.com).
### 4\. Test the App
* Click **Open app** in the dashboard to visit your app’s URL.
* Test the endpoints to generate logs:
```
curl https://heroku-log-demo-d1dbe34d60a5.herokuapp.com/
curl https://heroku-log-demo-d1dbe34d60a5.herokuapp.com/error
curl https://heroku-log-demo-d1dbe34d60a5.herokuapp.com/health
```
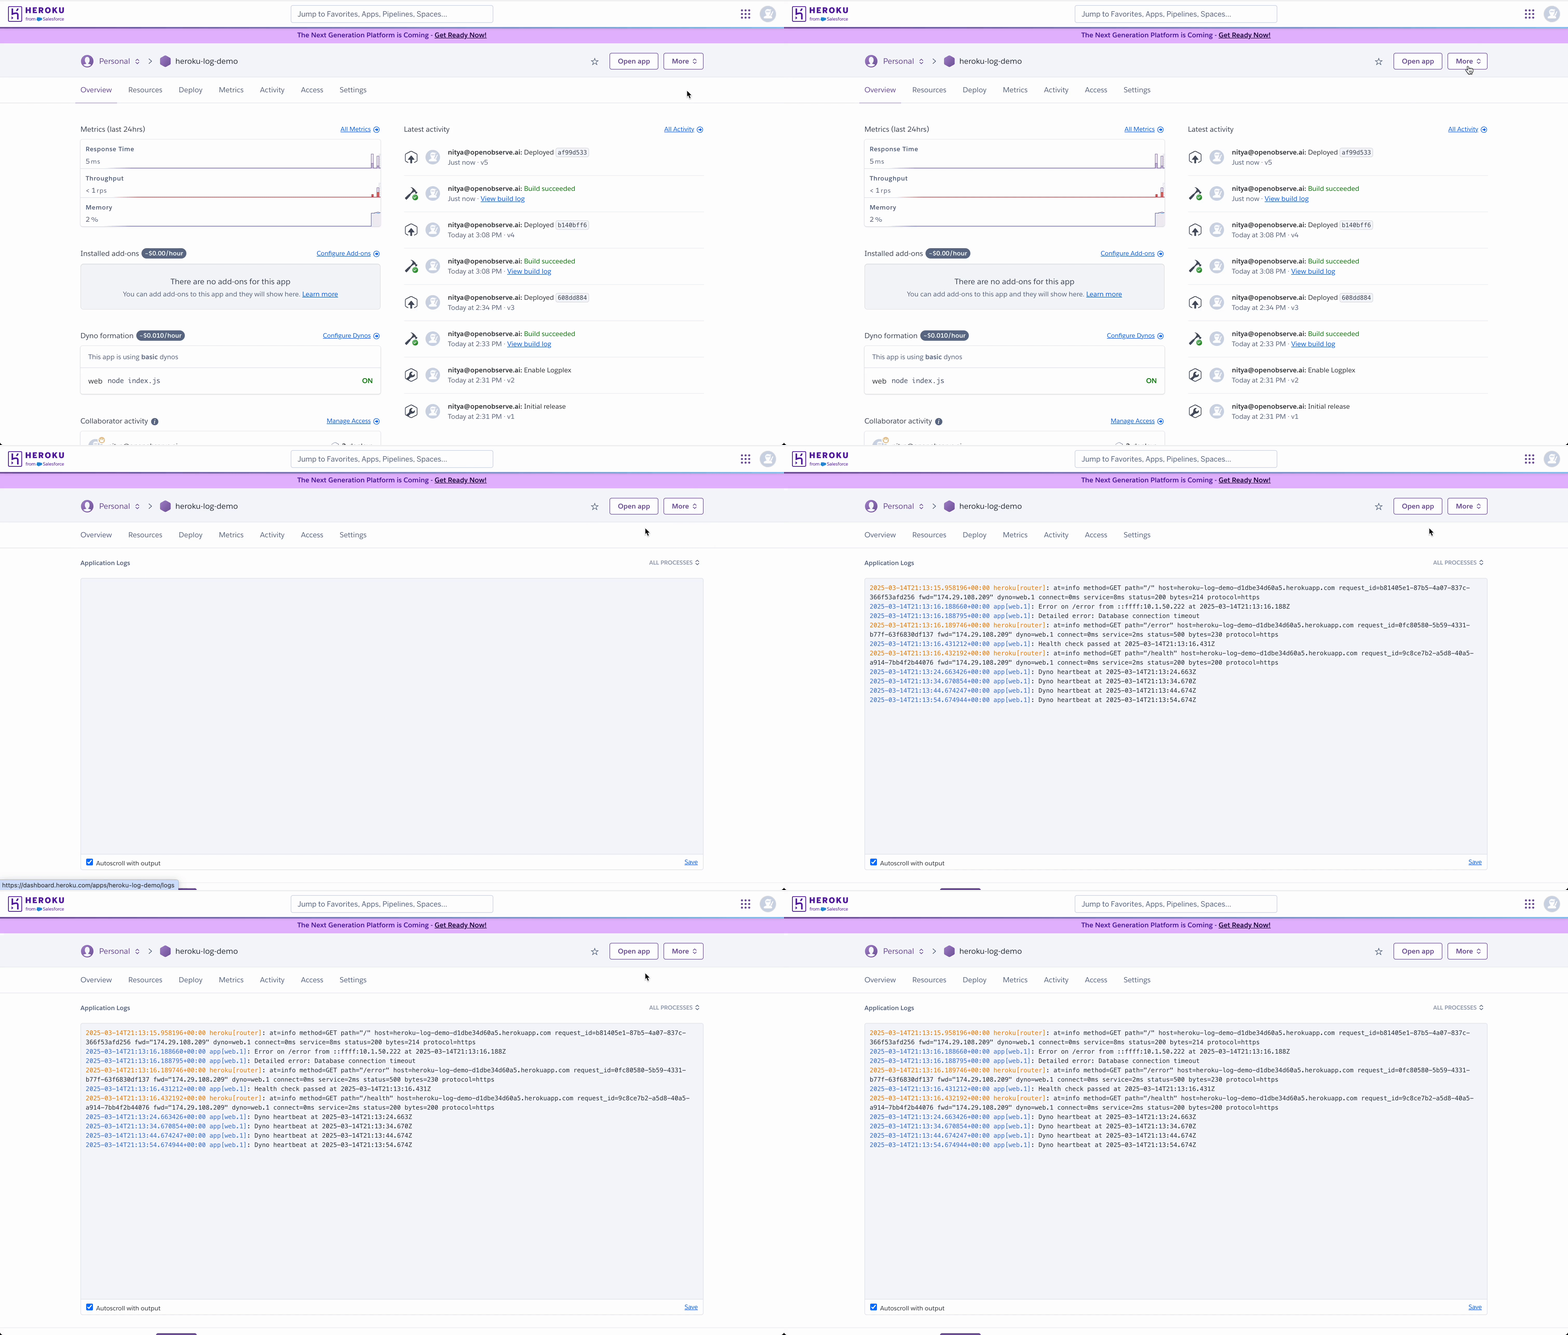
* Check the logs in the Heroku dashboard:
* Go to **More \> View logs**. Expect logs like:
```
2025-03-17T11:11:49.810119+00:00 app[web.1]: [System] Dyno heartbeat at 2025-03-17T11:11:49.810Z
2025-03-17T11:13:13.969414+00:00 app[web.1]: [Router] GET request to / from ::ffff:10.1.26.118 at 2025-03-17T11:13:13.969Z
2025-03-17T11:13:13.975482+00:00 app[web.1]: [App] GET / at 2025-03-17T11:13:13.975Z
2025-03-17T11:13:14.008214+00:00 heroku[router]: at=info method=GET path="/" host=heroku-log-demo-d1dbe34d60a5.herokuapp.com request_id=4c02255d-0fa2-4ea1-aeca-7fd31aebe5a3 fwd="174.29.108.209" dyno=web.1 connect=1ms service=95ms status=304 bytes=149 protocol=https
2025-03-17T11:13:14.140920+00:00 app[web.1]: [Router] GET request to /error from ::ffff:10.1.26.118 at 2025-03-17T11:13:14.140Z
2025-03-17T11:13:14.143019+00:00 app[web.1]: [Error] /error failure at 2025-03-17T11:13:14.143Z
2025-03-17T11:13:14.143019+00:00 heroku[router]: at=info method=GET path="/error" host=heroku-log-demo-d1dbe34d60a5.herokuapp.com request_id=7dff073a-f691-4a33-91ef-f6b15c9ff73d fwd="174.29.108.209" dyno=web.1 connect=0ms service=2ms status=500 bytes=230 protocol=https
2025-03-17T11:13:14.145920+00:00 app[web.1]: [Router] GET request to /health from ::ffff:10.1.26.118 at 2025-03-17T11:13:14.145Z
2025-03-17T11:13:14.146482+00:00 app[web.1]: [Health] Health check passed at 2025-03-17T11:13:14.146Z
2025-03-17T11:13:14.147019+00:00 heroku[router]: at=info method=GET path="/health" host=heroku-log-demo-d1dbe34d60a5.herokuapp.com request_id= fwd="174.29.108.209" dyno=web.1 connect=0ms service=1ms status=200 bytes=200 protocol=https
```
---
## Step 3: Retrieve Your OpenObserve Endpoint and Credentials
Before we can forward logs to OpenObserve, we need to grab the endpoint, credentials, and organization details from your OpenObserve Cloud account. These will allow our forwarding app to authenticate and send logs to the correct stream. Log into OpenObserve and follow these steps:
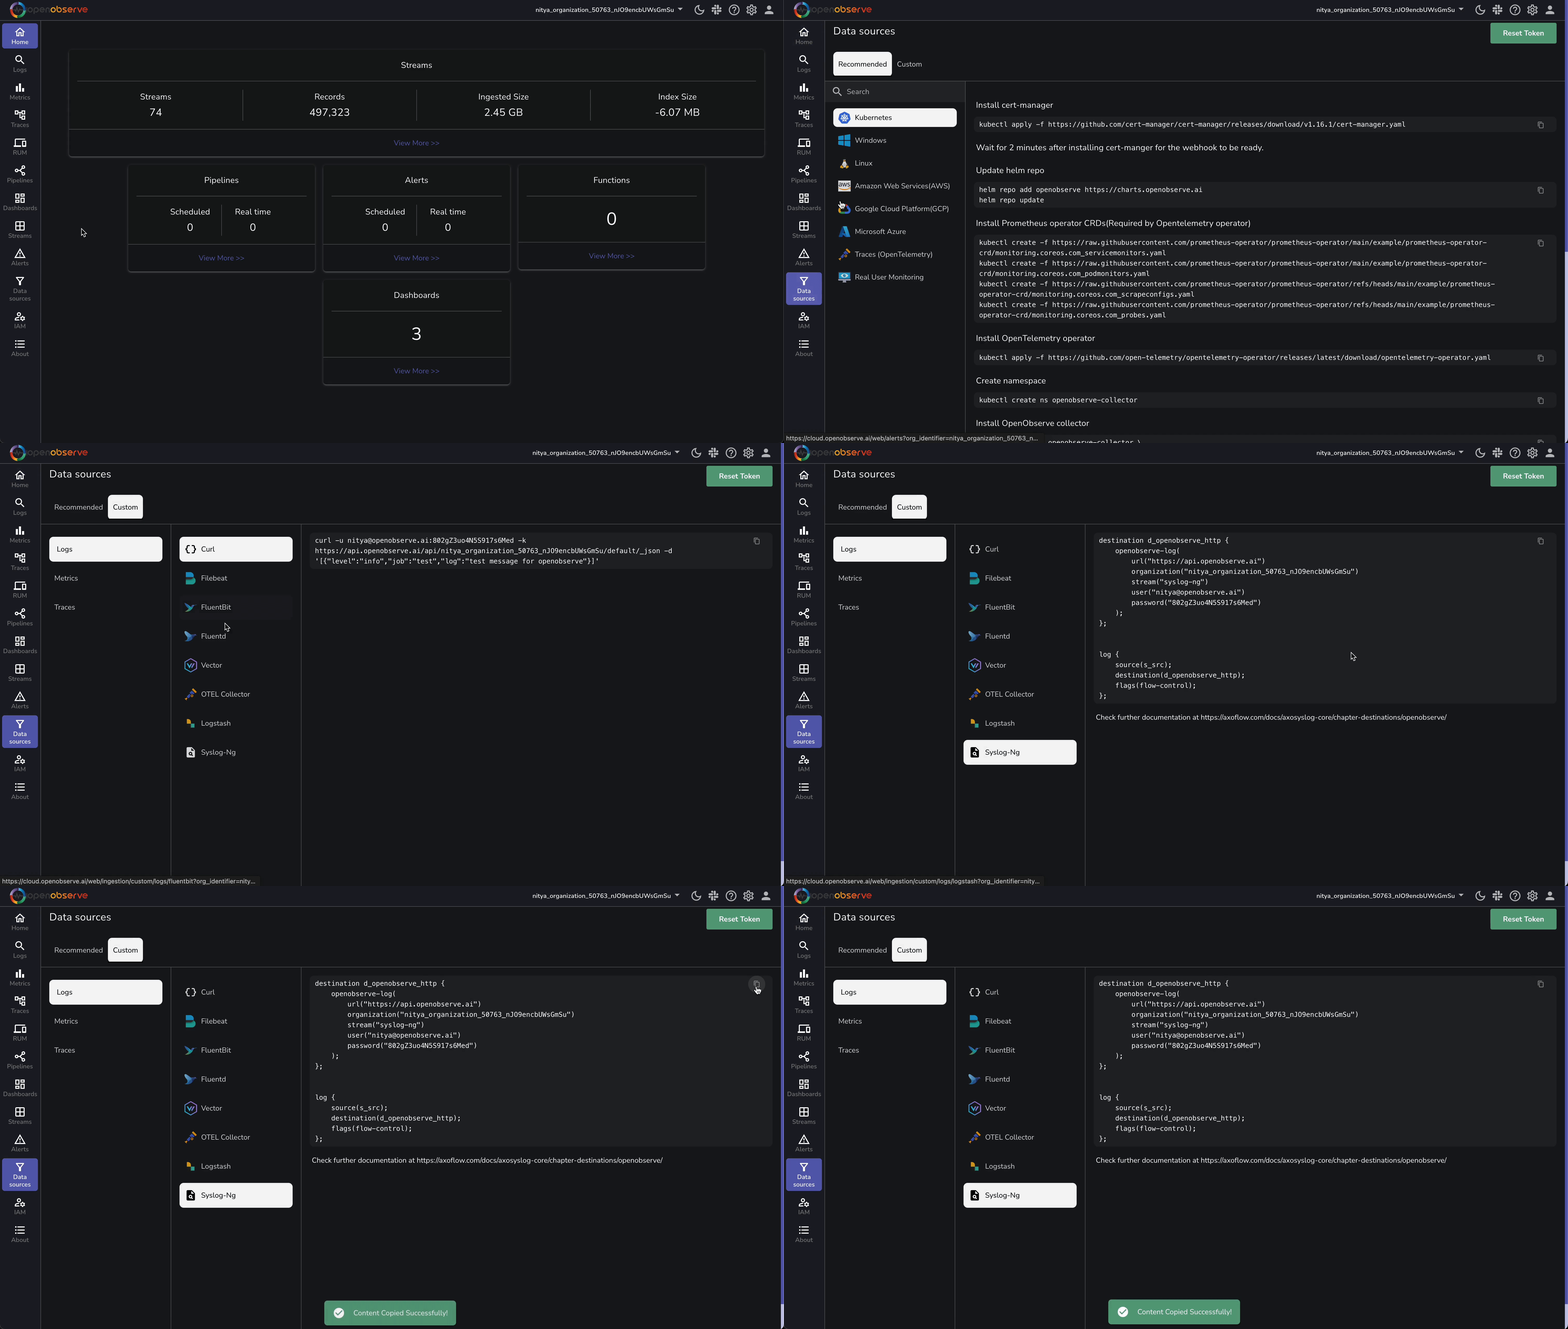
## 3.1 Navigate to Data Sources
* Once logged in, go to the **Data Sources** section in the left-hand menu.
* Expand the **Custom** category.
* Under **Logs**, click on **Syslog-NG** to view the configuration details for log ingestion.
## 3.2 Extract the Endpoint and Credentials
You’ll see a configuration snippet similar to this:
```
destination d_openobserve_http {
openobserve-log(
url("https://api.openobserve.ai")
organization("your_organization_id")
stream("syslog-ng")
user("your-username@example.com")
password("your_password")
);
};
log {
source(s_src);
destination(d_openobserve_http);
flags(flow-control);
};
```
* **Key Details to Extract:**
* **URL:** The base endpoint for OpenObserve (e.g., https://api.openobserve.ai).
* **Organization ID:** Your unique organization identifier (e.g., your\_organization\_id).
* **Stream Name:** The stream where logs will be stored (default is syslog-ng, but we’ll use heroku\_logs).
* **User:** Your OpenObserve username (e.g., your-username@example.com).
* **Password:** Your OpenObserve password (e.g., your\_password).
## 3.3 Adapt the Details for Heroku Logs
We’ll use these details to configure our forwarding app, but we need to adapt them for Heroku logs:
* **Base URL:** Remains [https://api.openobserve.ai](https://api.openobserve.ai).
* **Full Ingestion Endpoint:** Combine the base URL, organization ID, and a custom stream name (heroku\_logs):
```
https://api.openobserve.ai/api/your_organization_id/heroku_logs/_json�
```
* **Credentials:** Use the user and password for HTTP Basic Authentication.
* **Stream Name:** We’ll use heroku\_logs instead of syslog-ng to organize our Heroku logs.
Keep these details handy-you’ll need them when setting up the forwarding app in the next step. Replace your\_organization\_id, your-username@example.com, and your\_password with the values from your OpenObserve account.
---
## Step 4: Build a Forwarding App to Parse and Send Logs to OpenObserve
Heroku’s Logplex sends logs as raw text with a syslog prefix (e.g., 140 \<190\>1 ...). To make these logs searchable in OpenObserve, we need to parse them into structured JSON. We’ll create a separate forwarding app to handle this parsing and forward the logs to OpenObserve Cloud.
## 4.1 Create the Forwarding App Locally
### 1\. Initialize a New Project
Create a separate directory for the forwarding app to avoid conflicts:
```
cd ..
mkdir heroku-log-forwarder
cd heroku-log-forwarder
npm init -y
```
### 2\. Install Dependencies
Install the required packages:
```
npm install express body-parser node-fetch@2
```
* **Note:** node-fetch@2 ensures compatibility with CommonJS modules.
### 3\. Write the Forwarder Code
Create index.js to parse Heroku logs and forward them to OpenObserve:
```javascript
const express = require('express');
const bodyParser = require('body-parser');
const fetch = require('node-fetch');
const app = express();
app.use(bodyParser.text({ type: '*/*' })); // Accept raw text logs
const OPENOBSERVE_URL = 'https://api.openobserve.ai/api//heroku_logs/_json';
const OPENOBSERVE_USER = 'your-username@example.com';
const OPENOBSERVE_PASS = 'your_password';
// Regular expression to parse Heroku log format with syslog prefix
const logRegex = /^(\d+) <\d+>1\s+(\d{4}-\d{2}-\d{2}T\d{2}:\d{2}:\d{2}\.\d{6}\+\d{2}:\d{2})\s+host\s+(\w+)\s+(\w+)\.(\d+)\s*-\s*(.*)$/;
const routerRegex = /^(\d+) <\d+>1\s+(\d{4}-\d{2}-\d{2}T\d{2}:\d{2}:\d{2}\.\d{6}\+\d{2}:\d{2})\s+host\s+heroku\s+(\w+)\s*-\s+at=info\s+(method=\S+\s+path=\S+\s+host=\S+\s+request_id=\S+\s+fwd=\S+\s+dyno=\S+\s+connect=\S+\s+service=\S+\s+status=\S+\s+bytes=\S+\s+protocol=\S+)/;
app.post('/logs', async (req, res) => {
const rawLogs = req.body.split('\n').filter(log => log.trim() !== ''); // Split into lines and filter empty
const enrichedLogs = rawLogs.map(log => {
let match = log.match(logRegex);
if (match) {
const [, _, timestamp, source, dynoNum, dynoId, message] = match;
const dyno = `${dynoNum}.${dynoId}`; // Simplify dyno format
return {
app: "heroku-log-demo",
dyno,
message,
source: source.toLowerCase(),
timestamp
};
}
// Handle router logs
match = log.match(routerRegex);
if (match) {
const [, _, timestamp, source, details] = match;
const params = details.split(' ').reduce((acc, pair) => {
const [key, value] = pair.split('=');
acc[key] = value.replace(/^"(.*)"$/, '$1'); // Remove quotes
return acc;
}, {});
return {
app: "heroku-log-demo",
dyno: params.dyno,
message: details,
source: source.toLowerCase(),
timestamp,
...params
};
}
console.warn(`Unparsed log: ${log}`); // Debug unparsed logs
return { message: log, timestamp: new Date().toISOString() }; // Fallback for unparsed logs
});
try {
const response = await fetch(OPENOBSERVE_URL, {
method: 'POST',
headers: {
'Content-Type': 'application/json',
'Authorization': `Basic ${Buffer.from(`${OPENOBSERVE_USER}:${OPENOBSERVE_PASS}`).toString('base64')}`
},
body: JSON.stringify(enrichedLogs)
});
if (response.ok) {
console.log(`Forwarded ${enrichedLogs.length} logs to OpenObserve`);
res.sendStatus(200);
} else {
throw new Error(`OpenObserve ingestion failed with status ${response.status}`);
}
} catch (error) {
console.error('Error forwarding logs:', error.message);
res.status(500).send('Forwarding failed');
}
});
const port = process.env.PORT || 3000;
app.listen(port, () => console.log(`Log forwarder running on port ${port}`));
```
* **What This Does:**
* **Parses Logs:** Uses regex to extract fields like timestamp, source, dyno, and message from Heroku’s syslog-prefixed logs.
* **Enriches Router Logs:** Extracts detailed fields (e.g., method, path, status) from router logs.
* **Forwards to OpenObserve:** Sends structured JSON logs to OpenObserve Cloud.
### 4\. Configure Heroku
Create a Procfile:
```
web: node index.js�
```
Update package.json:
```
{
"name": "heroku-log-forwarder",
"version": "1.0.0",
"main": "index.js",
"scripts": {
"start": "node index.js"
},
"dependencies": {
"express": "^4.21.2",
"body-parser": "^1.20.3",
"node-fetch": "^2.6.7"
}
}
```
## 4.2 Deploy the Forwarding App to Heroku
### 1\. Initialize Git and Deploy
```
git init
git add .
git commit -m "Initial forwarder setup with log parsing"
heroku create heroku-log-forwarder
git push heroku main
```
* Note the deployed URL (e.g., https://heroku-log-forwarder.herokuapp.com).
### 2\. Connect Heroku Logs to the Forwarding App
Remove any existing drains:
```
heroku drains -a heroku-log-demo
heroku drains:remove -a heroku-log-demo
```
* Replace \ with the ID from the heroku drains output (if any).
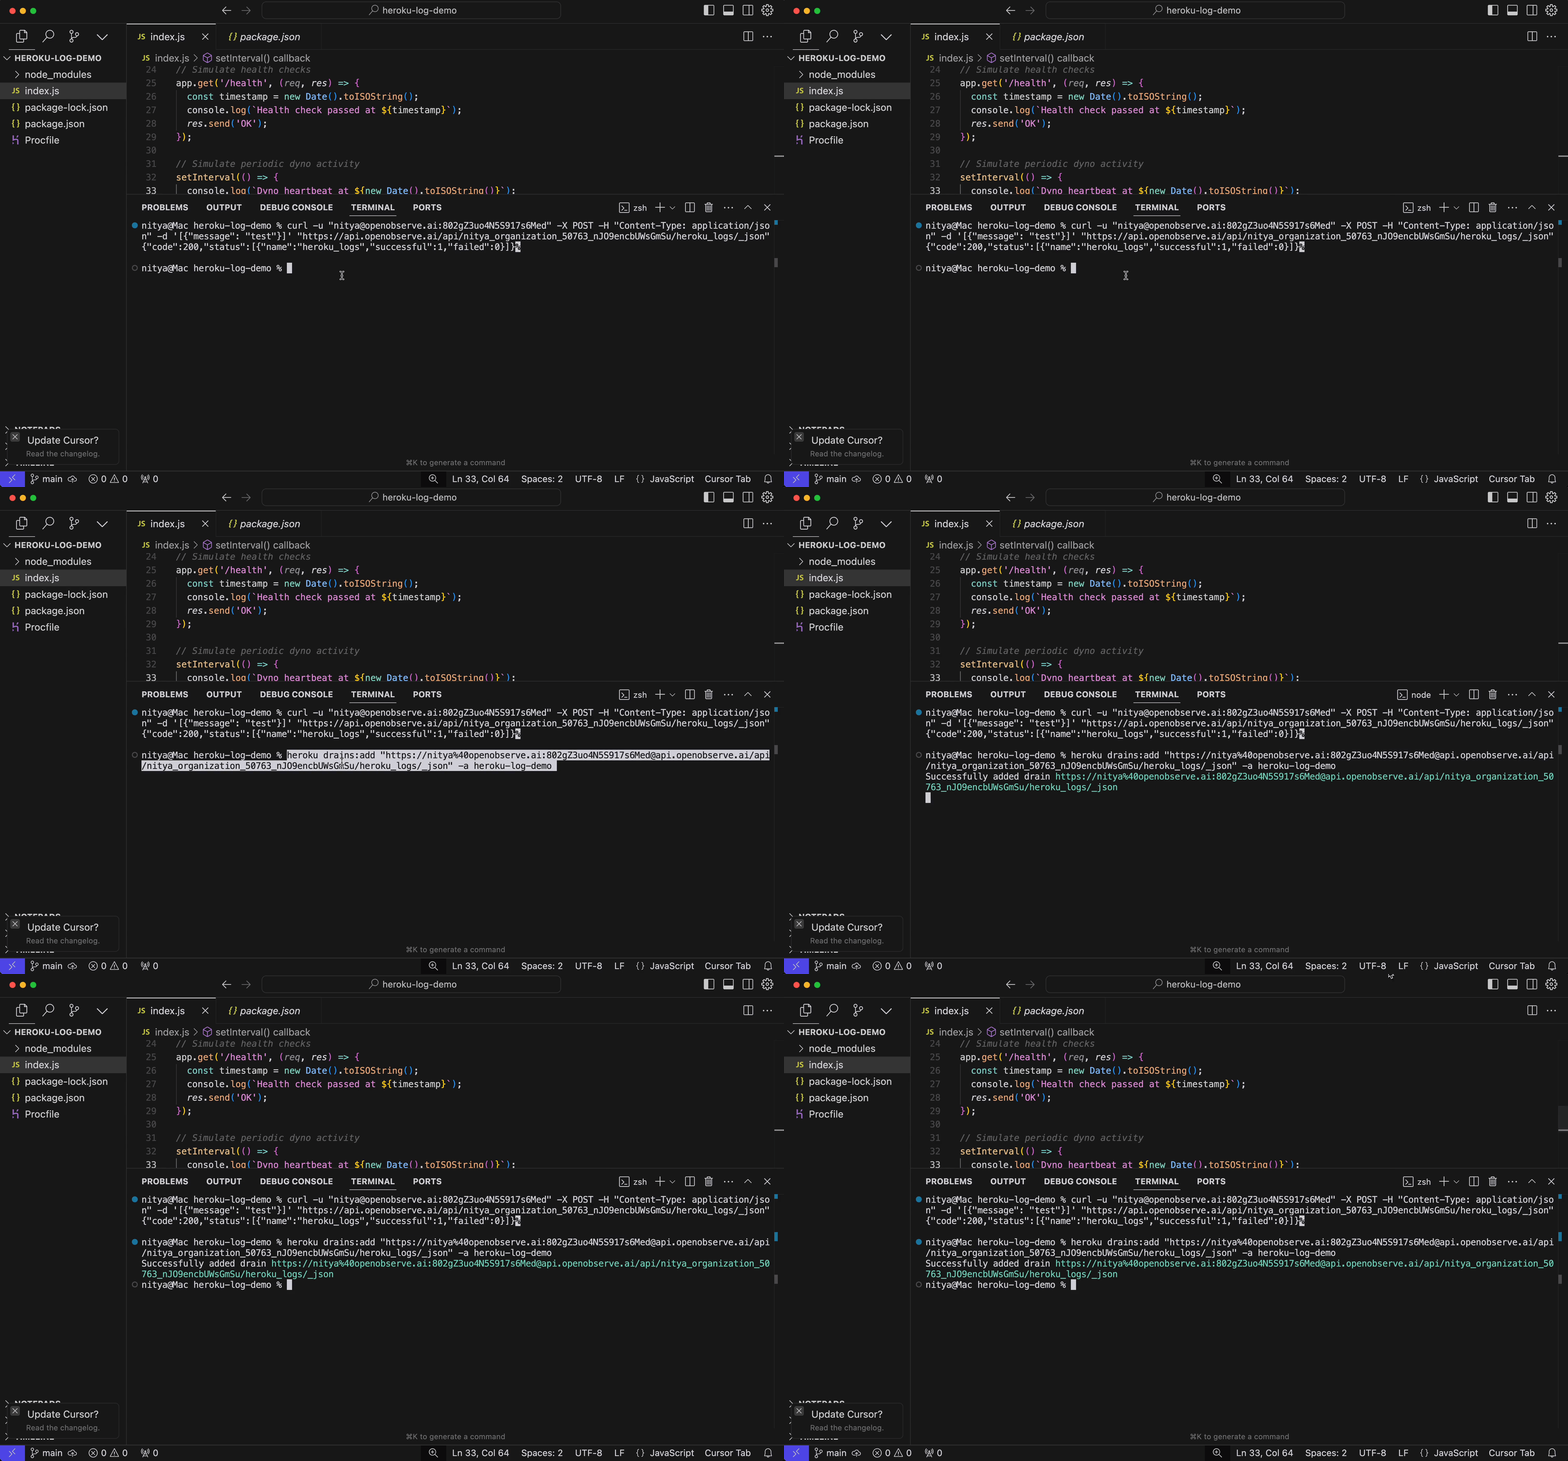
Add the HTTPS drain to the forwarding app:
```
heroku drains:add "https://heroku-log-forwarder.herokuapp.com/logs" -a heroku-log-demo
```
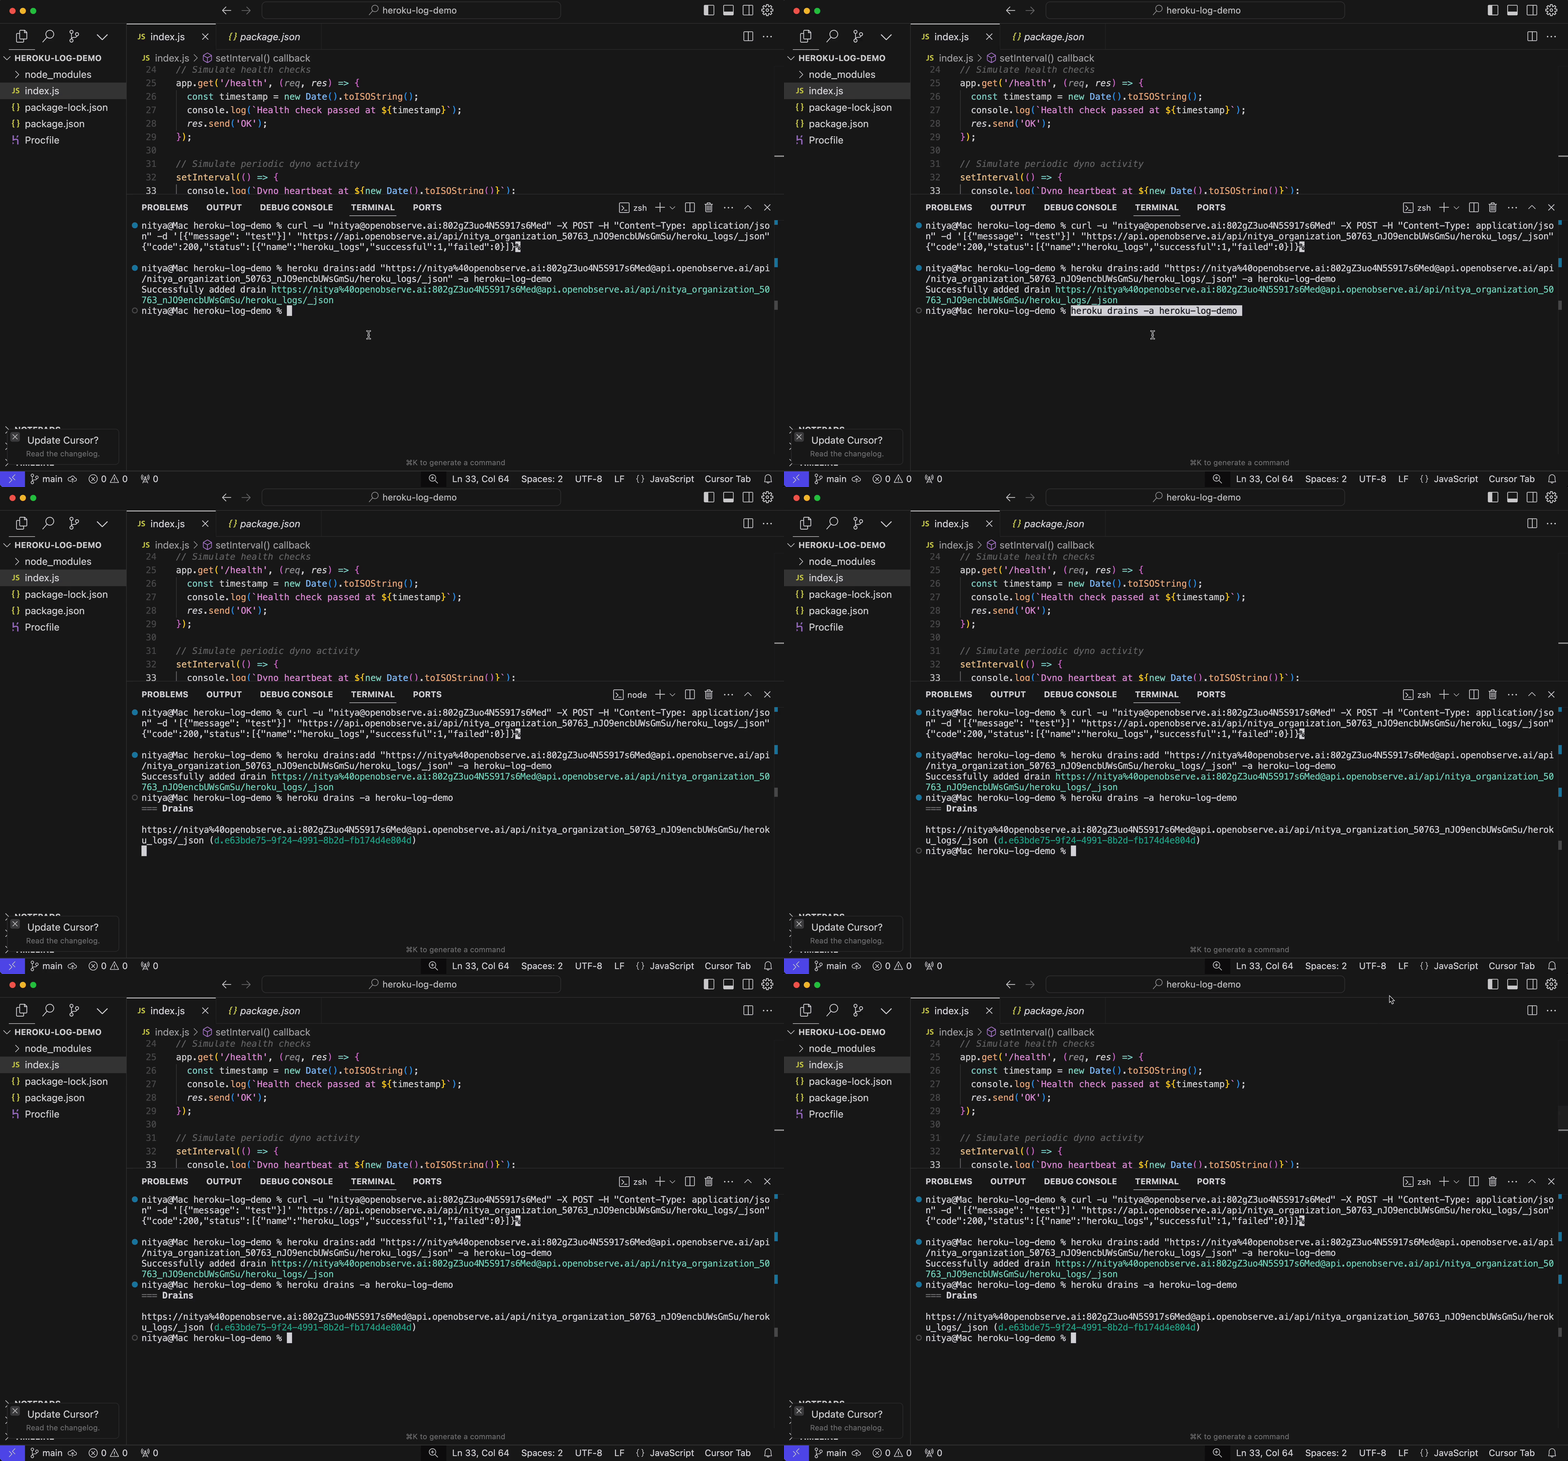
Verify the drain:
```
heroku drains -a heroku-log-demo
```
Expect: https://heroku-log-forwarder.herokuapp.com/logs (d.\).
### 3\. Adjust Sampling Rate (if Needed)
If you see buffer overflow errors (Error L10), reduce the sampling rate:
```
heroku drains:update --sampling-rate 25 d. -a heroku-log-demo
```
* Replace \ with the ID from heroku drains.
## 4.3 Generate and Verify Logs in OpenObserve
Generate logs by hitting your app’s endpoints:
```
for i in {1..20}; do curl https://heroku-log-demo-d1dbe34d60a5.herokuapp.com/; curl https://heroku-log-demo-d1dbe34d60a5.herokuapp.com/error; curl https://heroku-log-demo-d1dbe34d60a5.herokuapp.com/health; sleep 2; done
```
* Expect: Heroku Log Demo, Server Error, OK responses.
Check the forwarder logs to confirm forwarding:
```
heroku logs --tail -a heroku-log-forwarder�
```
* Expect: Forwarded 2 logs to OpenObserve for each batch.
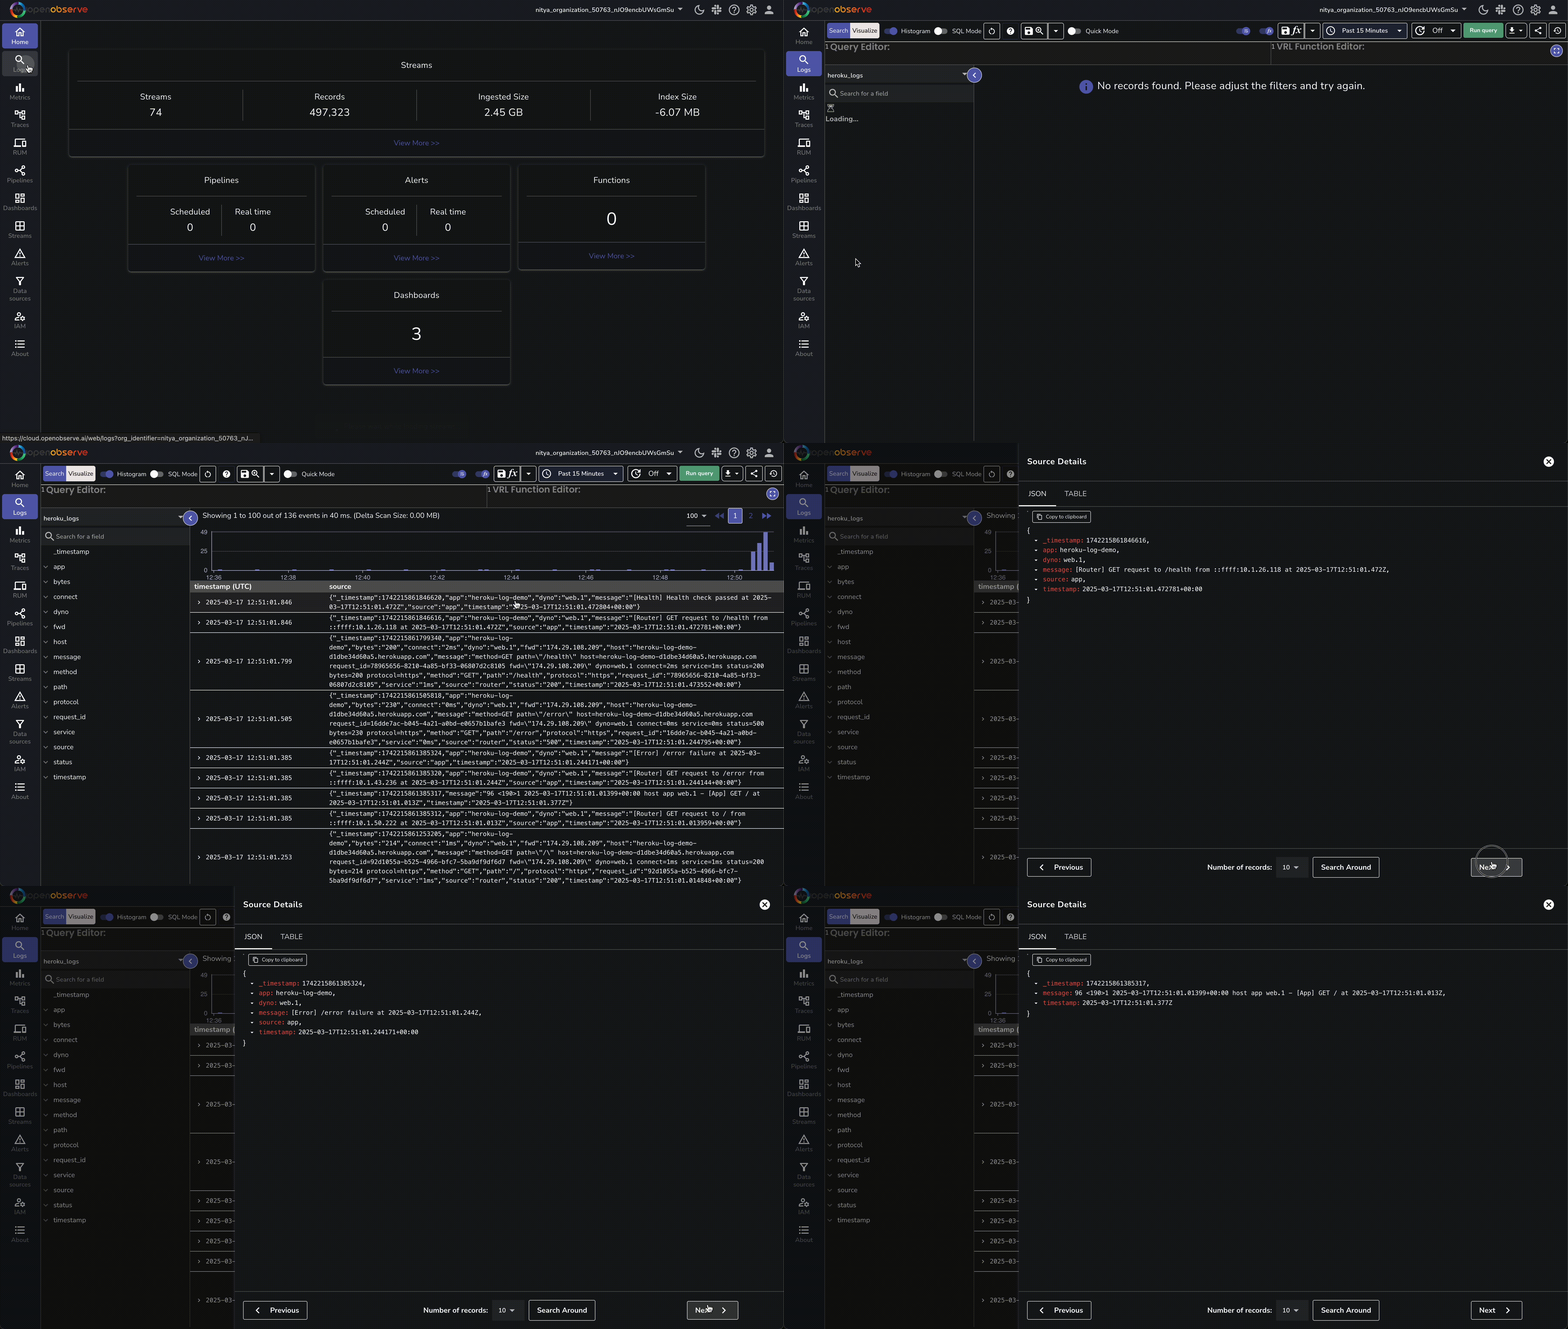
Check OpenObserve:
* Log in to [cloud.openobserve.ai](https://cloud.openobserve.ai).
* Go to **Logs \> heroku\_logs**.
* You should see structured logs like:
```
{
"_timestamp": 1742212529552670,
"app": "heroku-log-demo",
"dyno": "web.1",
"message": "[Health] Health check passed at 2025-03-17T11:55:29.180Z",
"source": "app",
"timestamp": "2025-03-17T11:55:29.181454+00:00"
},
{
"_timestamp": 1742212529463033,
"app": "heroku-log-demo",
"bytes": "200",
"connect": "1ms",
"dyno": "web.1",
"fwd": "174.29.108.209",
"host": "heroku-log-demo-d1dbe34d60a5.herokuapp.com",
"message": "method=GET path=\"/health\" host=heroku-log-demo-d1dbe34d60a5.herokuapp.com request_id=5e94fa15-2ec6-4ac7-a3a3-b34652c9459a fwd=\"174.29.108.209\" dyno=web.1 connect=1ms service=1ms status=200 bytes=200 protocol=https",
"method": "GET",
"path": "/health",
"protocol": "https",
"request_id": "5e94fa15-2ec6-4ac7-a3a3-b34652c9459a",
"service": "1ms",
"source": "router",
"status": "200",
"timestamp": "2025-03-17T11:55:29.181643+00:00"
}
```
---
## Troubleshooting Common Issues
## No Logs or Missing Log Types in OpenObserve
* **Verify Heroku Logs:** Check the demo app logs in the dashboard (More \> View logs). Ensure diverse logs are generated (e.g., \[Router\], \[App\], \[Error\]).
* **Confirm Drain Setup:**
```
heroku drains -a heroku-log-demo
```
* If missing, re-add the drain:
```
heroku drains:add "https://heroku-log-forwarder.herokuapp.com/logs" -a heroku-log-demo
```
* Check for Logplex Errors: Monitor for buffer overflows:
```
heroku logs --tail -a heroku-log-demo
```
* If you see Error L10, reduce the sampling rate:
```
heroku drains:update --sampling-rate 10 d. -a heroku-log-demo
```
* Inspect Forwarder Logs:
```
heroku logs --tail -a heroku-log-forwarder
```
* Look for Forwarded X logs to OpenObserve. If you see Unparsed log warnings, adjust the logRegex or routerRegex to match your log format.
* **Fix:** If logs aren’t structured, refine the regex in index.js. Contact OpenObserve support if ingestion fails.
## Truncated Logs
* **Cause:** Heroku’s 10KB log line limit.
* **Fix:** Simplify log messages in index.js (e.g., shorten messages), then redeploy:
```
git commit -am "Simplify logs" && git push heroku main
```
## Delivery Errors
* **Symptom:** Error L10 in Heroku logs.
* **Fix:** Test the forwarder endpoint:
```
curl https://heroku-log-forwarder.herokuapp.com/logs
```
Contact OpenObserve support if the issue persists.
## Slow Log Delivery
* **Fix:** Increase the heartbeat interval in index.js to 120 seconds or reduce traffic volume.
---
## Take Your Heroku Log Monitoring to the Next Level
You’ve successfully built a robust log monitoring system for your Heroku app with OpenObserve Cloud. Now, you can debug issues, trace performance bottlenecks, and gain historical insights-all in a searchable, structured format. With your Heroku logs correctly streaming into OpenObserve, you can further process them using [pipelines](https://openobserve.ai/pipelines/), visualize them using [interactive dashboards](https://openobserve.ai/visualization-and-dashboards/), or set up [custom alerts](https://openobserve.ai/alerts/) to proactively assess and mitigate potential issues with your application.
To make your monitoring pipeline even more effective, consider these additional steps:
* **Dive Deeper with Filters:** Leverage OpenObserve’s query interface to filter logs effortlessly (e.g., source:app or source:router) and zero in on the data you need.
* **Stay Proactive with Alerts:** Set up alerts for critical events, like status:500, in OpenObserve’s **Alerts** section to catch issues before they escalate.
* **Scale for Growth:** As your log volume grows, deploy multiple forwarder instances or fine-tune the sampling rate to maintain smooth performance.
Ready to explore more? Join the [OpenObserve Slack community](https://short.openobserve.ai/community) for expert support, practical tips, and updates to keep your logging setup running at its best.