# Monitoring Caddy, MinIO, NATS, and ScyllaDB with OpenObserve Dashboards
> A walkthrough of dashboard JSON structure, query patterns, and integration architecture for Caddy, MinIO, NATS, and ScyllaDB.
Source: https://openobserve.ai/blog/monitoring-caddy-minio-nats-scallydb-with-openobserve/
Published: 2026-01-05
Authors: Anurag Vishwakarma
Category: How To
Tags: Metrics
---
When running distributed infrastructure, visibility is everything. You need to know when a backend goes unhealthy, when storage is filling up, or when message queues are backing up ideally before your users notice.
This guide documents how I built four production monitoring dashboards for OpenObserve, covering the full integration pipeline from metrics collection to dashboard visualization. Whether you're monitoring these specific services or building dashboards for something else entirely, the patterns and techniques here apply universally.
## What Are These Services?
Before diving into metrics and dashboards, it helps to understand **what each component does** and **why it’s commonly used in production systems**.
### Caddy
**Caddy** is a modern web server and reverse proxy.
It’s often used as:
* An **edge proxy** in front of backend services
* A **TLS termination layer** with automatic HTTPS
* A lightweight alternative to Nginx or Apache
Caddy is popular because it has **sane defaults**, automatic certificate management, and strong observability support through Prometheus metrics-making it ideal for production environments.
### MinIO
**MinIO** is a high-performance, **S3-compatible object storage system**.
It’s commonly used for:
* Storing application assets, backups, and artifacts
* Data lakes and analytics pipelines
* Cloud-native and on-prem object storage
In distributed mode, MinIO runs as a cluster of nodes and exposes detailed metrics around **storage capacity, request rates, drive health, and latency**, which are critical to monitor as data grows.
### NATS
**NATS** is a lightweight, high-throughput **messaging system**.
It’s typically used for:
* Event-driven architectures
* Microservice communication
* Streaming data (via JetStream)
NATS is designed to be fast and simple, but issues like **slow consumers, connection saturation, and message backlogs** can silently degrade systems-making observability essential in production setups.
### ScyllaDB
**ScyllaDB** is a distributed, NoSQL database designed for **high throughput and low latency**.
It is API-compatible with Apache Cassandra but built in C++ with a **shard-per-core architecture**, allowing it to fully utilize modern hardware.
Because of this architecture:
* Metrics are exposed **per CPU core (shard)**
* Aggregation is required to understand host-level health
* Monitoring compactions, cache behaviour, and latency is critical to performance
### Why These Together?
These four components often appear together in modern systems:
* **Caddy** at the edge
* **NATS** for internal messaging
* **MinIO** for durable object storage
* **ScyllaDB** for low-latency data access
Monitoring them together provides visibility across the **request path, messaging layer, storage backend, and database**, which is exactly what production observability should enable.
## The Integration Pipeline
Before any dashboard can display data, you need to establish the flow of metrics from your services into OpenObserve. The architecture follows a standard observability pattern:
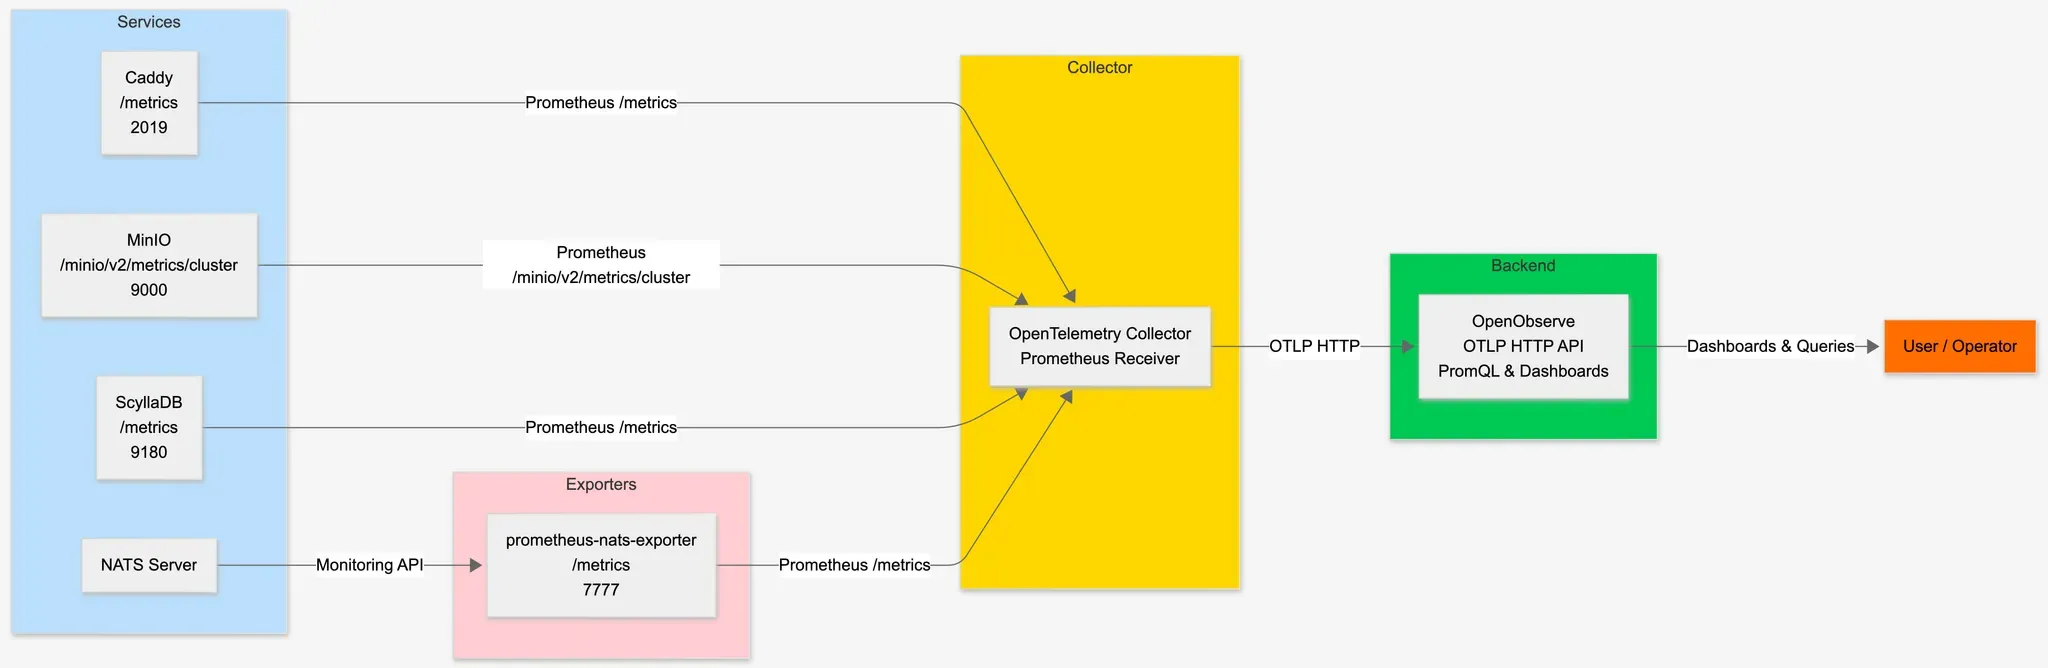
Each service exposes a Prometheus-compatible `/metrics` endpoint. The OpenTelemetry Collector scrapes these endpoints at regular intervals and forwards the data to OpenObserve via OTLP. This decoupled architecture means you can add new scrape targets without modifying your observability backend.
### Prometheus Endpoints
Most modern infrastructure components expose Prometheus metrics natively. Here are the endpoints I configured:
| Service | Endpoint | Port |
| --- | --- | --- |
| Caddy | `/metrics` | 2019 |
| MinIO | `/minio/v2/metrics/cluster` | 9000 |
| NATS | `/metrics` (prometheus-nats-exporter) | 7777 |
| ScyllaDB | `/metrics` | 9180 |
Note that NATS requires a separate exporter (prometheus-nats-exporter) since the NATS server doesn't expose Prometheus metrics directly. It queries the NATS monitoring endpoints and converts them to Prometheus format.
### OpenTelemetry Collector Configuration
The collector configuration defines which endpoints to scrape and where to send the data. Here's a complete working configuration:
```yaml
receivers:
prometheus:
config:
scrape_configs:
- job_name: 'caddy'
scrape_interval: 15s
static_configs:
- targets: ['caddy:2019']
- job_name: 'minio'
scrape_interval: 15s
metrics_path: /minio/v2/metrics/cluster
static_configs:
- targets: ['minio-1:9000', 'minio-2:9000', 'minio-3:9000', 'minio-4:9000']
- job_name: 'nats'
scrape_interval: 15s
static_configs:
- targets: ['prometheus-nats-exporter:7777']
- job_name: 'scylladb'
scrape_interval: 15s
static_configs:
- targets: ['scylla-1:9180', 'scylla-2:9180', 'scylla-3:9180']
exporters:
otlphttp:
endpoint: ""
headers:
Authorization: "Basic "
service:
pipelines:
metrics:
receivers: [prometheus]
exporters: [otlphttp]
```
The `scrape_interval` of 15 seconds provides a good balance between resolution and overhead. For high-cardinality metrics or resource-constrained environments, you might increase this to 30s or 60s.
## Understanding Dashboard JSON Structure
OpenObserve dashboards are stored as JSON documents. Understanding this structure is essential for programmatic dashboard creation or bulk modifications. Here's the top-level schema:
```json
{
"version": 5,
"dashboardId": "unique_id",
"title": "Dashboard Name",
"description": "What this monitors",
"tabs": [...],
"variables": {...},
"defaultDatetimeDuration": {...}
}
```
The `version` field indicates the dashboard schema version-currently 5 is the latest. The `dashboardId` must be unique within your organization.
### Tabs and Panels
Dashboards are organized into tabs, each containing multiple panels. This structure helps organize related metrics together-for example, separating "Cluster Health" from "Storage" from "Performance" metrics:
```json
"tabs": [
{
"tabId": "cluster_health",
"name": "Cluster Health",
"panels": [...]
},
{
"tabId": "storage",
"name": "Storage",
"panels": [...]
}
]
```
### Panel Structure
Panels are where the actual visualization happens. Each panel needs several components: identity, visualization type, configuration, query, and layout position. Here's a complete panel definition:
```json
{
"id": "Panel_001",
"type": "line",
"title": "Request Rate",
"description": "HTTP requests per second across all endpoints. Normal range: 100-1000/s. Sudden drops may indicate upstream failures.",
"config": {
"show_legends": true,
"legends_position": null,
"unit": "ops",
"decimals": 0,
"top_results_others": false,
"axis_border_show": false,
"legend_width": {"unit": "px"},
"base_map": {"type": "osm"},
"map_view": {"zoom": 1, "lat": 0, "lng": 0},
"map_symbol_style": {"size": "by Value", "size_by_value": {"min": 1, "max": 100}, "size_fixed": 2},
"drilldown": [],
"mark_line": [],
"connect_nulls": false,
"no_value_replacement": "",
"wrap_table_cells": false,
"table_transpose": false,
"table_dynamic_columns": false
},
"queryType": "promql",
"queries": [{
"query": "sum by (host) (rate(http_requests_total{host=~\\"$host\\"}[5m]))",
"customQuery": true,
"vrlFunctionQuery": "",
"fields": {
"stream": "http_requests_total",
"stream_type": "metrics",
"x": [], "y": [], "z": [], "breakdown": [],
"filter": {"filterType": "group", "logicalOperator": "AND", "conditions": []}
},
"config": {
"promql_legend": "{host}"
}
}],
"layout": {"x": 0, "y": 0, "w": 24, "h": 9, "i": 1},
"htmlContent": "",
"markdownContent": ""
}
```
**Important**: The `config` object must include ALL fields shown above, even if you're using defaults. Missing fields cause HTTP 400 errors during import. This is a common pitfall when creating dashboards programmatically.
The `description` field is often overlooked but extremely valuable-it's displayed when users hover over the panel title. Use it to explain what normal values look like and what anomalies might indicate.
## Choosing Panel Types and Units
Selecting the right visualization makes the difference between a dashboard that's glanced at and one that's actually useful for debugging.
### Panel Types
OpenObserve supports several panel types, each suited for different kinds of data:
| Panel Type | Best For | Visual Style |
| --- | --- | --- |
| `gauge` | Binary states, percentages with thresholds | Circular gauge with color zones |
| `metric` | Single current values | Large number display |
| `line` | Time-series trends, rates | Line chart over time |
| `area` | Cumulative values, stacked data | Filled area chart |
| `table` | Text data, multi-value displays | Tabular format |
| `bar` | Comparisons, distributions | Horizontal/vertical bars |
| `pie` | Proportional breakdowns | Pie/donut chart |
**Decision framework:**
- **Is it a rate or trend?** → Use `line`
- **Is it memory, disk, or cumulative?** → Use `area` (the filled area conveys "fullness")
- **Is it a percentage or health status?** → Use `gauge` (visual threshold indicators)
- **Is it a current count or single value?** → Use `metric` (large, scannable)
- **Is it version info or text labels?** → Use `table`
### Units
Proper units make values instantly interpretable. OpenObserve automatically formats values based on the unit:
| Unit | Input Value | Displayed As | Use Case |
| --- | --- | --- | --- |
| `short` | 1500 | 1,500 | Generic counts |
| `ops` | 1500 | 1.5K/s | Operations per second |
| `bytes` | 1073741824 | 1 GB | Memory, disk space |
| `Bps` | 104857600 | 100 MB/s | Throughput |
| `percent` | 75.5 | 75.5% | Percentages |
| `ms` | 150 | 150ms | Latency (milliseconds) |
| `µs` | 150 | 150µs | Latency (microseconds) |
| `dtdurations` | 86400 | 1d 0h 0m | Uptime, durations |
For latency metrics, choose the unit that keeps displayed values in a readable range (1-1000). If your latencies are typically microseconds, use `µs`; if they're typically tens of milliseconds, use `ms`.
## Dynamic Filters with Variables
Static dashboards only get you so far. In production, you need to filter by host, datacenter, service instance, or other dimensions. OpenObserve variables make this possible.
### Defining Variables
Variables are defined in the `variables` section and populate filter dropdowns. The `query_values` type automatically discovers values from your actual metrics:
```json
"variables": {
"list": [
{
"type": "query_values",
"name": "host_name",
"label": "Host",
"query_data": {
"stream_type": "metrics",
"stream": "your_metric_name",
"field": "host_name",
"max_record_size": 100
},
"value": "",
"options": [],
"multiSelect": true,
"hideOnDashboard": false,
"selectAllValueForMultiSelect": "all"
}
],
"showDynamicFilters": true
}
```
The `query_data.stream` should be a metric that exists on all the hosts/instances you want to filter by. The `query_data.field` is the label name in Prometheus format (e.g., `host_name`, `instance`, `job`).
Setting `multiSelect: true` allows users to select multiple values simultaneously, which is useful for comparing hosts or showing aggregate views.
### Using Variables in Queries
Reference variables in PromQL queries using the `$variable_name` syntax with regex matching:
```
# Single variable
your_metric{host_name=~"$host_name"}
# Multiple variables
your_metric{host_name=~"$host_name", datacenter=~"$dc", environment=~"$env"}
```
The `=~` operator performs regex matching, which is necessary for multiSelect variables where the value might be `host1|host2|host3`.
## Query Patterns for Production Metrics
Writing effective PromQL queries requires understanding how Prometheus metric types work.
### Counters vs Gauges
Prometheus has distinct metric types that require different query approaches:
**Counters** only increase (e.g., total requests, total bytes sent). Always wrap counters with `rate()` or `increase()`:
```
# Rate of requests per second
rate(http_requests_total[5m])
# Total requests in the last hour
increase(http_requests_total[1h])
```
The `[5m]` range vector tells Prometheus to calculate the rate over the last 5 minutes of data points. Shorter ranges are more responsive but noisier; longer ranges are smoother but less responsive.
**Gauges** can go up or down (e.g., current memory usage, active connections). Use directly:
```
# Current memory usage
process_resident_memory_bytes
# Current connection count
database_connections_active
```
### Aggregating Per-Instance Metrics
Many services expose metrics per-shard, per-worker, or per-thread. ScyllaDB, for example, has one set of metrics per CPU shard. For a 16-core machine, that's 16 series per metric-too granular for most dashboards.
Aggregate using `sum by` or `avg by`:
```
# Total reads across all shards, grouped by host
sum by (host_name) (rate(scylla_storage_proxy_coordinator_reads{host_name=~"$host_name"}[5m]))
# Average CPU utilization per host
avg by (host_name) (scylla_reactor_utilization{host_name=~"$host_name"})
```
This reduces cardinality and makes visualizations actionable at the host level while still allowing per-host comparison.
### Legend Templates
The legend identifies each line in multi-series charts. Use single braces with label names:
```json
"config": {
"promql_legend": "{host_name}"
}
```
For multiple labels:
```json
"promql_legend": "{host_name} - {api}"
```
**Warning**: Double braces `{{host_name}}` will not render correctly. This is a common migration issue when converting [Grafana](/grafana-alternative/) dashboards.
## Layout System
OpenObserve uses a 48-column grid system for panel positioning. Understanding this system is essential for creating well-organized dashboards.
### Grid Basics
- **Width (`w`)**: Columns occupied. 48 = full width, 24 = half, 16 = third.
- **Position (`x`)**: Starting column. 0 = left edge, 24 = middle, 32 = two-thirds.
- **Position (`y`)**: Row position. Panels flow downward.
- **Height (`h`)**: Row height. 9 is standard for charts, 7 for single-value metrics.
- **Index (`i`)**: Unique panel index within the dashboard.
### Common Layout Patterns
**Two columns:**
```json
{"x": 0, "y": 0, "w": 24, "h": 9, "i": 1} // Left half
{"x": 24, "y": 0, "w": 24, "h": 9, "i": 2} // Right half
```
**Three columns:**
```json
{"x": 0, "y": 0, "w": 16, "h": 7, "i": 1} // Left third
{"x": 16, "y": 0, "w": 16, "h": 7, "i": 2} // Middle third
{"x": 32, "y": 0, "w": 16, "h": 7, "i": 3} // Right third
```
**KPI row + detail chart:**
```json
// Row of 4 KPIs
{"x": 0, "y": 0, "w": 12, "h": 7, "i": 1}
{"x": 12, "y": 0, "w": 12, "h": 7, "i": 2}
{"x": 24, "y": 0, "w": 12, "h": 7, "i": 3}
{"x": 36, "y": 0, "w": 12, "h": 7, "i": 4}
// Full-width detail chart below
{"x": 0, "y": 7, "w": 48, "h": 9, "i": 5}
```
---
## Dashboard Implementations
Here's a summary of key metrics and queries from each dashboard.
### Caddy Web Server
**Panels: 33 | Tabs: 4**
Caddy is a modern web server often used as a reverse proxy. The critical metrics focus on upstream health and configuration state:
```
# Upstream health status (1=healthy per backend)
caddy_reverse_proxy_upstreams_healthy{upstream=~"$upstream"}
# Count of unhealthy upstreams (should be 0)
count(caddy_reverse_proxy_upstreams_healthy == 0) or vector(0)
# Configuration reload status (1=success)
caddy_config_last_reload_successful
# Admin API request rate
sum by (path, code) (rate(caddy_admin_http_requests_total[5m]))
```
The `or vector(0)` pattern handles the edge case where all upstreams are healthy (no series match `== 0`), preventing "No Data" errors.
### MinIO Object Storage
**Panels: 81 | Tabs: 10**
MinIO provides S3-compatible object storage. In distributed mode, you need visibility into cluster health, storage capacity, and request patterns:
```sql
# Cluster health (1=healthy)
minio_cluster_health_status
# Storage utilization percentage
(1 - (minio_cluster_capacity_usable_free_bytes / minio_cluster_capacity_usable_total_bytes)) * 100
# S3 request rate by API operation
sum by (api) (rate(minio_s3_requests_total[5m]))
# Drive latency for read operations (microseconds)
minio_node_drive_latency_us{api="storage.ReadXL"}
# Offline drives (should be 0)
minio_cluster_drive_offline_total
```
The storage utilization query calculates used percentage from free/total, which is more reliable than trying to query used bytes directly.
### NATS Messaging
**Panels: 54 | Tabs: 6**
NATS is a high-performance message broker. The most critical operational metric is slow consumers-clients that can't keep up with message flow:
```sql
# Slow consumers (non-zero = problem)
gnatsd_varz_slow_consumers
# Connection utilization
(gnatsd_varz_connections / gnatsd_varz_max_connections) * 100
# Message throughput
rate(gnatsd_varz_in_msgs[5m])
rate(gnatsd_varz_out_msgs[5m])
# JetStream storage usage
gnatsd_varz_jetstream_stats_storage
```
If `slow_consumers` goes non-zero, clients are receiving messages slower than publishers are sending them. This leads to message buffering and potential drops.
### ScyllaDB
**Panels: 94 | Tabs: 7**
ScyllaDB exposes per-shard metrics due to its shard-per-core architecture. Aggregation is essential:
```sql
# Read latency aggregated to host level
sum by (host_name) (rate(scylla_storage_proxy_coordinator_read_latency{host_name=~"$host_name"}[5m]))
# Cache hit rate
sum(rate(scylla_cache_row_hits[5m])) / (sum(rate(scylla_cache_row_hits[5m])) + sum(rate(scylla_cache_row_misses[5m]))) * 100
# Pending compactions (high = backlogged)
scylla_compaction_manager_pending_compactions
# Per-keyspace storage
sum by (ks) (scylla_column_family_live_disk_space)
```
---
## Troubleshooting Common Issues
### Import Fails with 400 Error
The most common cause is missing fields in the panel `config` object. OpenObserve requires ALL config fields, even with default values:
```json
"config": {
"show_legends": true,
"legends_position": null,
"unit": "short",
"decimals": 0,
"drilldown": [],
"mark_line": [],
"connect_nulls": false,
"no_value_replacement": "",
"wrap_table_cells": false,
"table_transpose": false,
"table_dynamic_columns": false
// ... include ALL fields
}
```
### Duplicate Panel ID Error
Panel IDs must be globally unique across all tabs. When generating dashboards programmatically, use a structured naming scheme:
```
Panel_[tab_index]_[panel_index]
Panel_00_01, Panel_00_02, Panel_01_01, ...
```
### Panel Shows "No Data"
1. **Metric doesn't exist**: Verify in OpenObserve's Metrics explorer
2. **Filter mismatch**: Check that variable values match actual label values (case-sensitive)
3. **Time range**: Ensure data exists in the selected time window
4. **Query syntax**: Test the query in Stream > Metrics first
### Version Panels Empty
Table panels expecting label values (like software versions) need the metric to have the version as a label:
```
# This works if version is a label
minio_software_version_info{version=~".+"}
# Display format in legend
"promql_legend": "Version: {version}"
```
Building effective monitoring dashboards is part science, part craft. The technical structure is JSON schema, query syntax, layout grid provides the foundation. But the real value comes from understanding which metrics matter for each service and how to present them for quick interpretation.
These dashboards are available in the OpenObserve Dashboards repository. Contributions and improvements are welcome.
> **Open-source community contribution**
This blog is authored by a guest contributor who built and shared these dashboards as part of the OpenObserve open-source ecosystem. We welcome similar contributions from the community.