# Distributed Tracing in Go Applications with OpenTelemetry and OpenObserve
> Learn how to implement distributed tracing in Go applications using OpenTelemetry. This comprehensive guide covers auto and manual instrumentation, correlating traces, metrics, and logs, and visualizing data in OpenObserve for complete observability.
Source: https://openobserve.ai/blog/monitoring-go-with-opentelemetry/
Published: 2025-03-10
Authors: Chaitanya Sistla
Category: Engineering
Tags: Application, Logging, Tracing
---
## Distributed Tracing in Go Applications with OpenTelemetry and OpenObserve
Monitoring helps in understanding application behavior, debugging performance bottlenecks, and ensuring seamless observability. OpenTelemetry (OTel) provides a vendor-neutral instrumentation framework that enables distributed tracing across services. Coupled with OpenObserve, a scalable observability platform, developers can collect, store, and analyze traces, logs, and metrics efficiently.
In this guide, we’ll set up distributed tracing in a Go application using OpenTelemetry and OpenObserve. We will:
1. Clone a pre-built Golang tracing example from OpenObserve.
2. Configure and run the application with OpenObserve credentials.
3. Generate traces by hitting the Go application’s endpoint.
4. Observe traces, logs, and metrics in OpenObserve.
5. Build dashboards for deep insights.
## Prerequisites
- Go installed
- OpenObserve account
- Docker (optional for running OpenObserve locally)
## Step 1: Clone the Golang Tracing Example
OpenObserve provides a pre-configured repository demonstrating correlation between logs, traces, and metrics in a Go application. Clone the repository:
```bash
git clone https://github.com/openobserve/correlation.git
cd correlation
```
This repository includes a simple Go application instrumented with OpenTelemetry, exporting telemetry data to OpenObserve.
## Step 2: Configure OpenObserve Credentials
OpenObserve requires an API key and an endpoint to ingest traces. Update the file with your OpenObserve credentials: 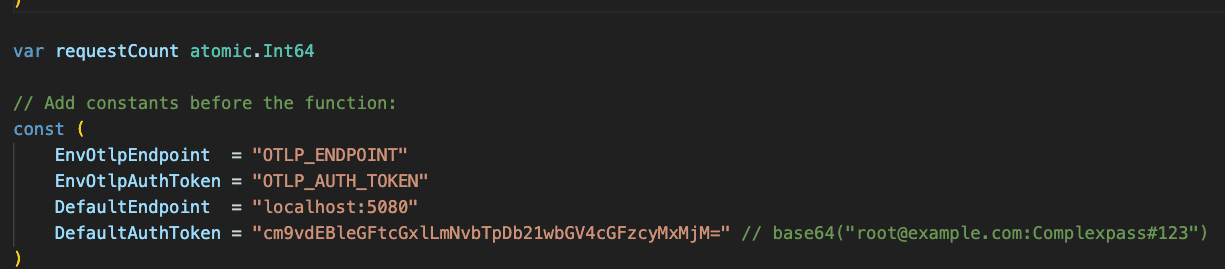
## Step 3: Run the Go Application
Start the application:
```bash
go run main.go
```
The application will start a web server exposing an endpoint that generates traces on port 8080
## Step 4: Generate Traces
Send a request to the Go application’s endpoint to trigger traces:
```bash
http://localhost:8080
```
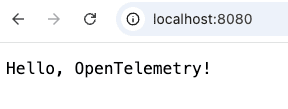
This will create an OpenTelemetry trace with span details, sending data to OpenObserve.
## Step 5: Observe Traces, Logs, and Metrics in OpenObserve
### Viewing Traces
1. Log in to OpenObserve.
2. Navigate to the **Traces** section.
3. Search for the service name used in the Go application.
4. This app creates everything within default stream. 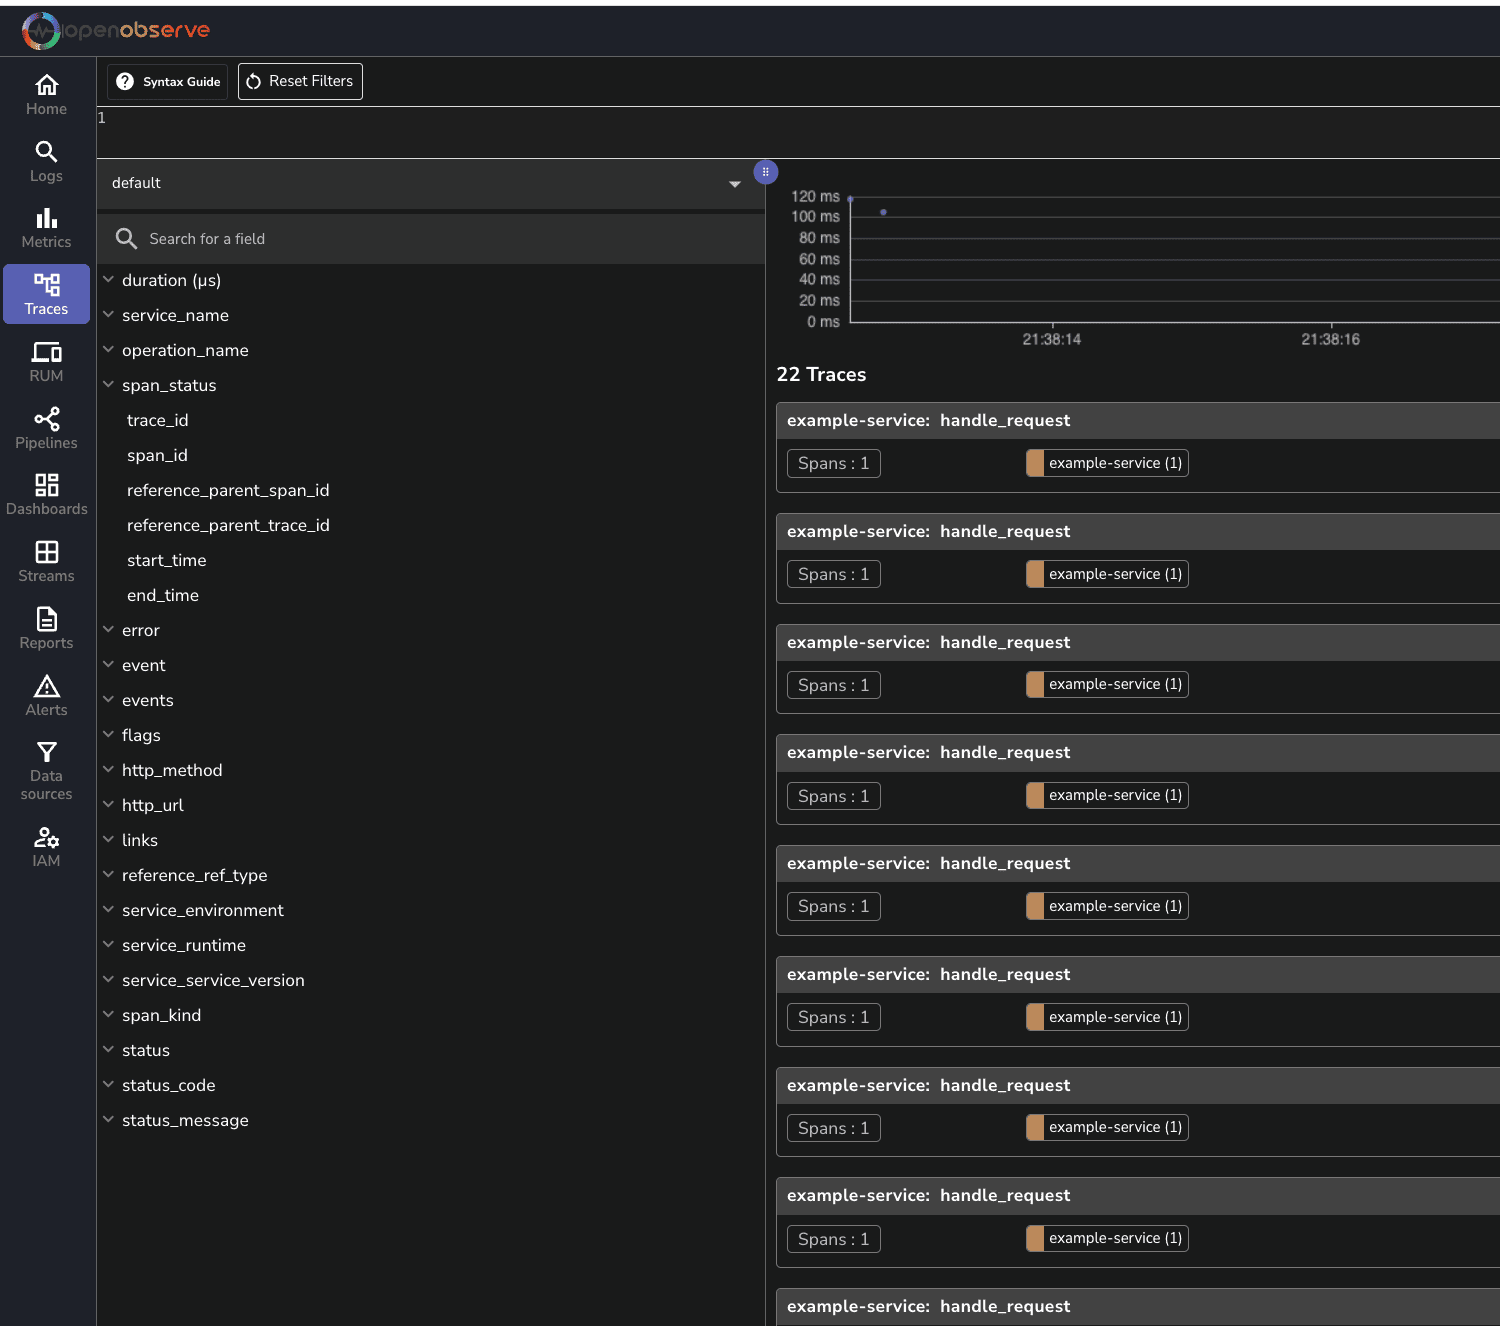 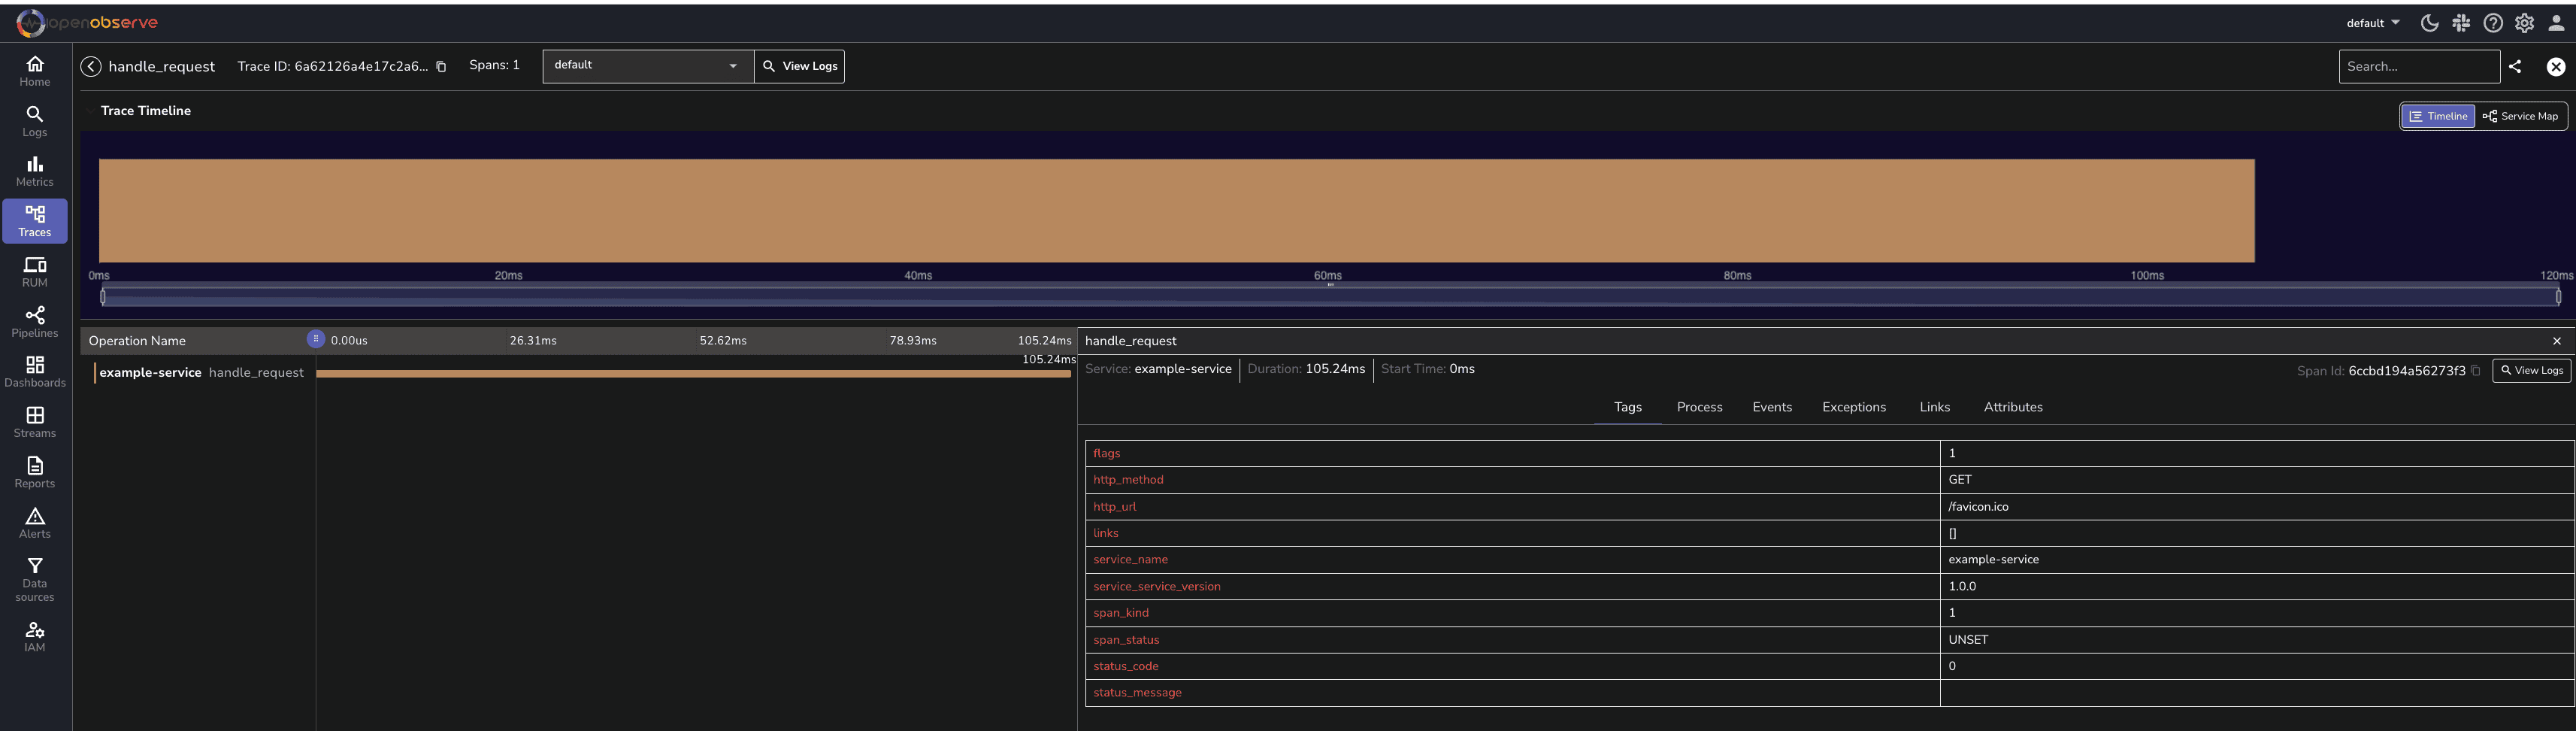
### Viewing Logs
1. Navigate to the **Logs** section.
2. Filter logs by the Go service name.
3. This app creates everything within default stream. 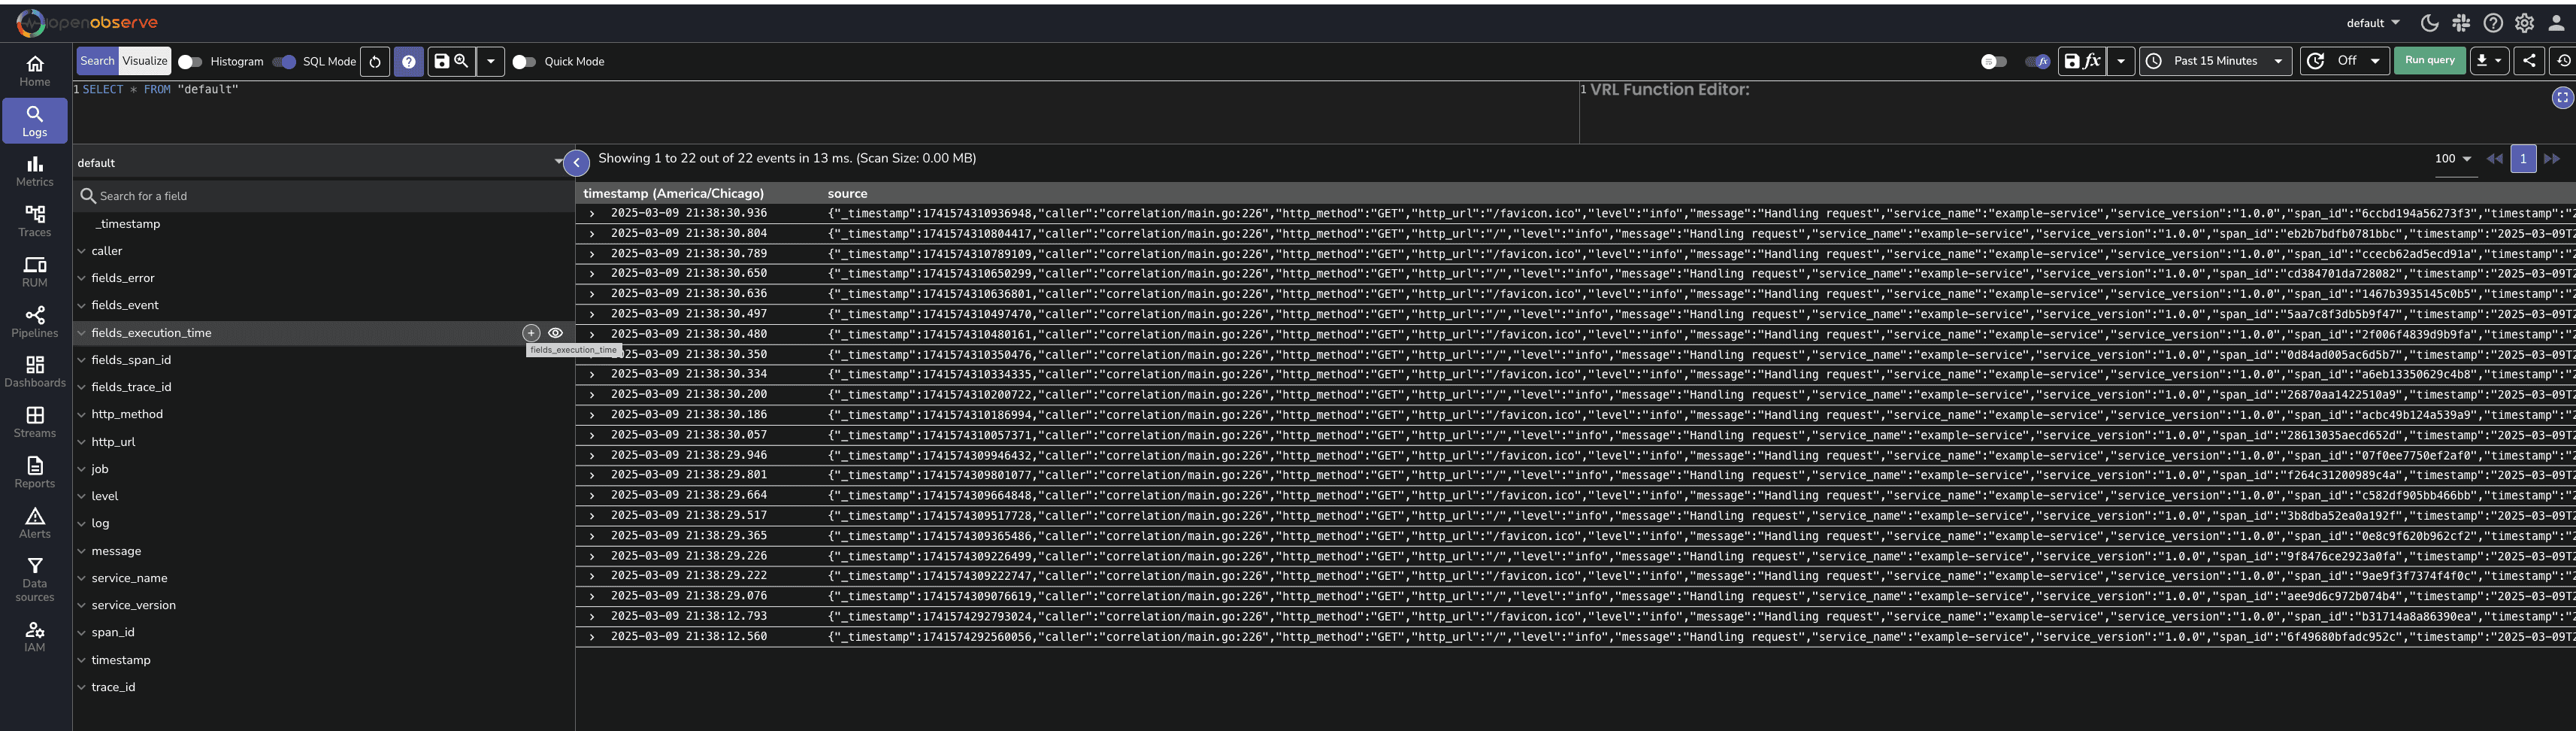
### Viewing Metrics
1. Navigate to **Metrics**.
2. Search for metrics emitted by the Go application.
3. This app creates everything within request_counter stream. 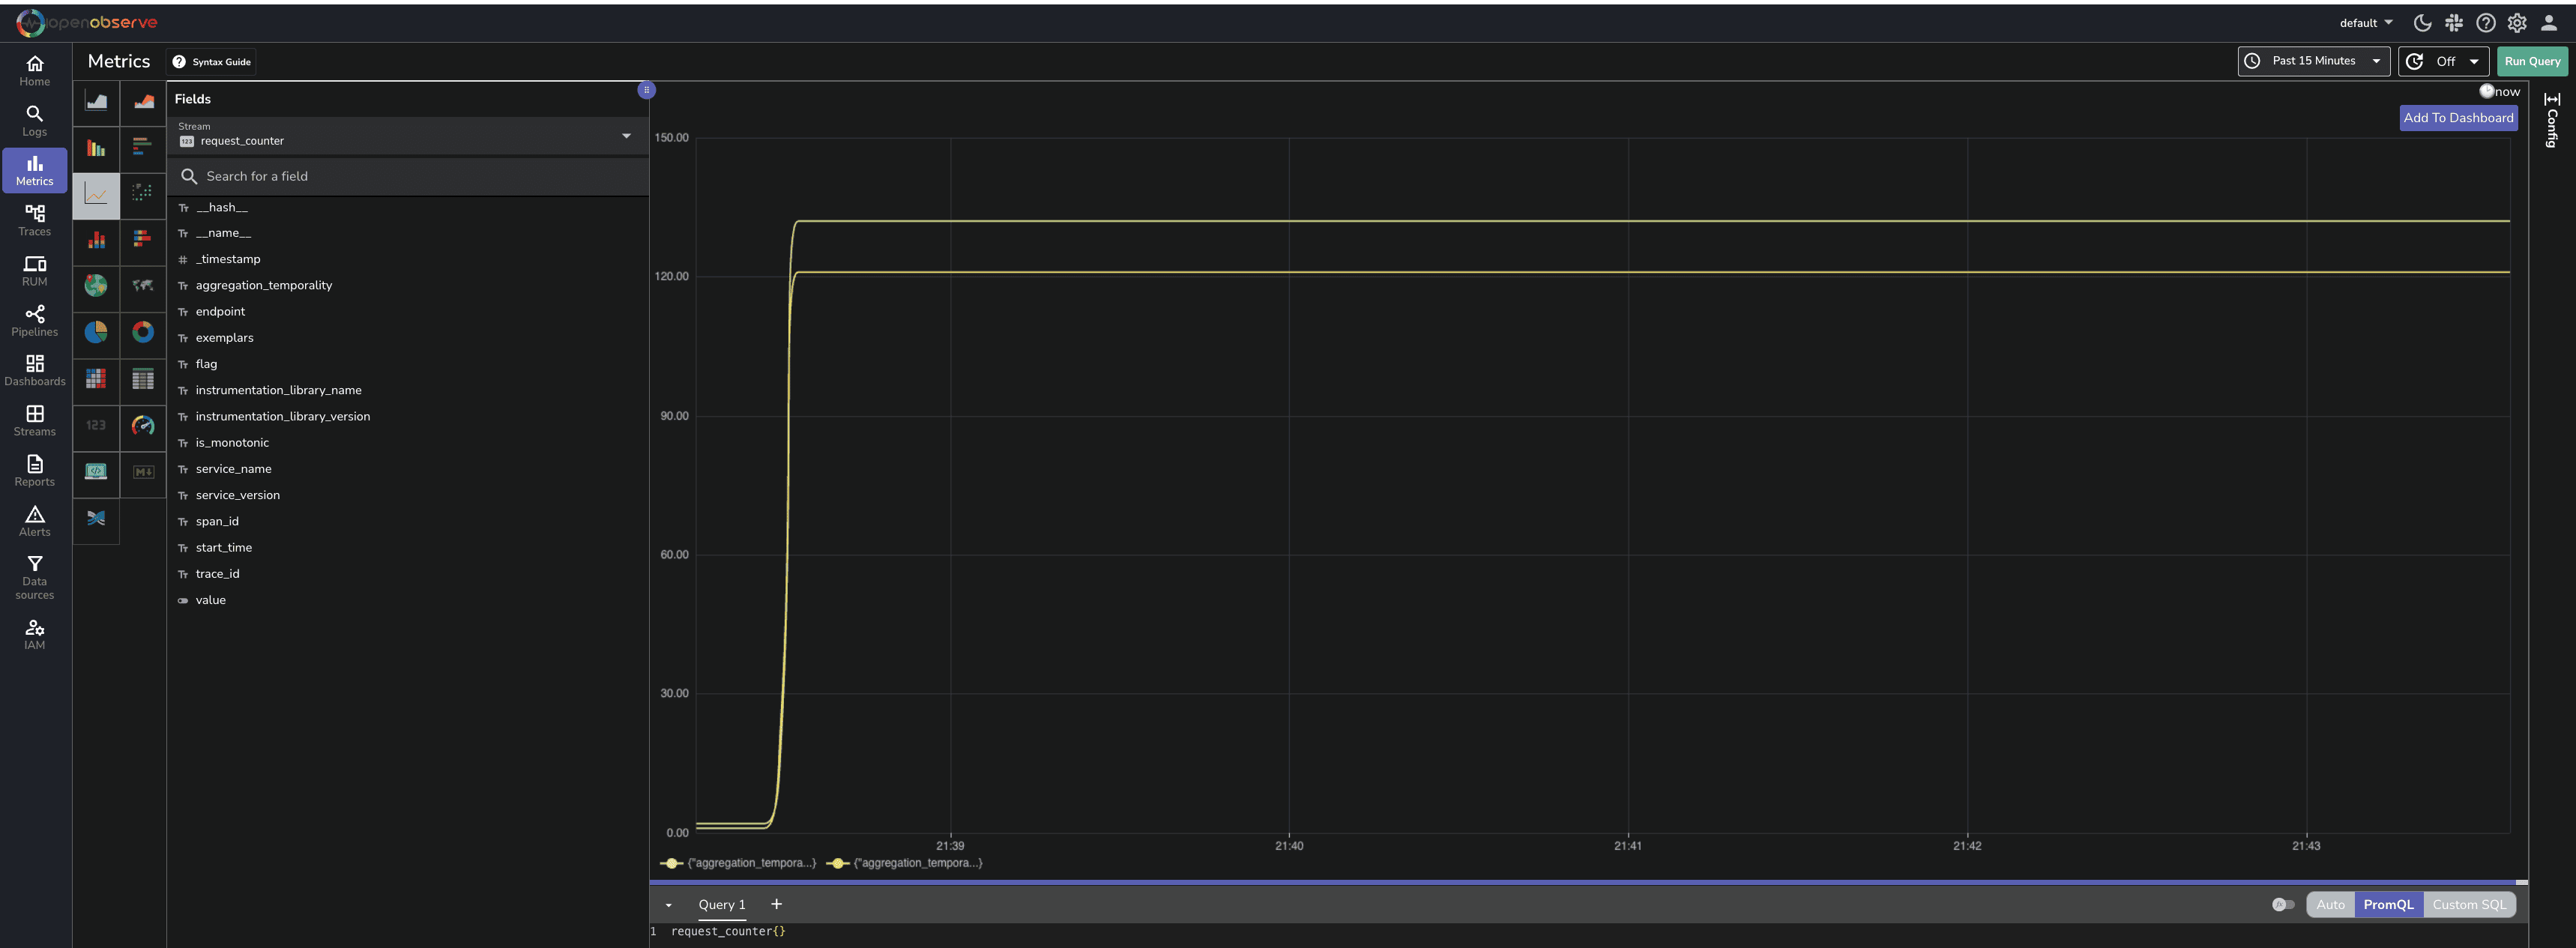
## Step 6: Build Dashboards in OpenObserve
Dashboards provide a consolidated view of application performance. To create a dashboard:
1. Go to **Dashboards** in OpenObserve.
2. Click **New Dashboard** and name it.
3. Add panels for your trace analysis.
4. Customize queries to filter specific services or endpoints.
5. Save and share the dashboard with your team.
6. You can download this test dashboard that helps with logs to traces correlation test.dashboard.json 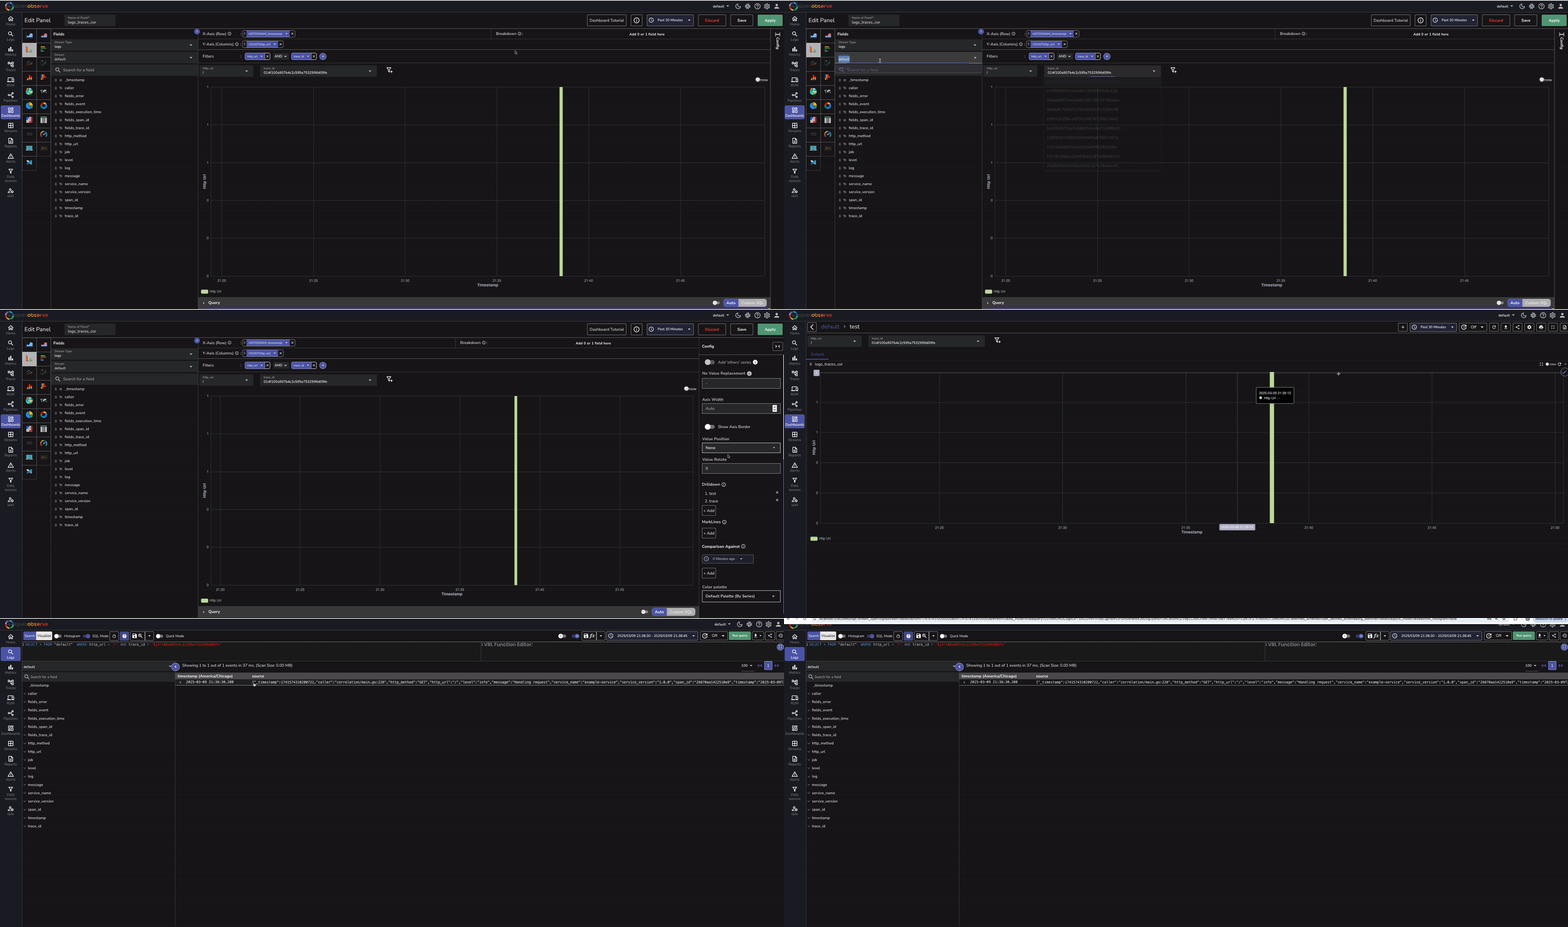
## Why Full Observability Matters in Go Applications
Implementing traces, logs, and metrics together helps in:
- **Better Debugging**: Identify slow dependencies in microservices.
- **Performance Optimization**: Track response times and optimize critical paths.
- **Root Cause Analysis**: Trace failures back to their source across distributed services.
- **Holistic Observability**: Combine traces with logs and metrics for full-stack insights.
With OpenTelemetry and OpenObserve, teams can achieve seamless end-to-end observability in Go applications.
## Conclusion
In this guide, we demonstrated how to instrument a Go application with OpenTelemetry, send traces to OpenObserve, and analyze observability data. With these insights, developers can enhance application reliability, debug faster, and optimize performance.
Try it out today and supercharge your Go observability with OpenObserve!
Have questions? Join our Slack community for support. Watch our video for detailed understanding.
Happy Monitoring! 🚀