# OpenTelemetry Astronomy Shop Demo App with OpenObserve Integration
> Deploy the OpenTelemetry Astronomy Shop demo and stream traces, metrics, and logs to OpenObserve with Helm. Easily configure OTLP and visualize everything in dashboards.
Source: https://openobserve.ai/blog/opentelemetry-astronomy-shop-demo/
Published: 2025-10-13
Authors: Chaitanya Sistla
Category: Engineering
Tags: OpenTelemetry, Tracing, Logging, Observability, OpenObserve
---
Want to explore OpenTelemetry with a real-world example? The OpenTelemetry Astronomy Shop demo is a microservices-based application that generates traces, metrics, and logs \- perfect for learning observability concepts. We’ll cover how to set it up and ingest all that telemetry data into OpenObserve.
## What You'll Build
This guide walks you through deploying the OpenTelemetry demo application and configuring it to send observability data to OpenObserve, giving you a complete view of your distributed system's performance.
## Prerequisites
1. OpenTelemetry Astronomy Shop demo
2. OpenTelemetry Helm Chart
3. [OpenObserve Cloud](https://cloud.openobserve.ai/) or [self-hosted instance](https://openobserve.ai/downloads/)
## Setup Steps
### Step 1: Clone the Demo Repository
```shell
git clone https://github.com/open-telemetry/opentelemetry-demo.git
```
### Step 2: Add the OpenTelemetry Helm Repository
```shell
helm repo add open-telemetry https://open-telemetry.github.io/opentelemetry-helm-charts
```
### Step 3: Configure OpenObserve Integration
Create a `values.yml` file with your OpenObserve-specific configuration. This tells the OpenTelemetry Collector where to send your data:
```
opentelemetry-collector:
config:
exporters:
otlphttp/openobserve:
endpoint: https://example.openobserve.ai/api/default/
headers:
Authorization: Basic TOKEN
stream-name: otel-demo
service:
pipelines:
traces:
exporters: [otlp, debug, spanmetrics, otlphttp/openobserve]
metrics:
exporters: [otlphttp/openobserve]
logs:
exporters: [otlphttp/openobserve]
```
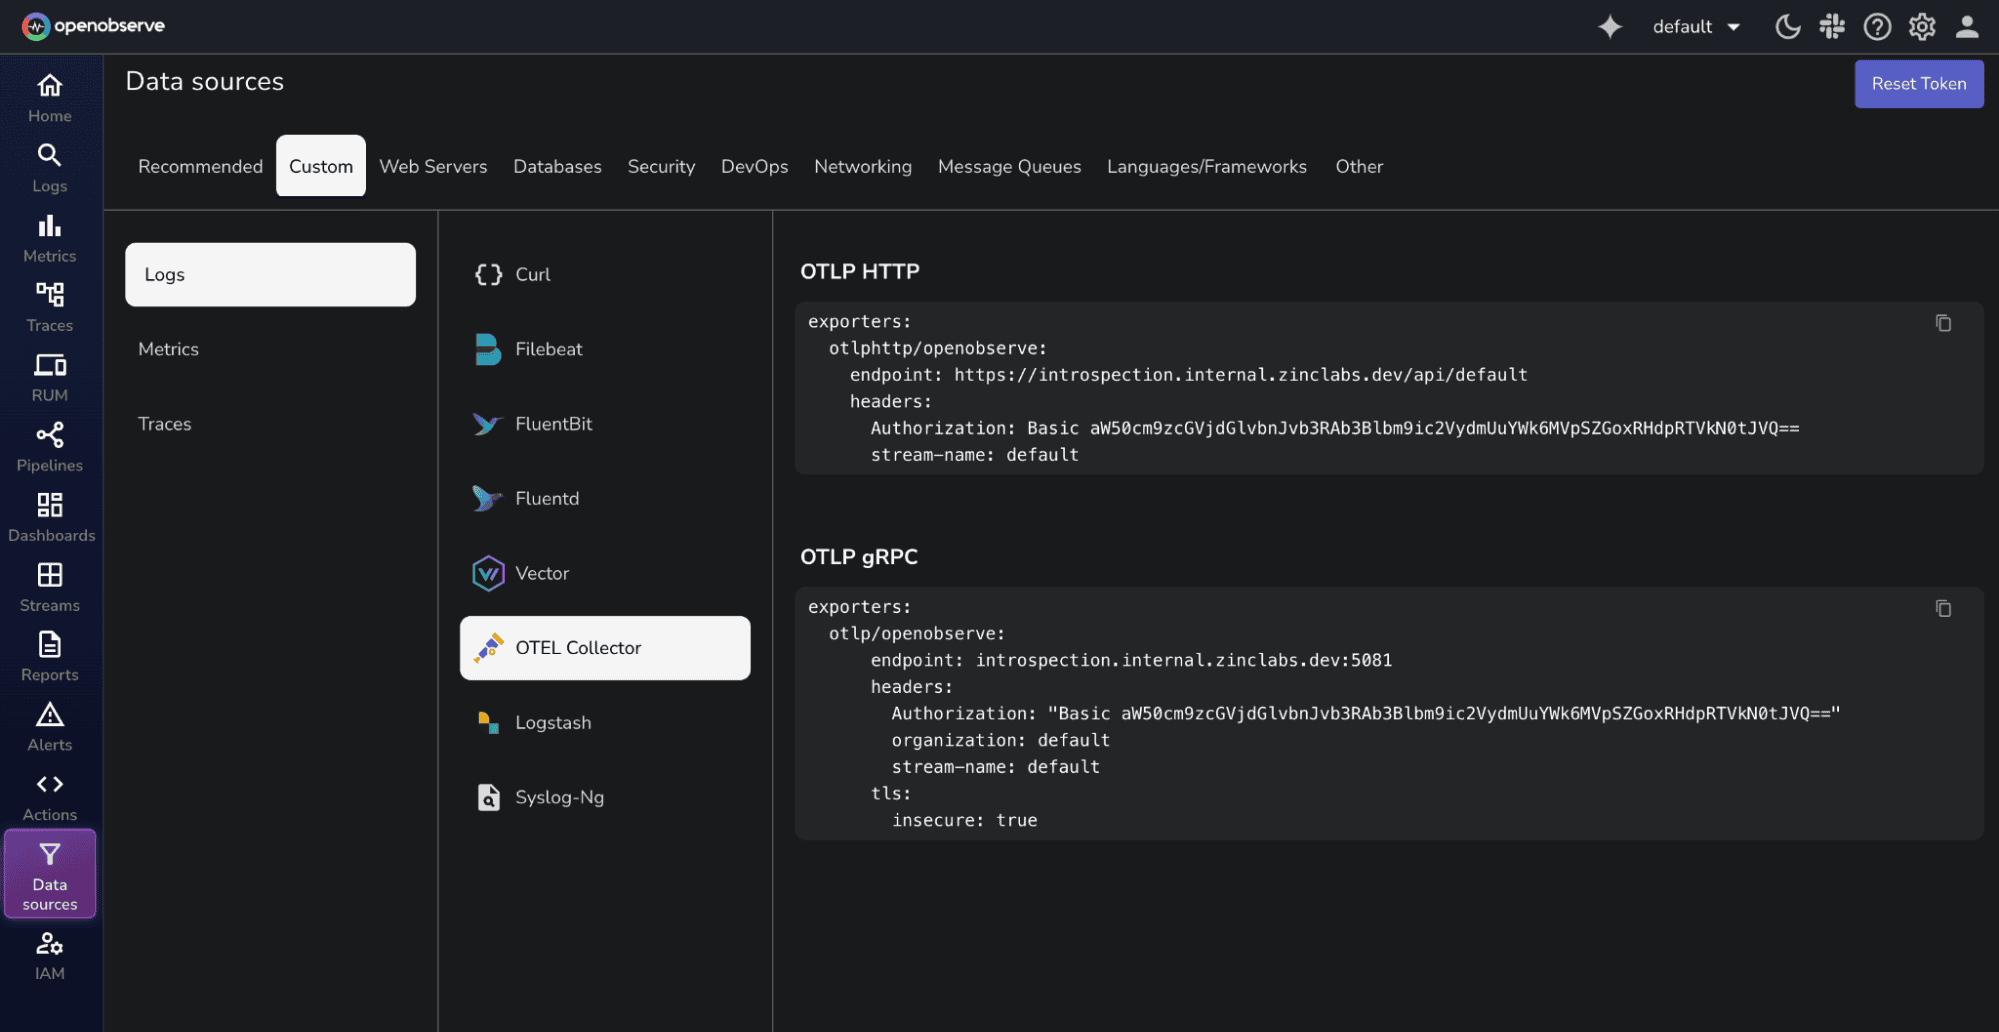
Replace `example.openobserve.ai` with your OpenObserve instance URL and `TOKEN` with your authentication token. You can find these configuration details in OpenObserve under **DataSources \> Custom \> Logs/Metrics/Traces \> OTEL Collector**.
### Step 4: Deploy with Helm
```shell
helm install otel-demo open-telemetry/opentelemetry-demo --values my-values.yml
```
### Step 5: Visualize in OpenObserve
Once deployed, head over to your OpenObserve dashboard. You'll see traces, metrics, and logs from the Astronomy Shop flowing in, ready to explore and analyze.
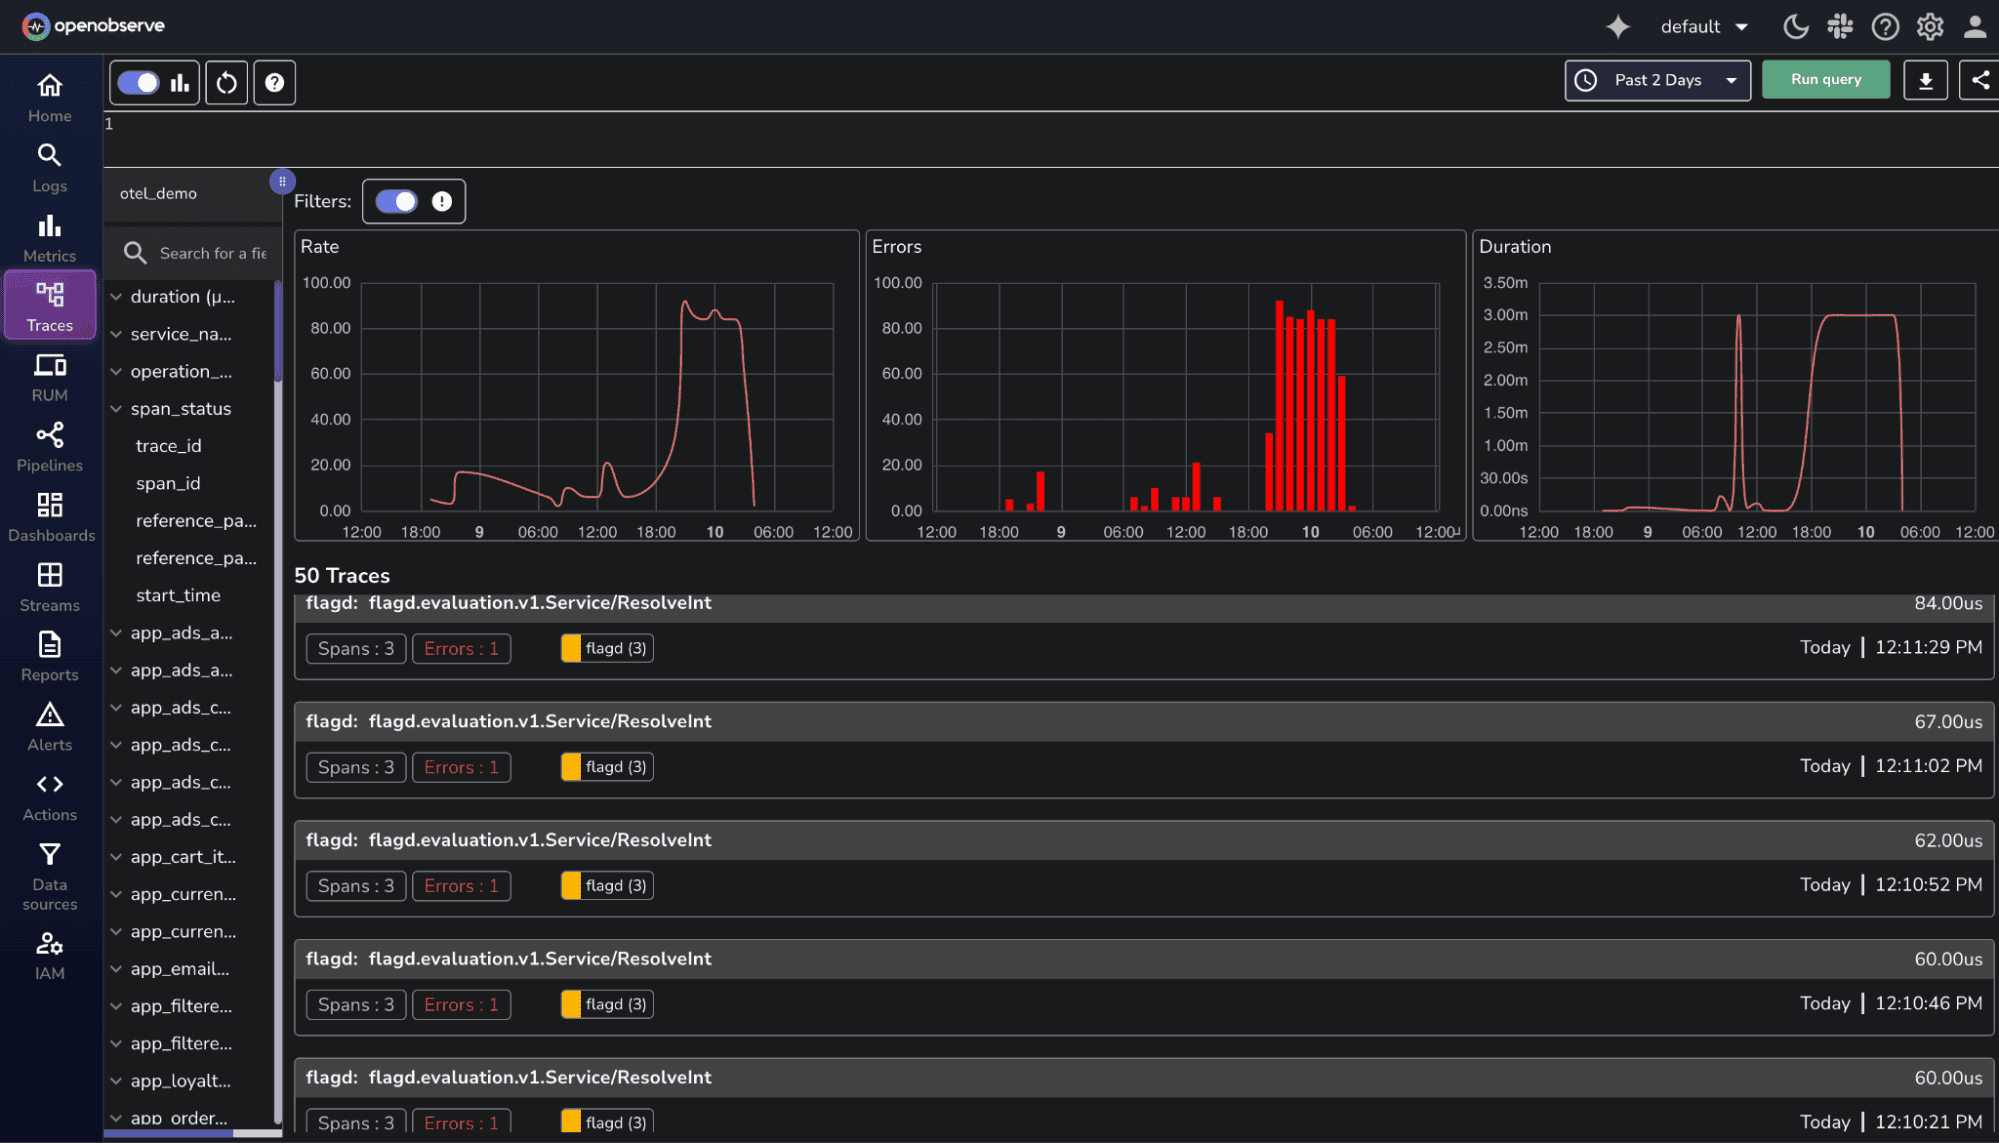
- Errors-only filter for Traces: Quickly isolate and inspect failed transactions by filtering traces with errors, helping you focus on problematic service paths.
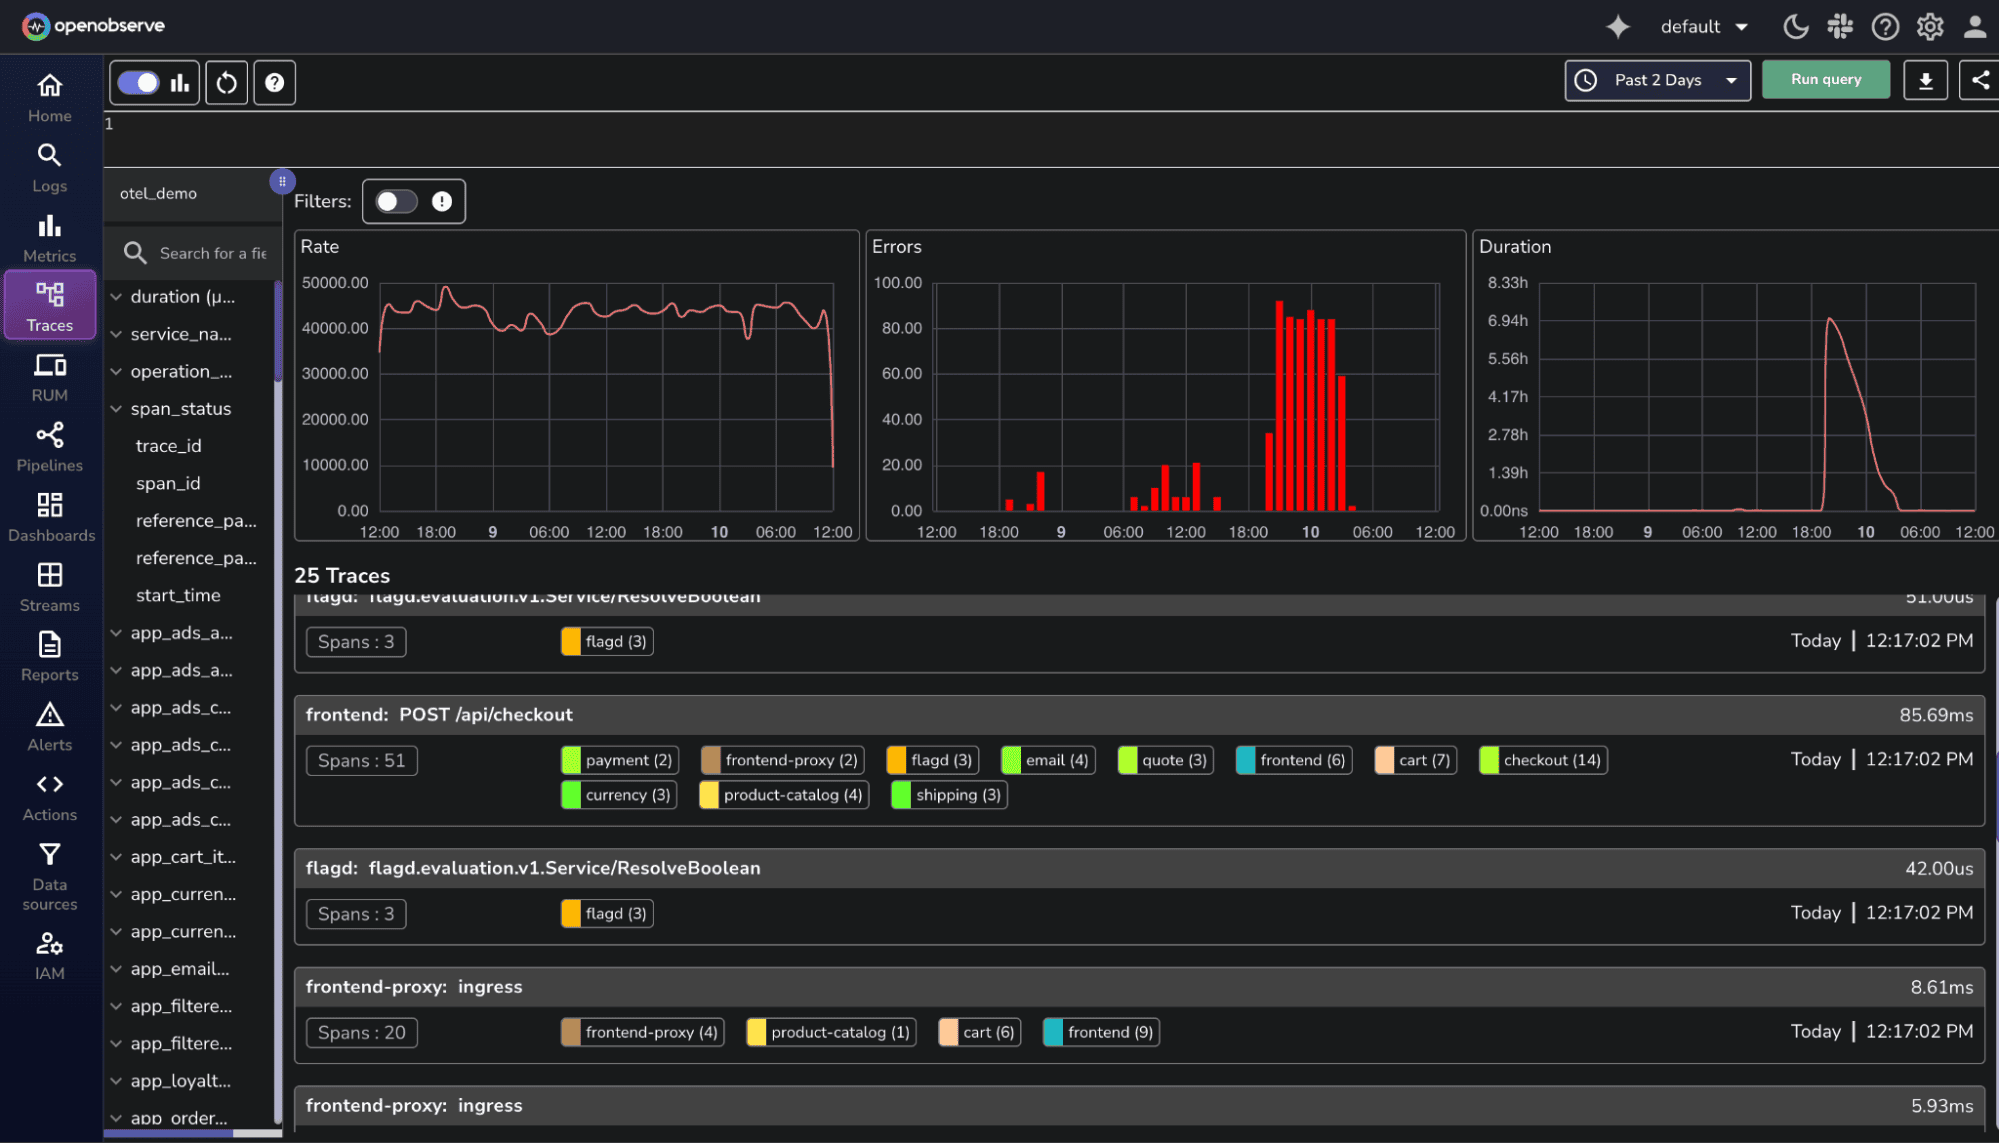
- Viewing all the traces: Explore all recorded traces in one place to get a high-level overview of request flows, system activity, and key RED metrics (Requests, Errors, Duration).
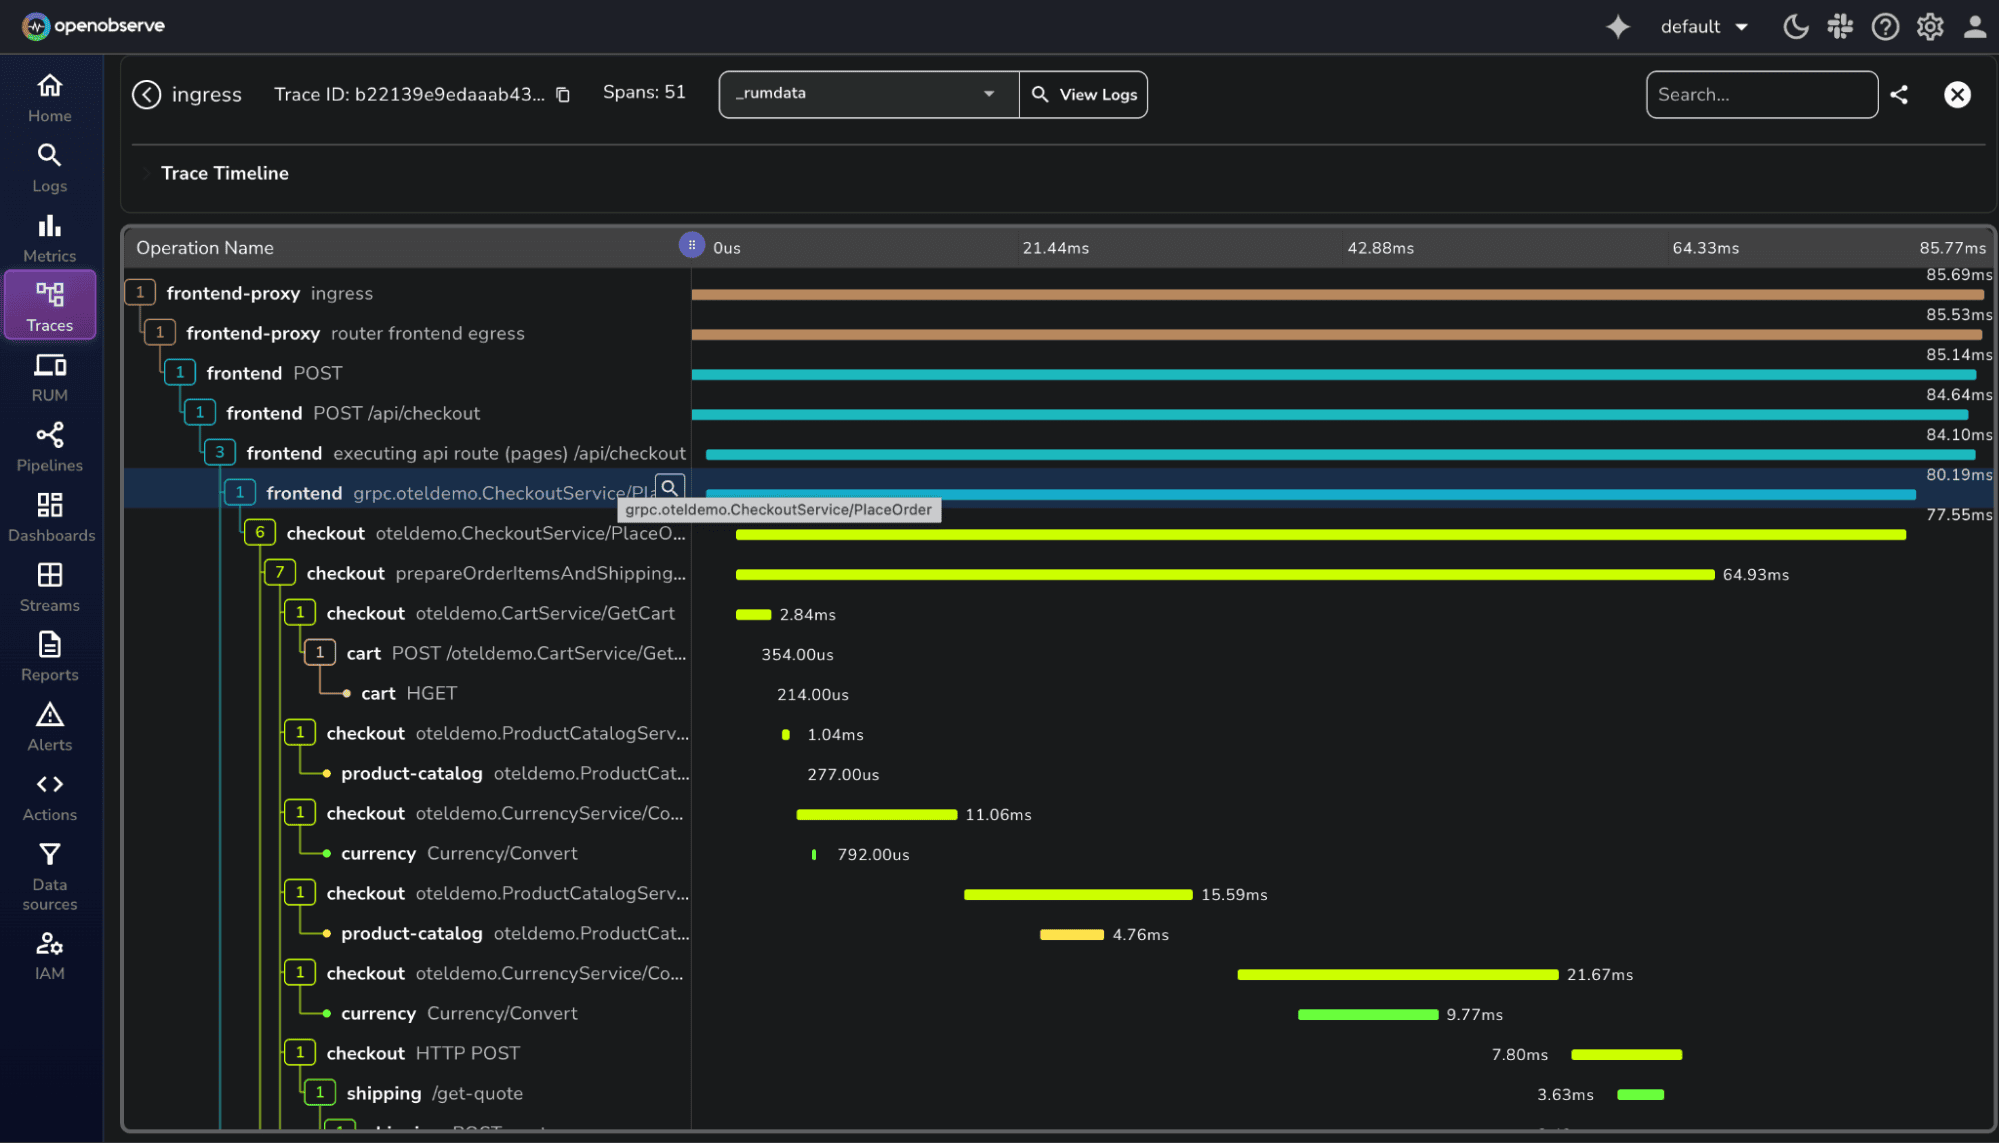
- Viewing all the spans of a Trace: Drill down into individual spans within a trace to understand how different microservices and components interacted during a request.
- Service map of entire microservices: Visualize service dependencies and call relationships across the Astronomy Shop, helping you see how components connect and communicate.
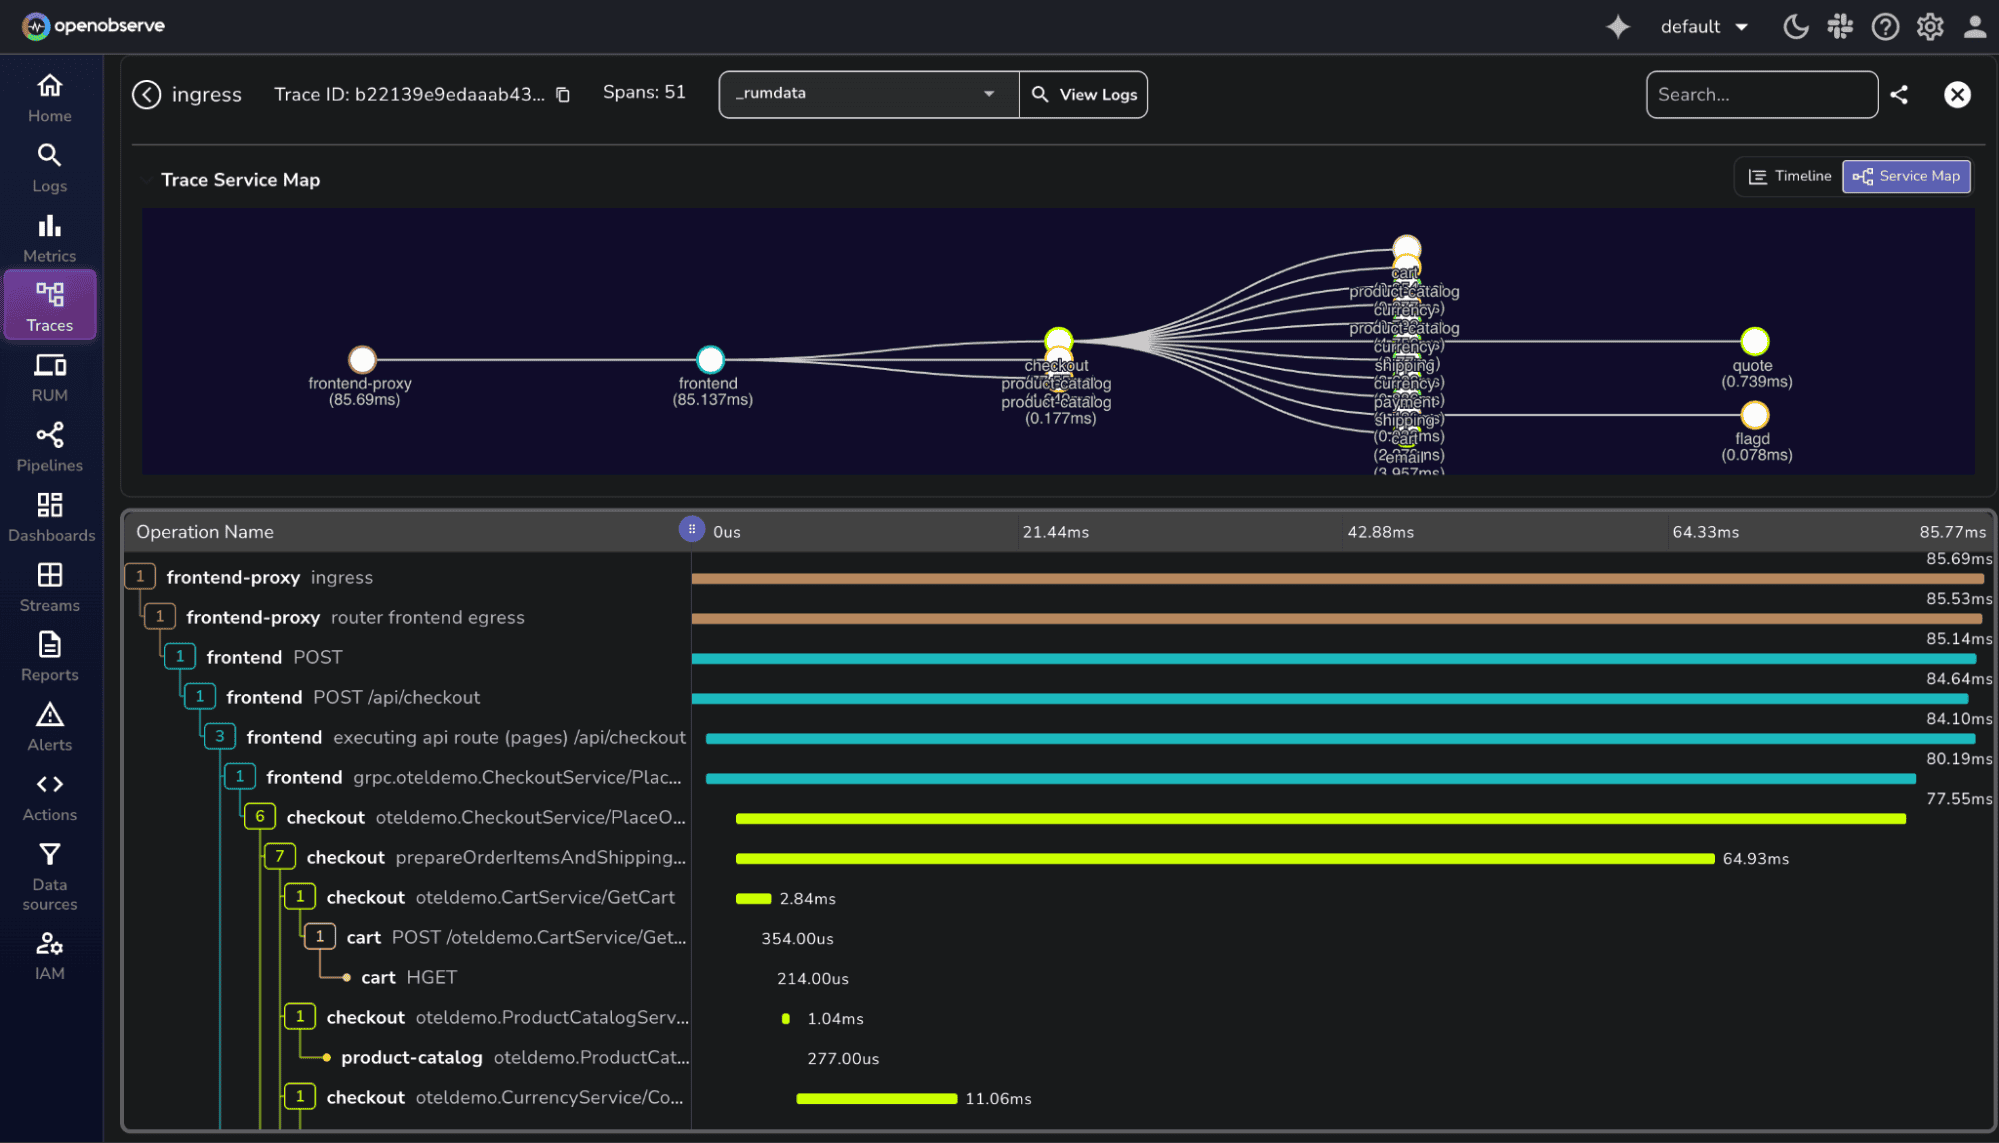
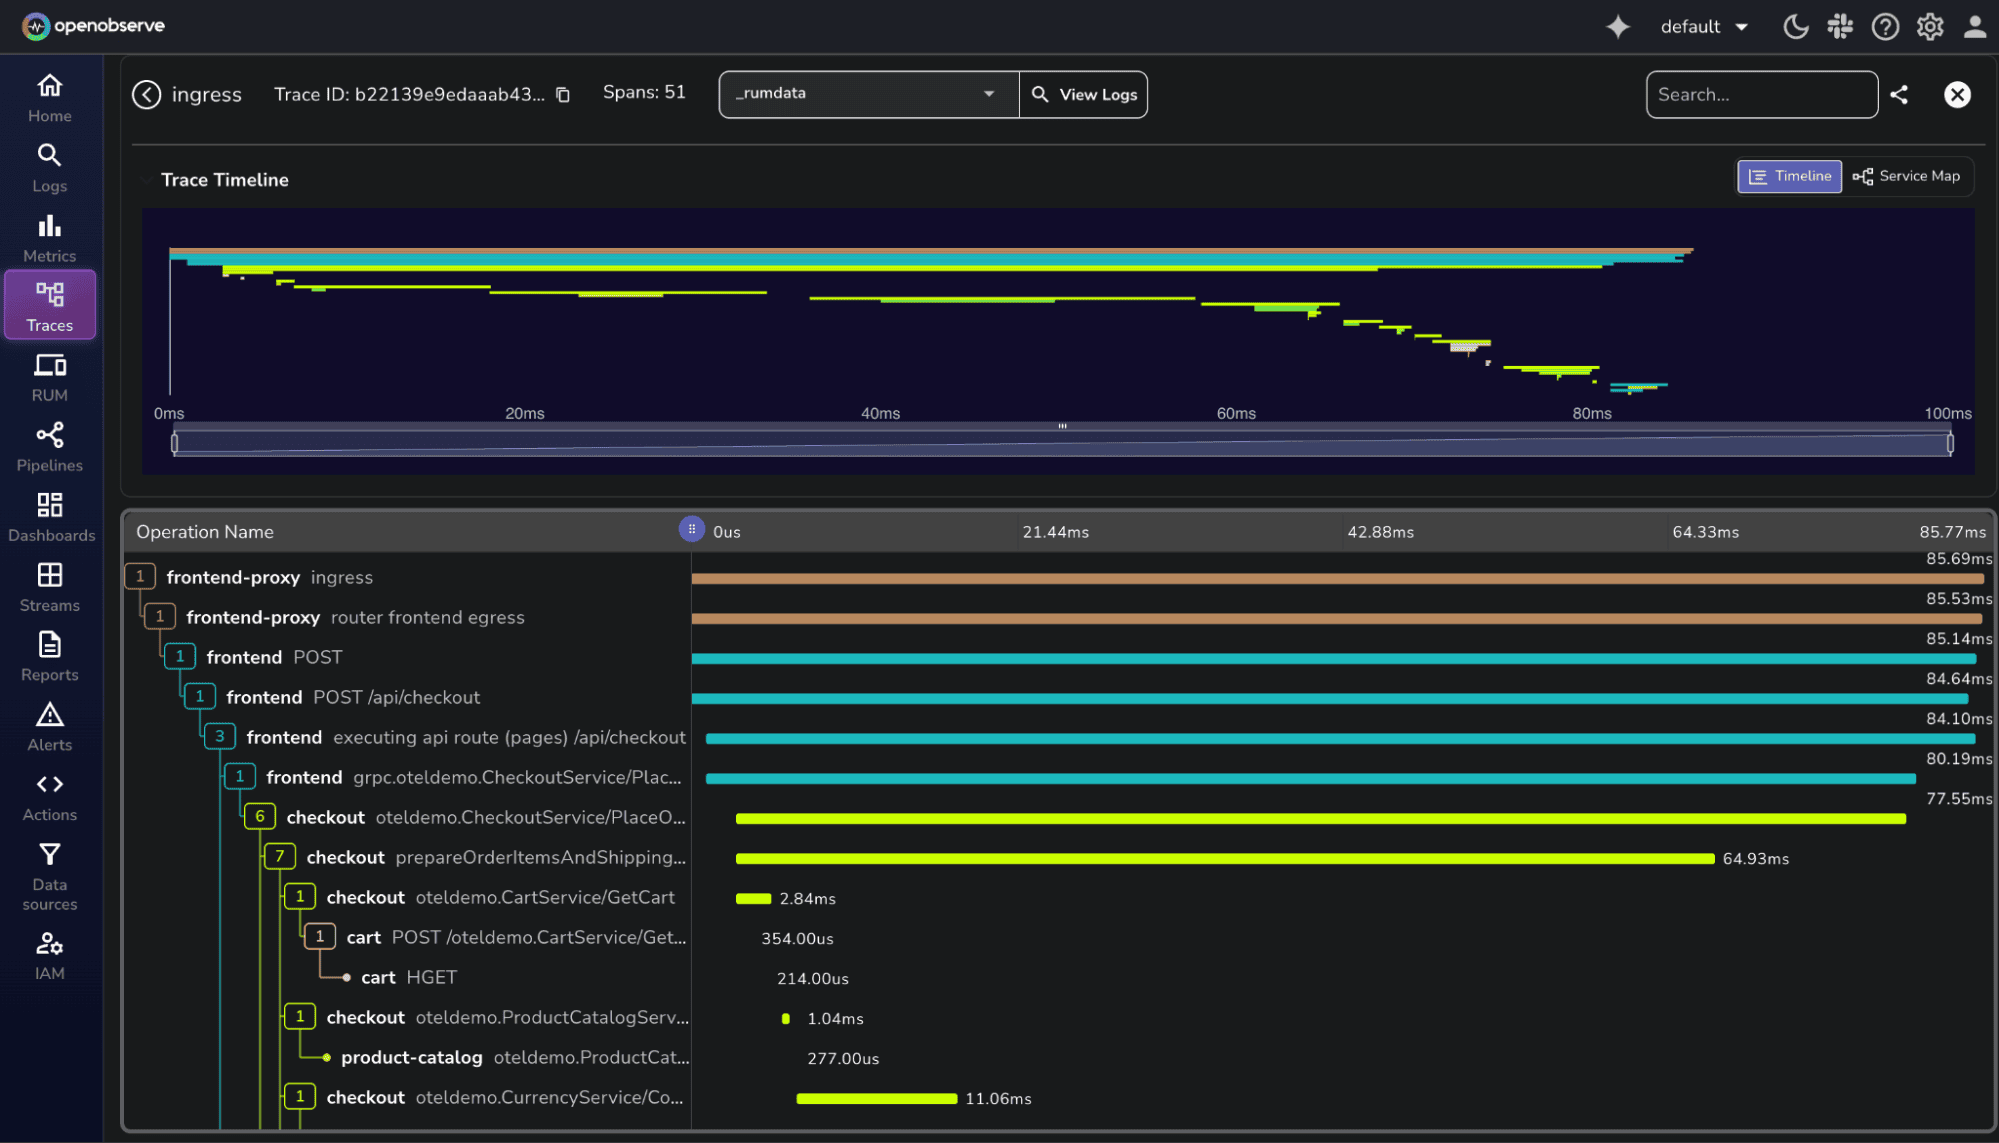
- Trace timeline for the Traces: Analyze request durations with a timeline view that shows latency contributions from each span in the trace.
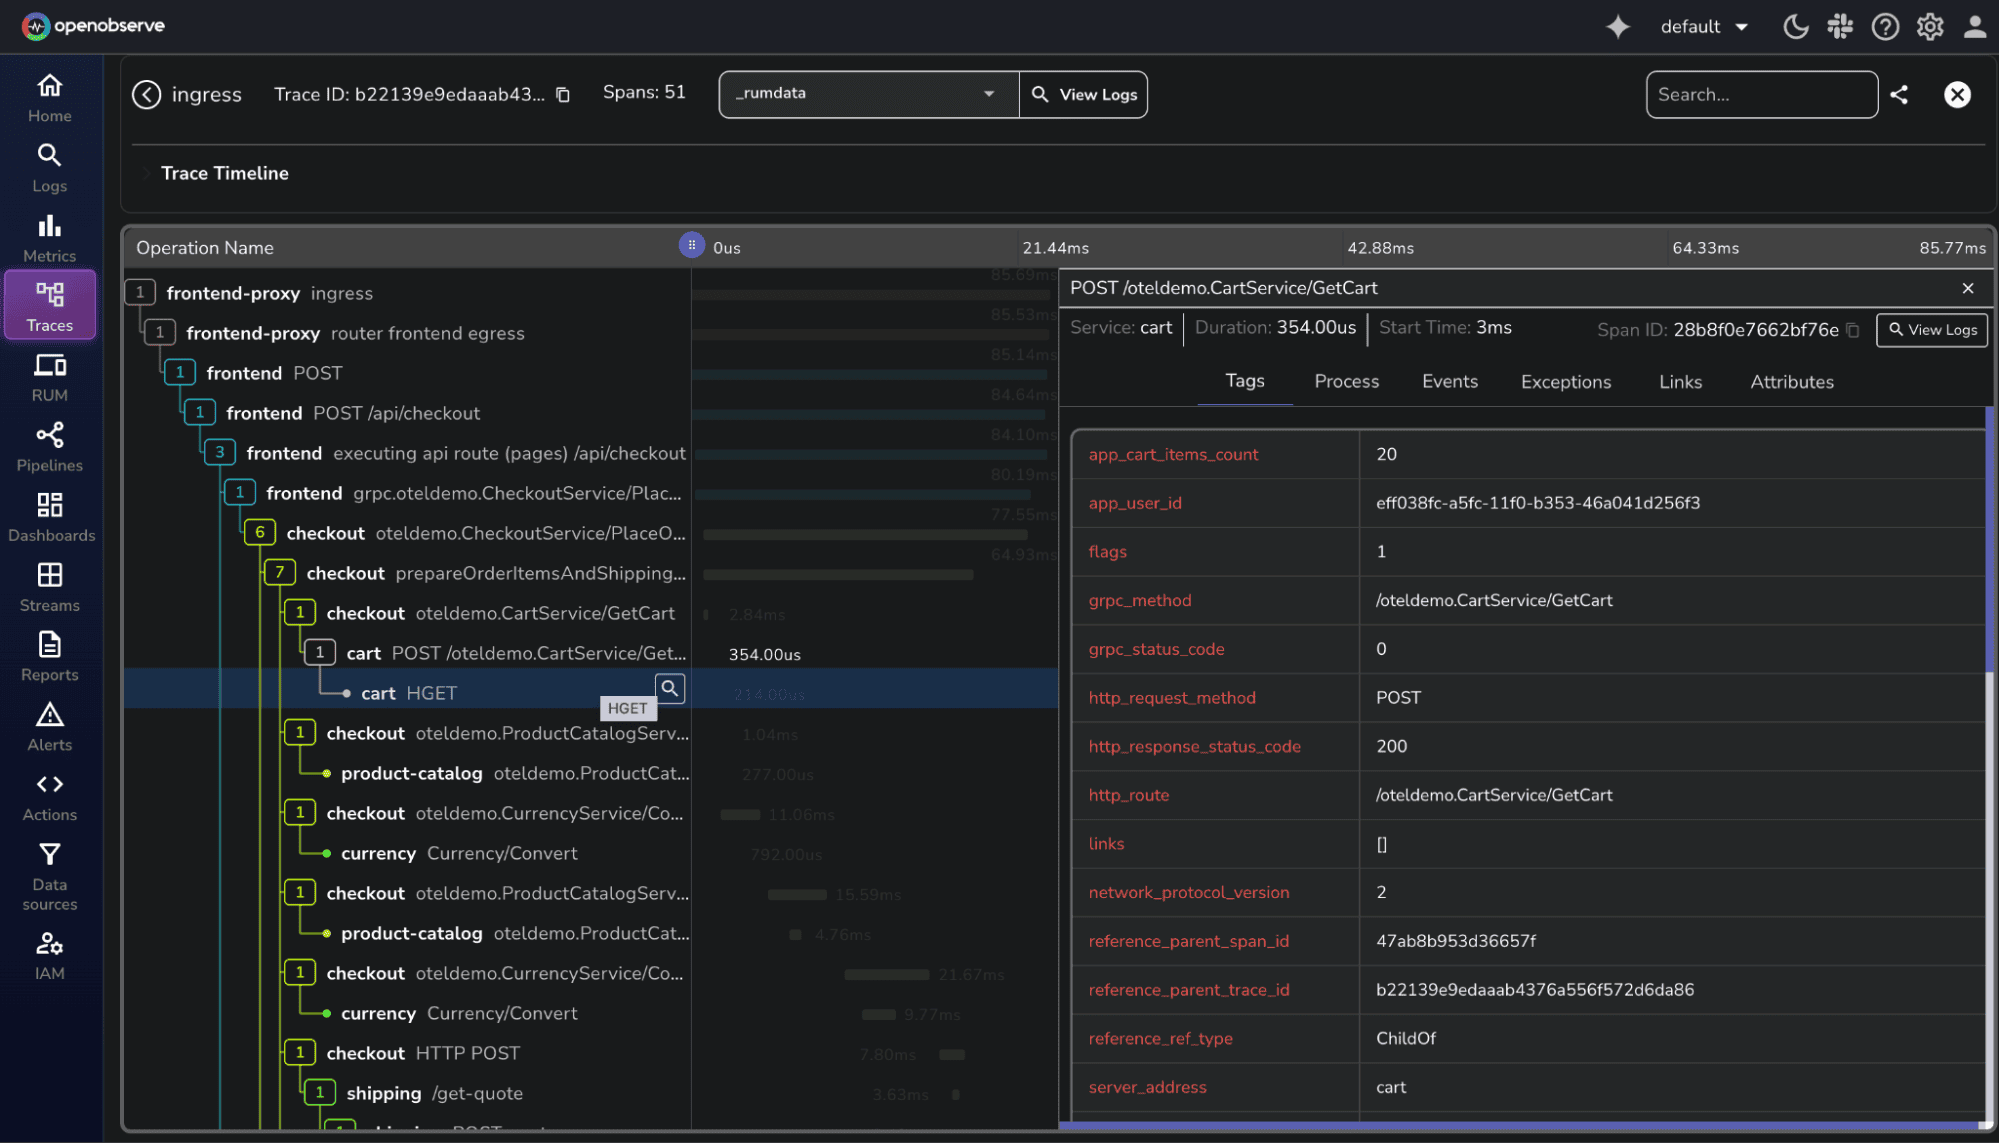
- Viewing attributes and learning more about the transaction: Inspect key attributes such as user IDs, service names, and request methods to get rich context about each transaction.
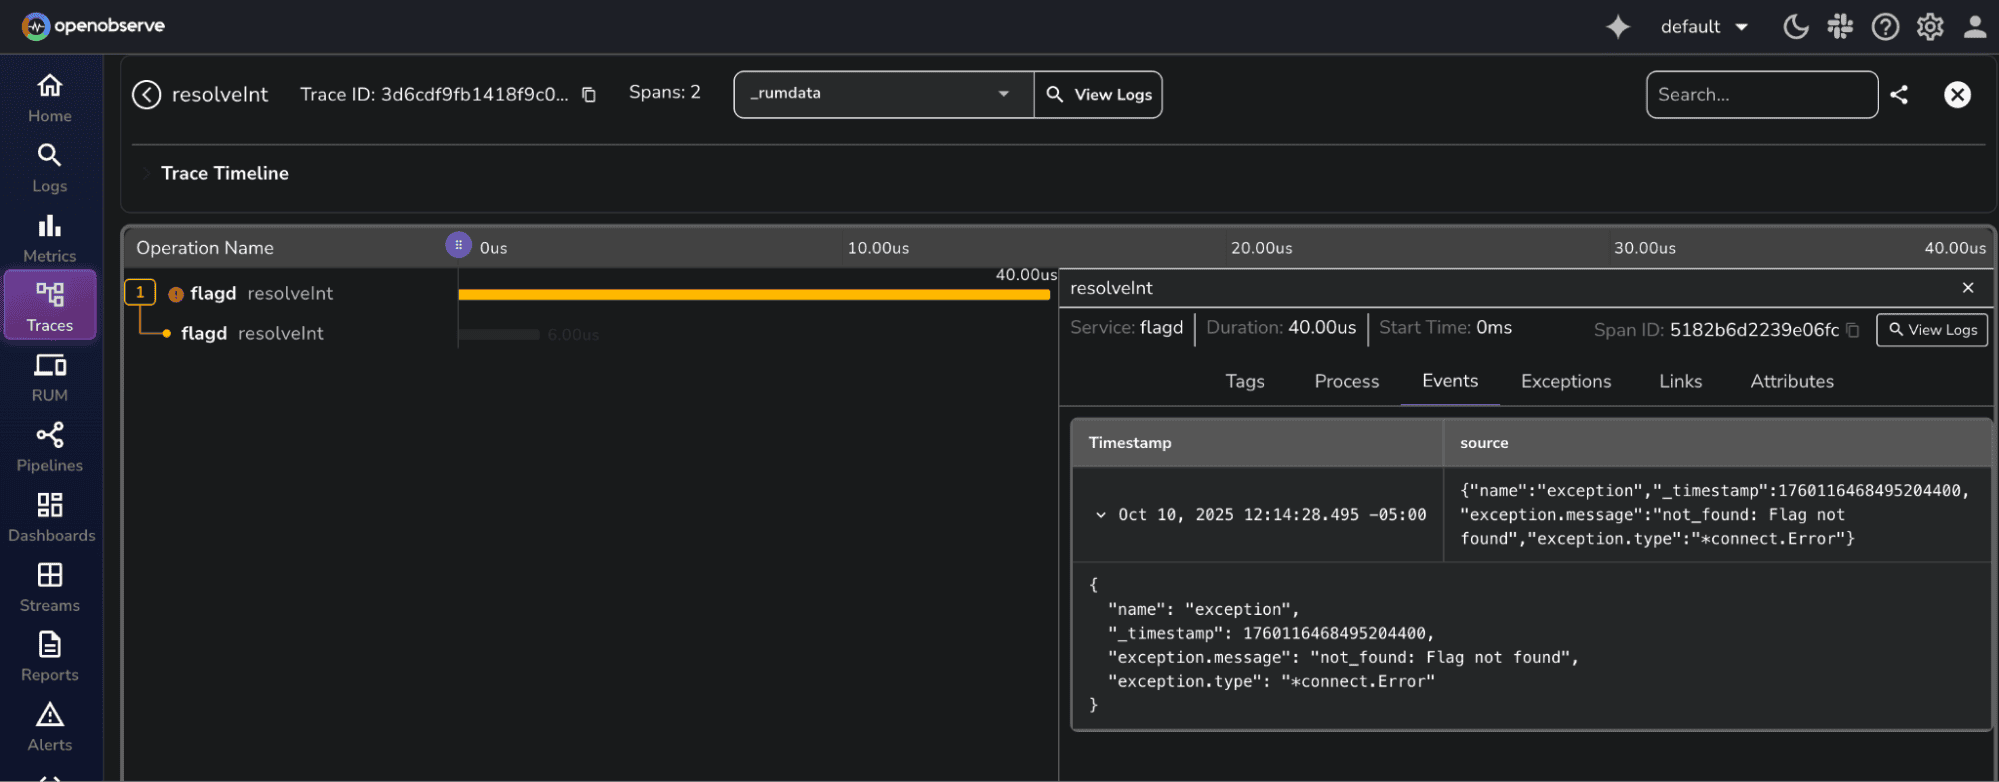
- Exploring events and exceptions: Dive into exception details and error events emitted by spans to pinpoint the root cause of failures.
- Correlate Traces with Logs: Pivot from a trace to its associated logs, providing a full picture of what happened during a transaction.

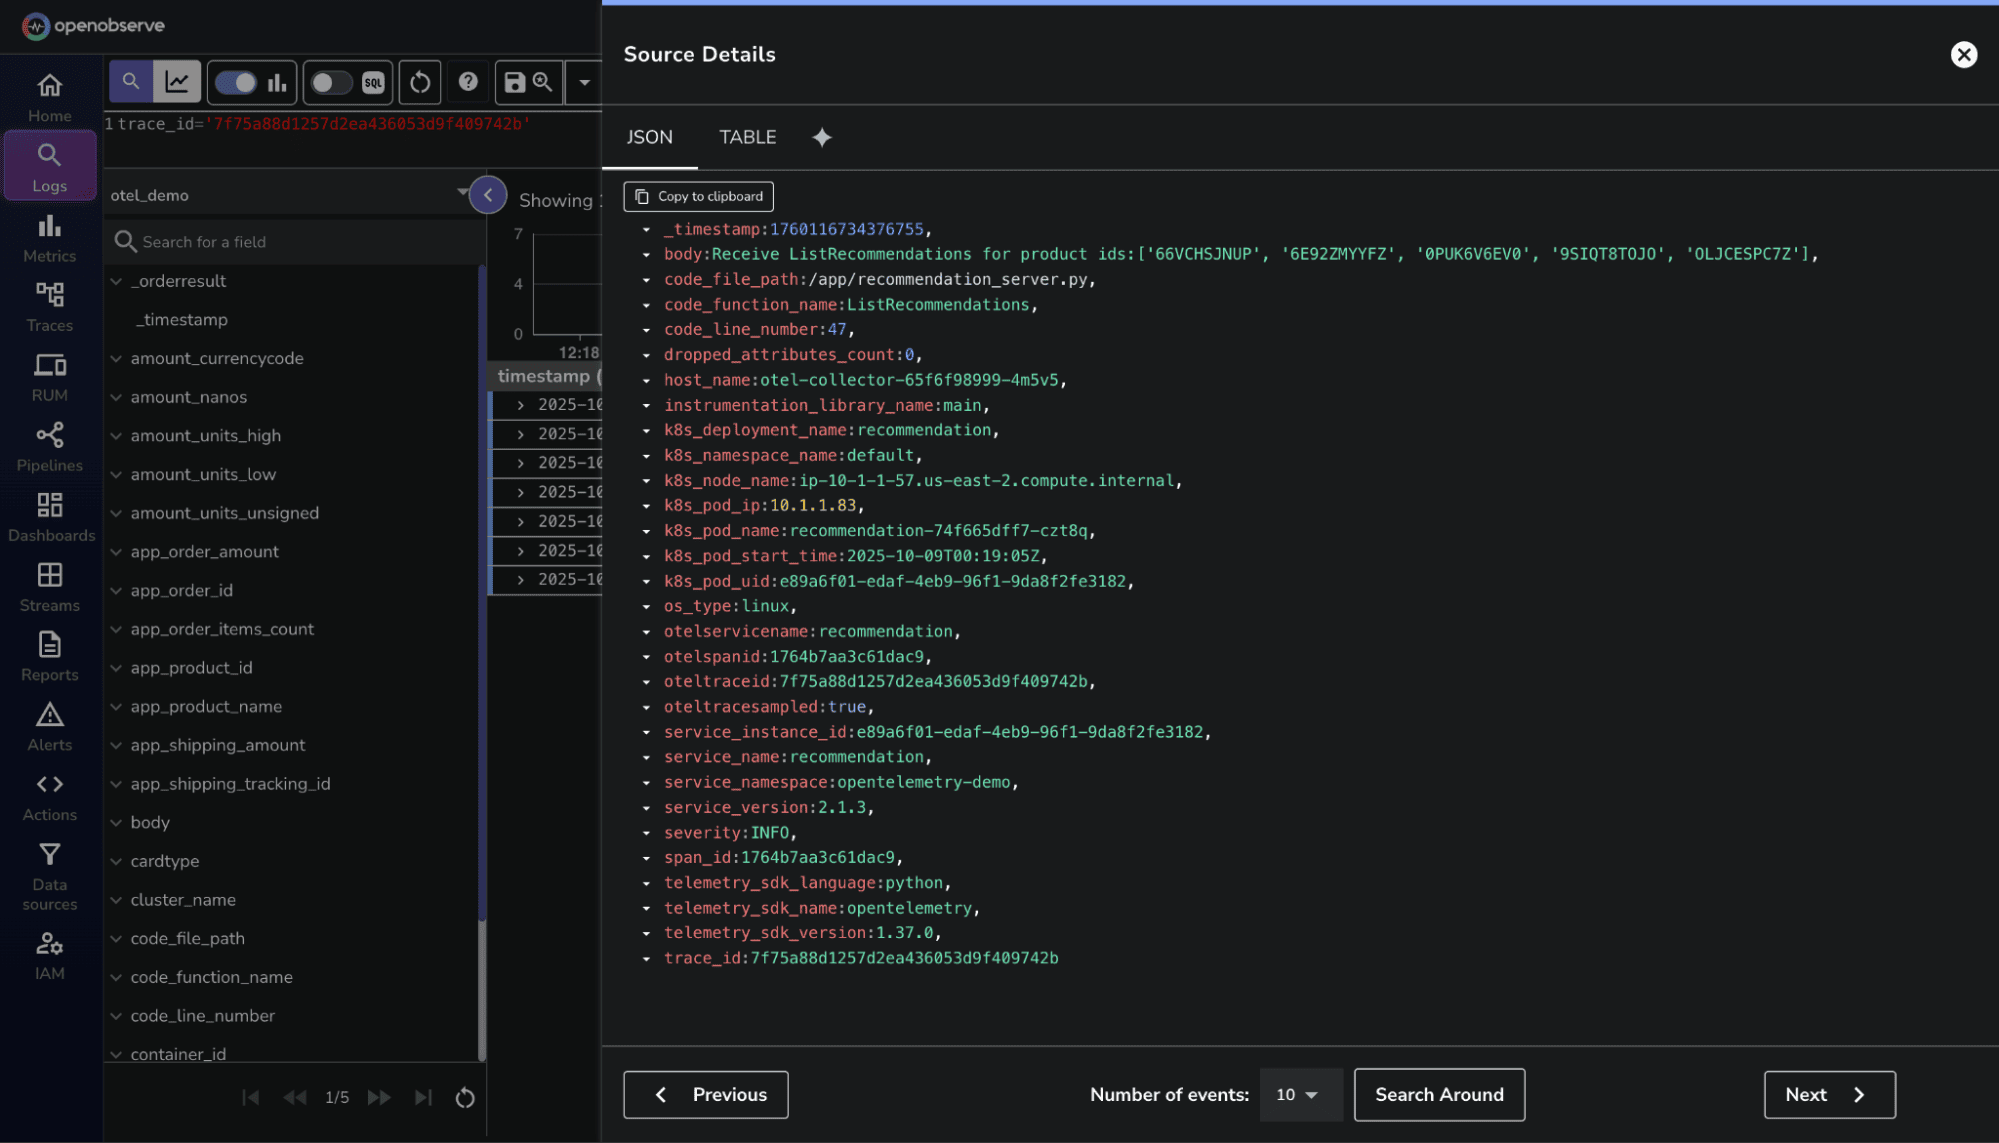
- Logs with selected TraceID: Filter logs by `TraceID` to view log entries that belong to the same transaction, perfect for debugging distributed requests.
## What's Next?
With your demo running, you can experiment with different observability scenarios, create custom [dashboards](https://openobserve.ai/docs/user-guide/analytics/dashboards/), set up [alerts](https://openobserve.ai/docs/user-guide/analytics/alerts/), and get hands-on experience with [distributed tracing](https://openobserve.ai/docs/features/distributed-tracing/). The Astronomy Shop generates realistic traffic patterns across multiple microservices, making it an excellent playground for learning OpenTelemetry and OpenObserve.
## Additional Resources
Learn more about [Openobserve and OpenTelemetry](https://openobserve.ai/opentelemetry/) and explore our other OTel blogs, including:
- [Simplifying Kubernetes Monitoring with OpenTelemetry and OpenObserve](https://openobserve.ai/blog/monitoring-kubernetes-with-opentelemetry/)
- [Implementing OpenTelemetry Logging in .NET Applications](https://openobserve.ai/blog/opentelemetry-logging-in-dotnet-applications/)
- [Distributed Tracing in Node.js Applications with OpenTelemetry](https://openobserve.ai/blog/distributed-tracing-in-nodejs-with-opentelemetry/)
Happy observing\!