# Sending Logs from Google Cloud Run to OpenObserve
> Send logs from Google Cloud Run to OpenObserve for fast search, longer retention, and lower costs, and using just a few lines of code.
Source: https://openobserve.ai/blog/sending-logs-from-google-cloud-run-to-openobserve/
Published: 2025-07-31
Authors: Simran Kumari, Chaitanya Sistla
Category: How To
Tags: GCP, Logging
---
## Sending Logs from Google Cloud Run to OpenObserve
**What You’ll Learn**
This instructional blog covers how to send structured logs from your Google Cloud Run app directly to OpenObserve using simple HTTP requests and with just a few lines of code. We'll cover:
- Why Cloud Logging falls short for scale, long-term retention, real-time filtering, and cost efficiency
- How to configure your app (Python or Node.js) to send logs to OpenObserve
- How to set required environment variables in Google Cloud Run
- How to test and troubleshoot the integration
When you deploy a service on **Google Cloud Run**, logs are automatically collected and sent to Cloud Logging. You can see stdout, errors, and request logs in the Logs Explorer.
However, while **Cloud Logging** works well for basic needs, as your observability requirements grow, it can become a bottleneck.
You may start to hit limitations when you try to:
- Query vast amounts of historical logs quickly without experiencing performance degradation
- Perform real-time transformations or redactions on your Cloud Run logs before they're stored
- Streamline the operational management of all your logs, metrics, and traces across a single platform
- Retain logs for extended periods without incurring high storage costs
This is where OpenObserve helps. It’s fast, simple to use, and much more cost-efficient, especially for larger volumes and longer retention. With OpenObserve, you can unify your logs, metrics, and traces, sending data directly from your app using an HTTP API.
## What You’ll Need
1. An OpenObserve account (self-hosted or ([cloud](https://cloud.openobserve.ai/web/))
2. Basic knowledge of your app’s code; Node.js and Python examples are included
## Step 1: Get Your OpenObserve Details
Login to your OpenObserve dashboard and collect the following:
1. **URL**: Your OpenObserve URL (like https://api.openobserve.ai)
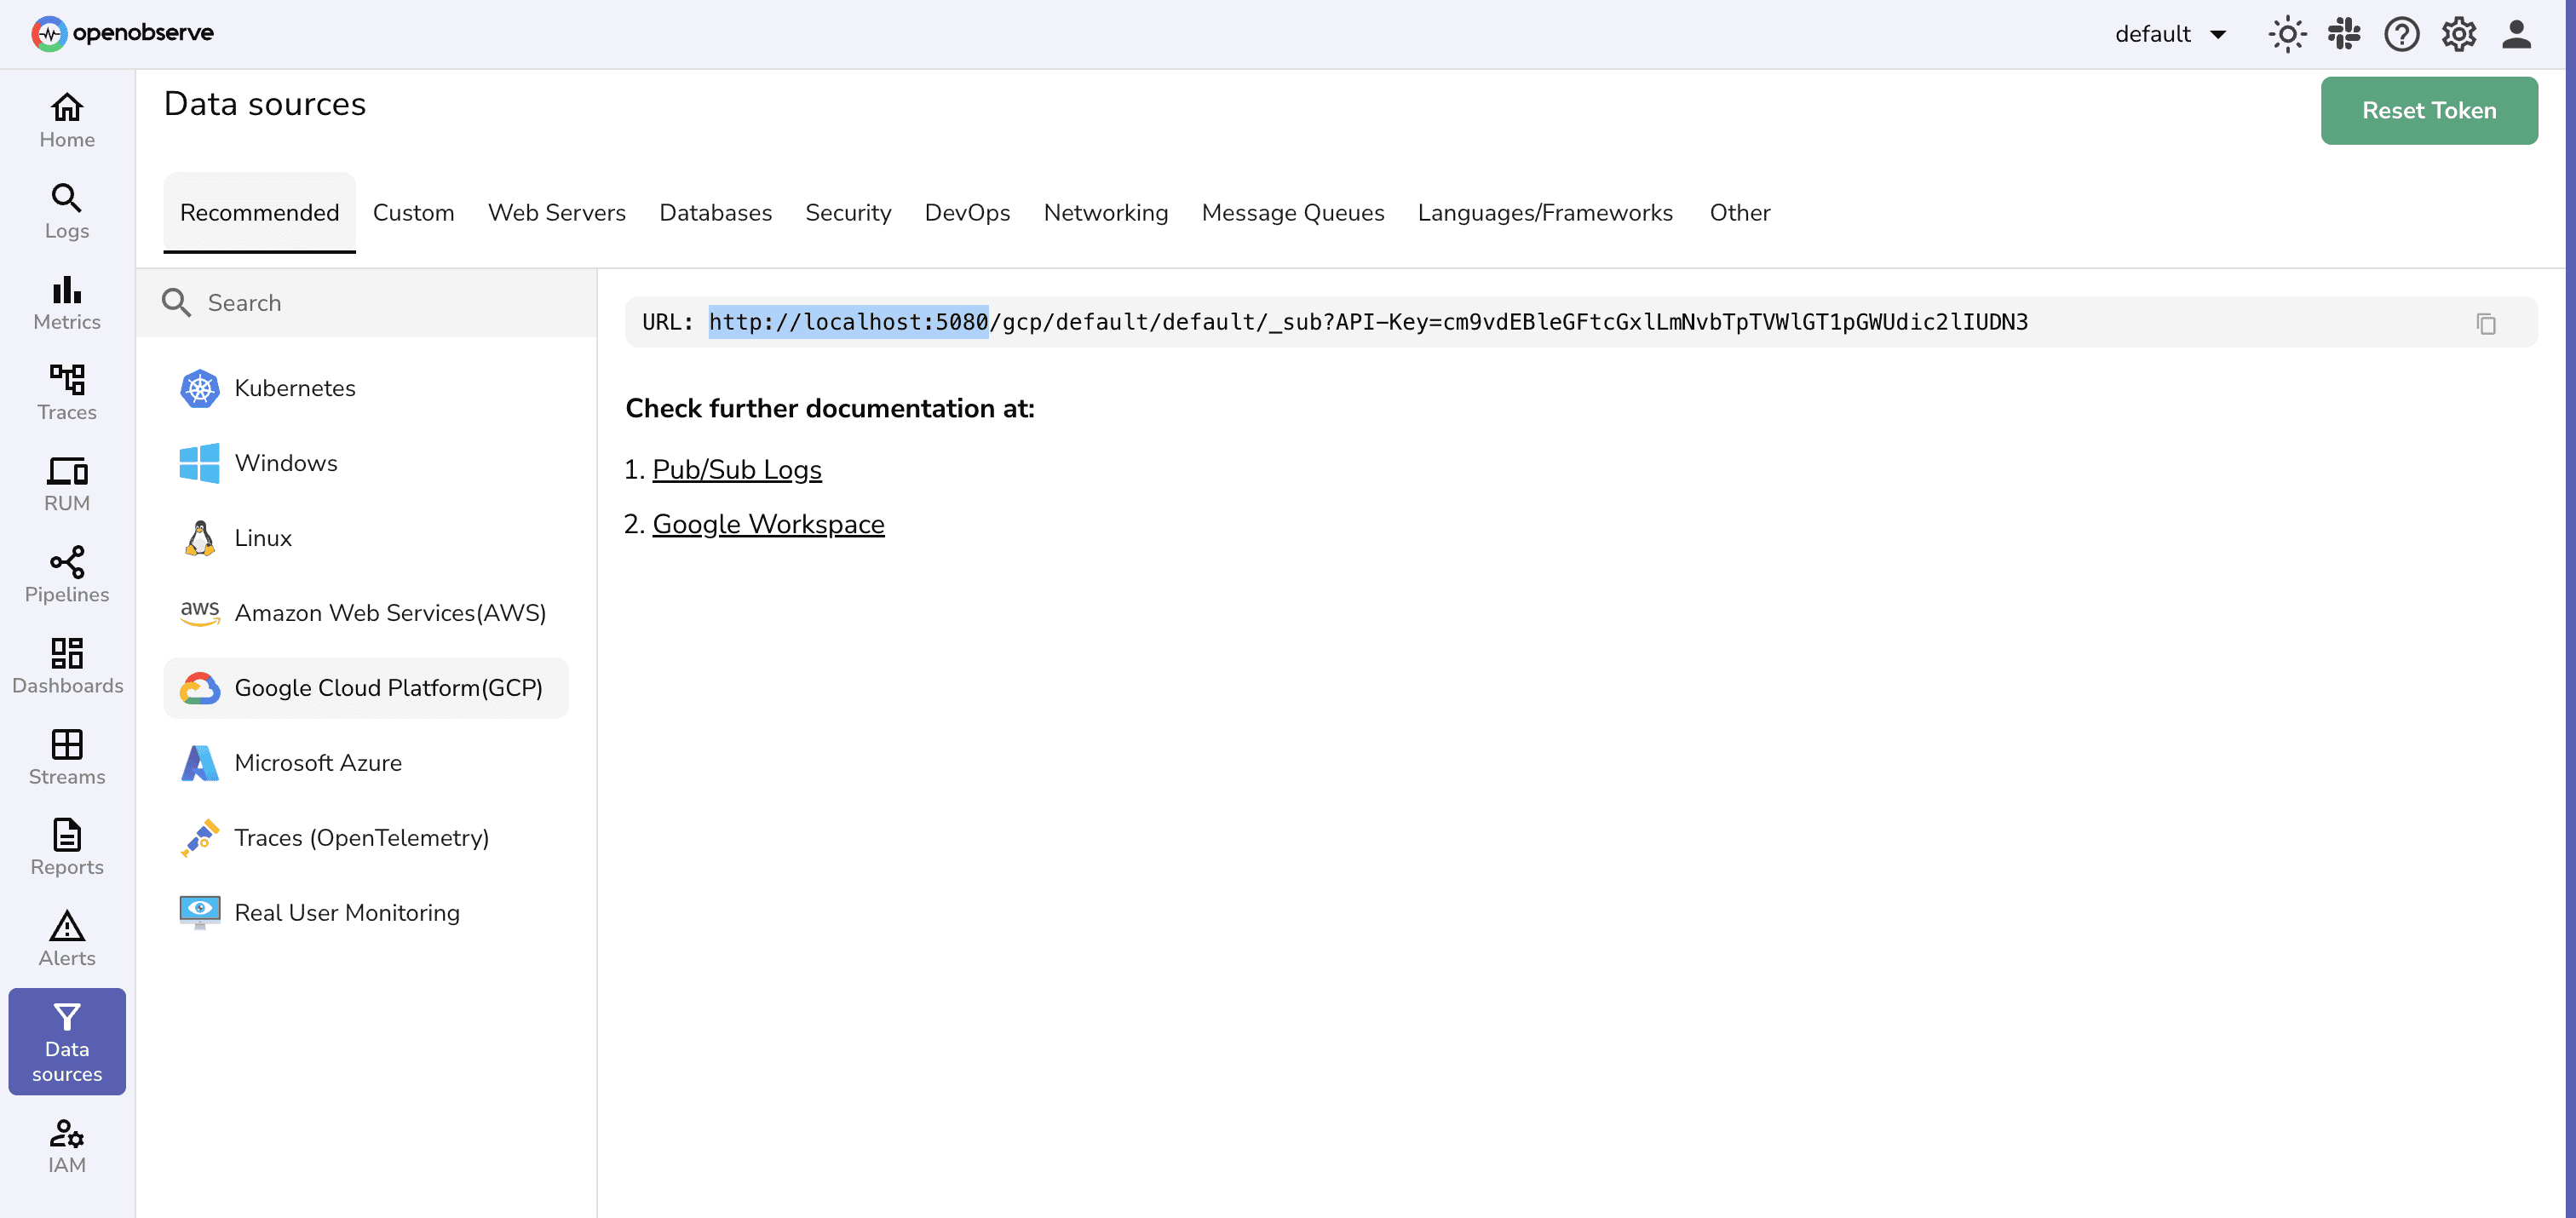
2. **Organization**: Your organization name.
Found in the top-right of your OpenObserve UI

3. **Authorization token**: Get your Authorization token from the **Data Sources** page:
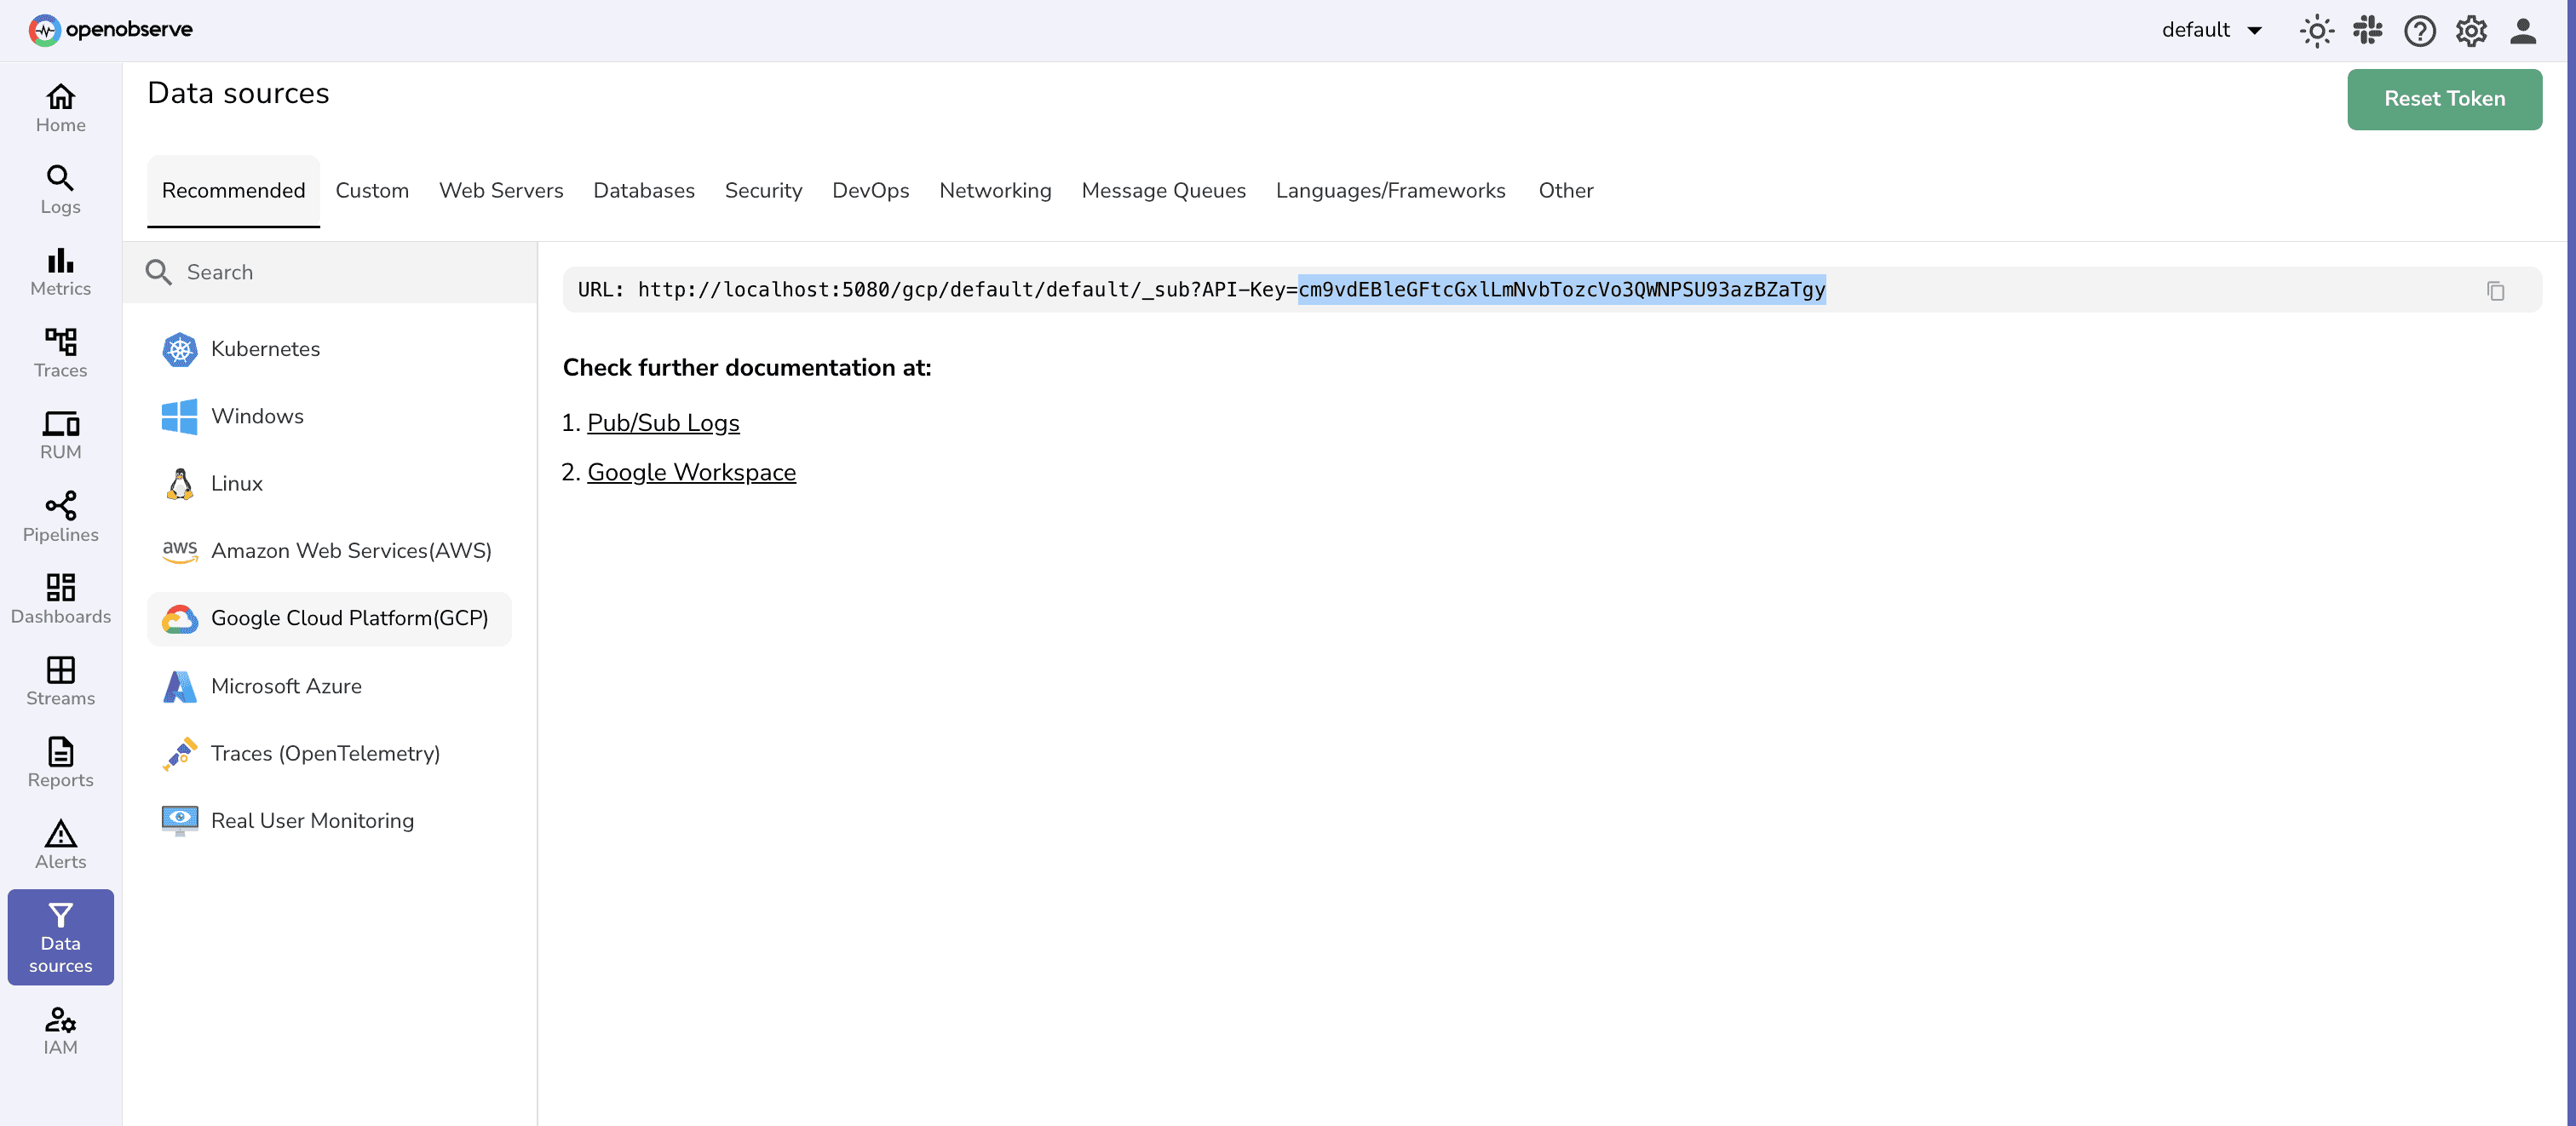
You’ll pass these to your app using environment variables in Cloud Run.
## Step 2: Add Logging Code to Your App
Modify your existing app by adding a small function to send logs via HTTP.
### For Python (Flask or FastAPI)
```
import requests
import json
import base64
import os
from datetime import datetime
def send_log(message):
try:
auth = os.environ['OPENOBSERVE_AUTH_KEY']
response = requests.post(
f"{os.environ['OPENOBSERVE_URL']}/api/{os.environ['OPENOBSERVE_ORG']}/{os.environ['OPENOBSERVE_STREAM']}/_json",
json=[{
"timestamp": datetime.now().isoformat(),
"message": message,
"level": "info"
}],
headers={
"Authorization": f"Basic {auth}",
"Content-Type": "application/json"
}
)
print(f"Log sent. Status: {response.status_code}, Response: {response.text}",flush=True)
except Exception as e:
print(f"OpenObserve error: {e}")
```
You can call this logging function from any route in your app, for example:
```
@app.route('/')
def hello():
send_log('Homepage visited')
return 'Hello World'
```
### For Node.js (Express)
```
const axios = require('axios');
async function sendLog(message) {
try {
await axios.post(
`${process.env.OPENOBSERVE_URL}/api/${process.env.OPENOBSERVE_ORG}/${process.env.OPENOBSERVE_STREAM}/_json`,
[{
timestamp: new Date().toISOString(),
message: message,
level: 'info'
}],
{
headers: {
'Authorization': `Basic ${process.env.OPENOBSERVE_AUTH_KEY}`,
'Content-Type': 'application/json'
}
}
);
} catch (error) {
console.error('OpenObserve error:', error.message);
}
}
```
Use it inside your route:
```
app.get('/', (req, res) => {
sendLog('Homepage visited');
res.send('Hello World');
});
```
## Want to Try It Without Modifying Your App?
If you’d prefer to test the integration before changing your own application, you can use this sample project: cloudrun-openobserve-demo (GitHub)
It contains a minimal Cloud Run-compatible app with the logging code already set up. Just deploy it and provide the required environment variables (covered in _Step 3_) during setup.
## Step 3: Set Environment Variables in Cloud Run
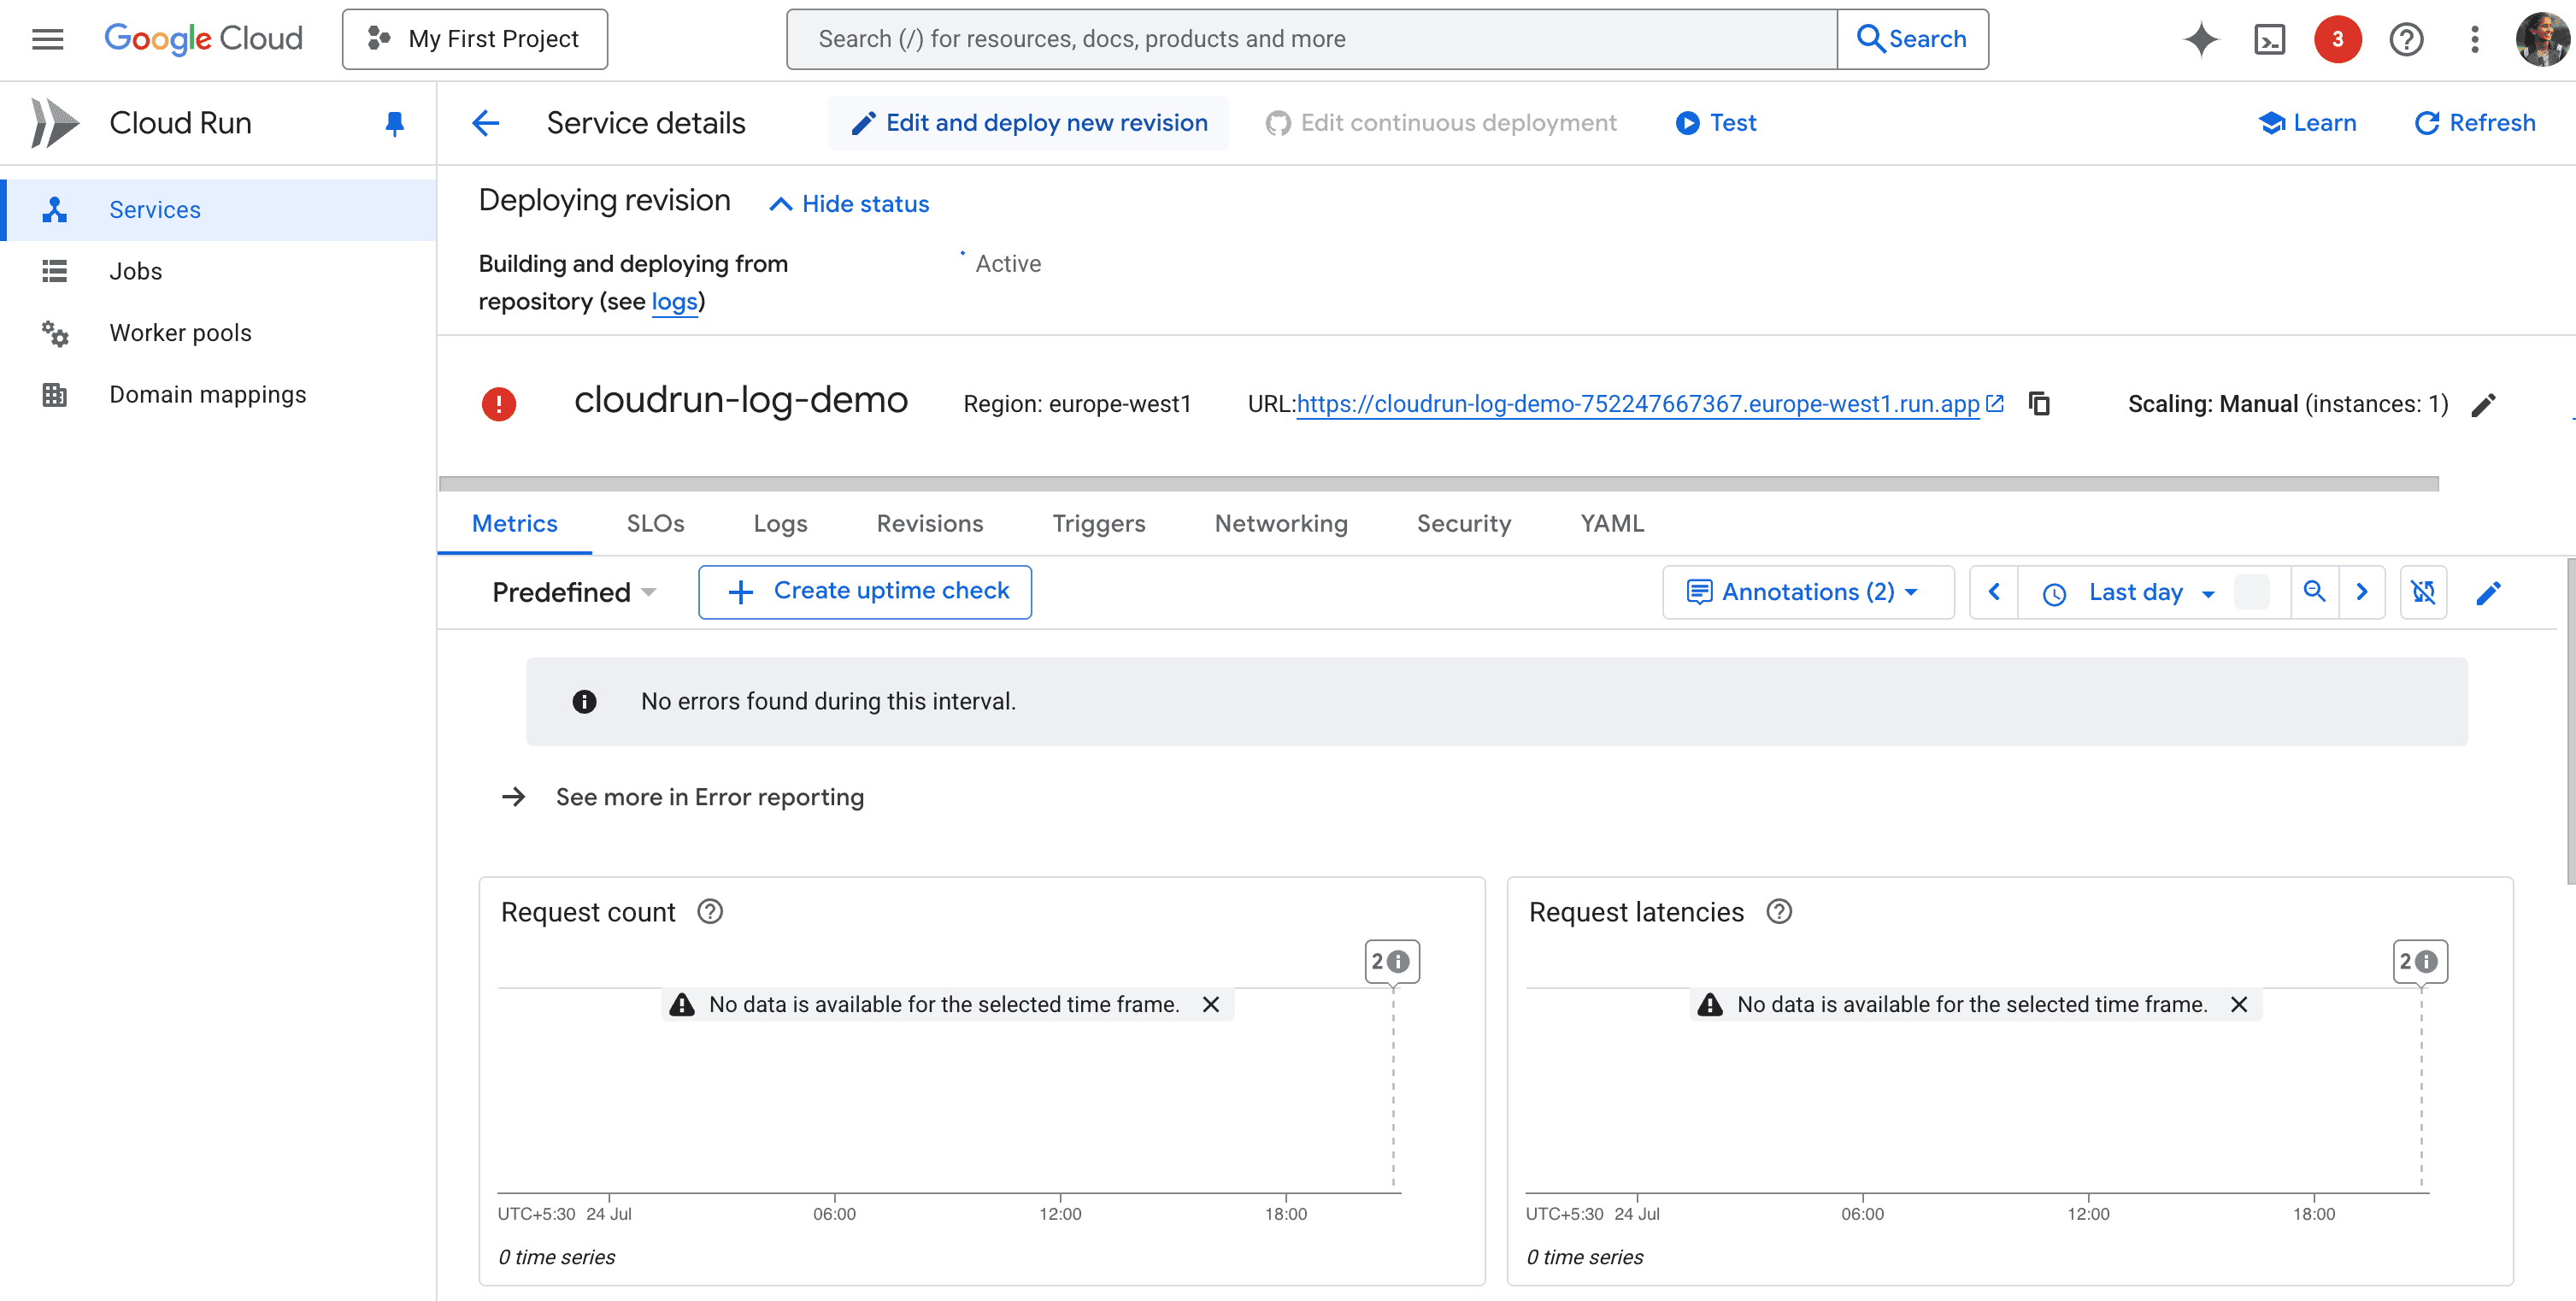
1. Go to the Cloud Run Console
2. Click your service name
3. Click “**Edit & Deploy New Revision**”
Scroll to “**Variables & Secrets**” → **Environment Variables**
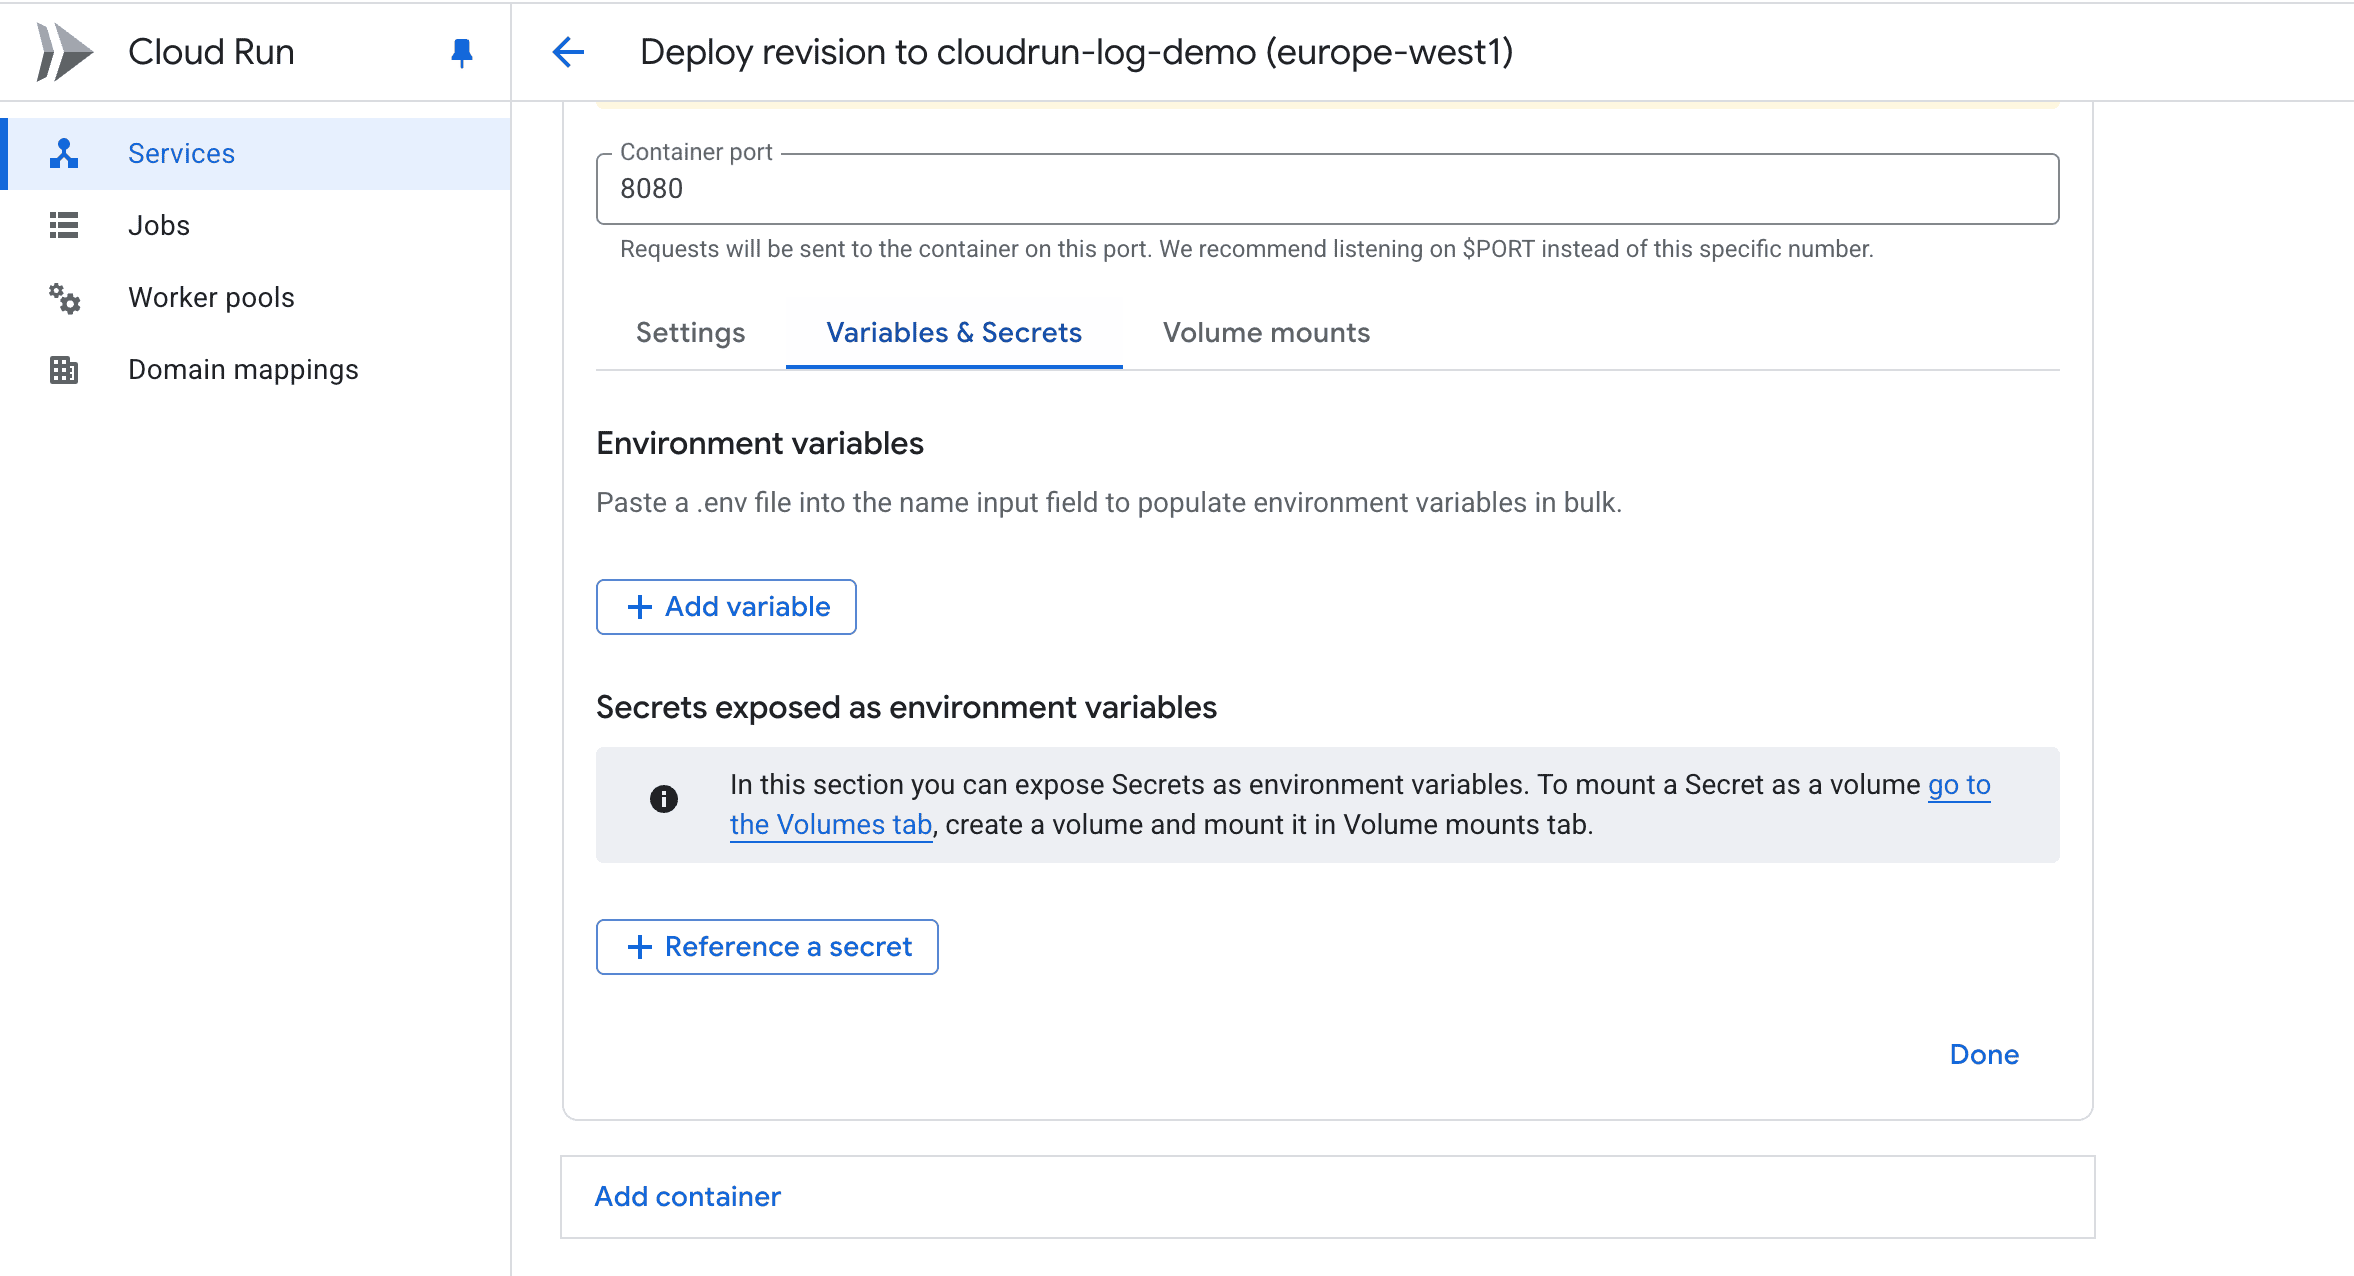
4. Add the following 4 variables:
5. Click **Deploy** to roll out the changes.
## Step 4: Test It
- Visit your app's public URL
- You should see a normal response, like `Hello World`, in your browser.
- Go to OpenObserve → your stream → you should see a log entry like:
```
{
"timestamp": "2025-07-24T14:00:00Z",
"message": "Homepage visited",
"level": "info"
}
```
Logs may take a few seconds to appear in OpenObserve. If you don’t see them, double-check your stream name and org.
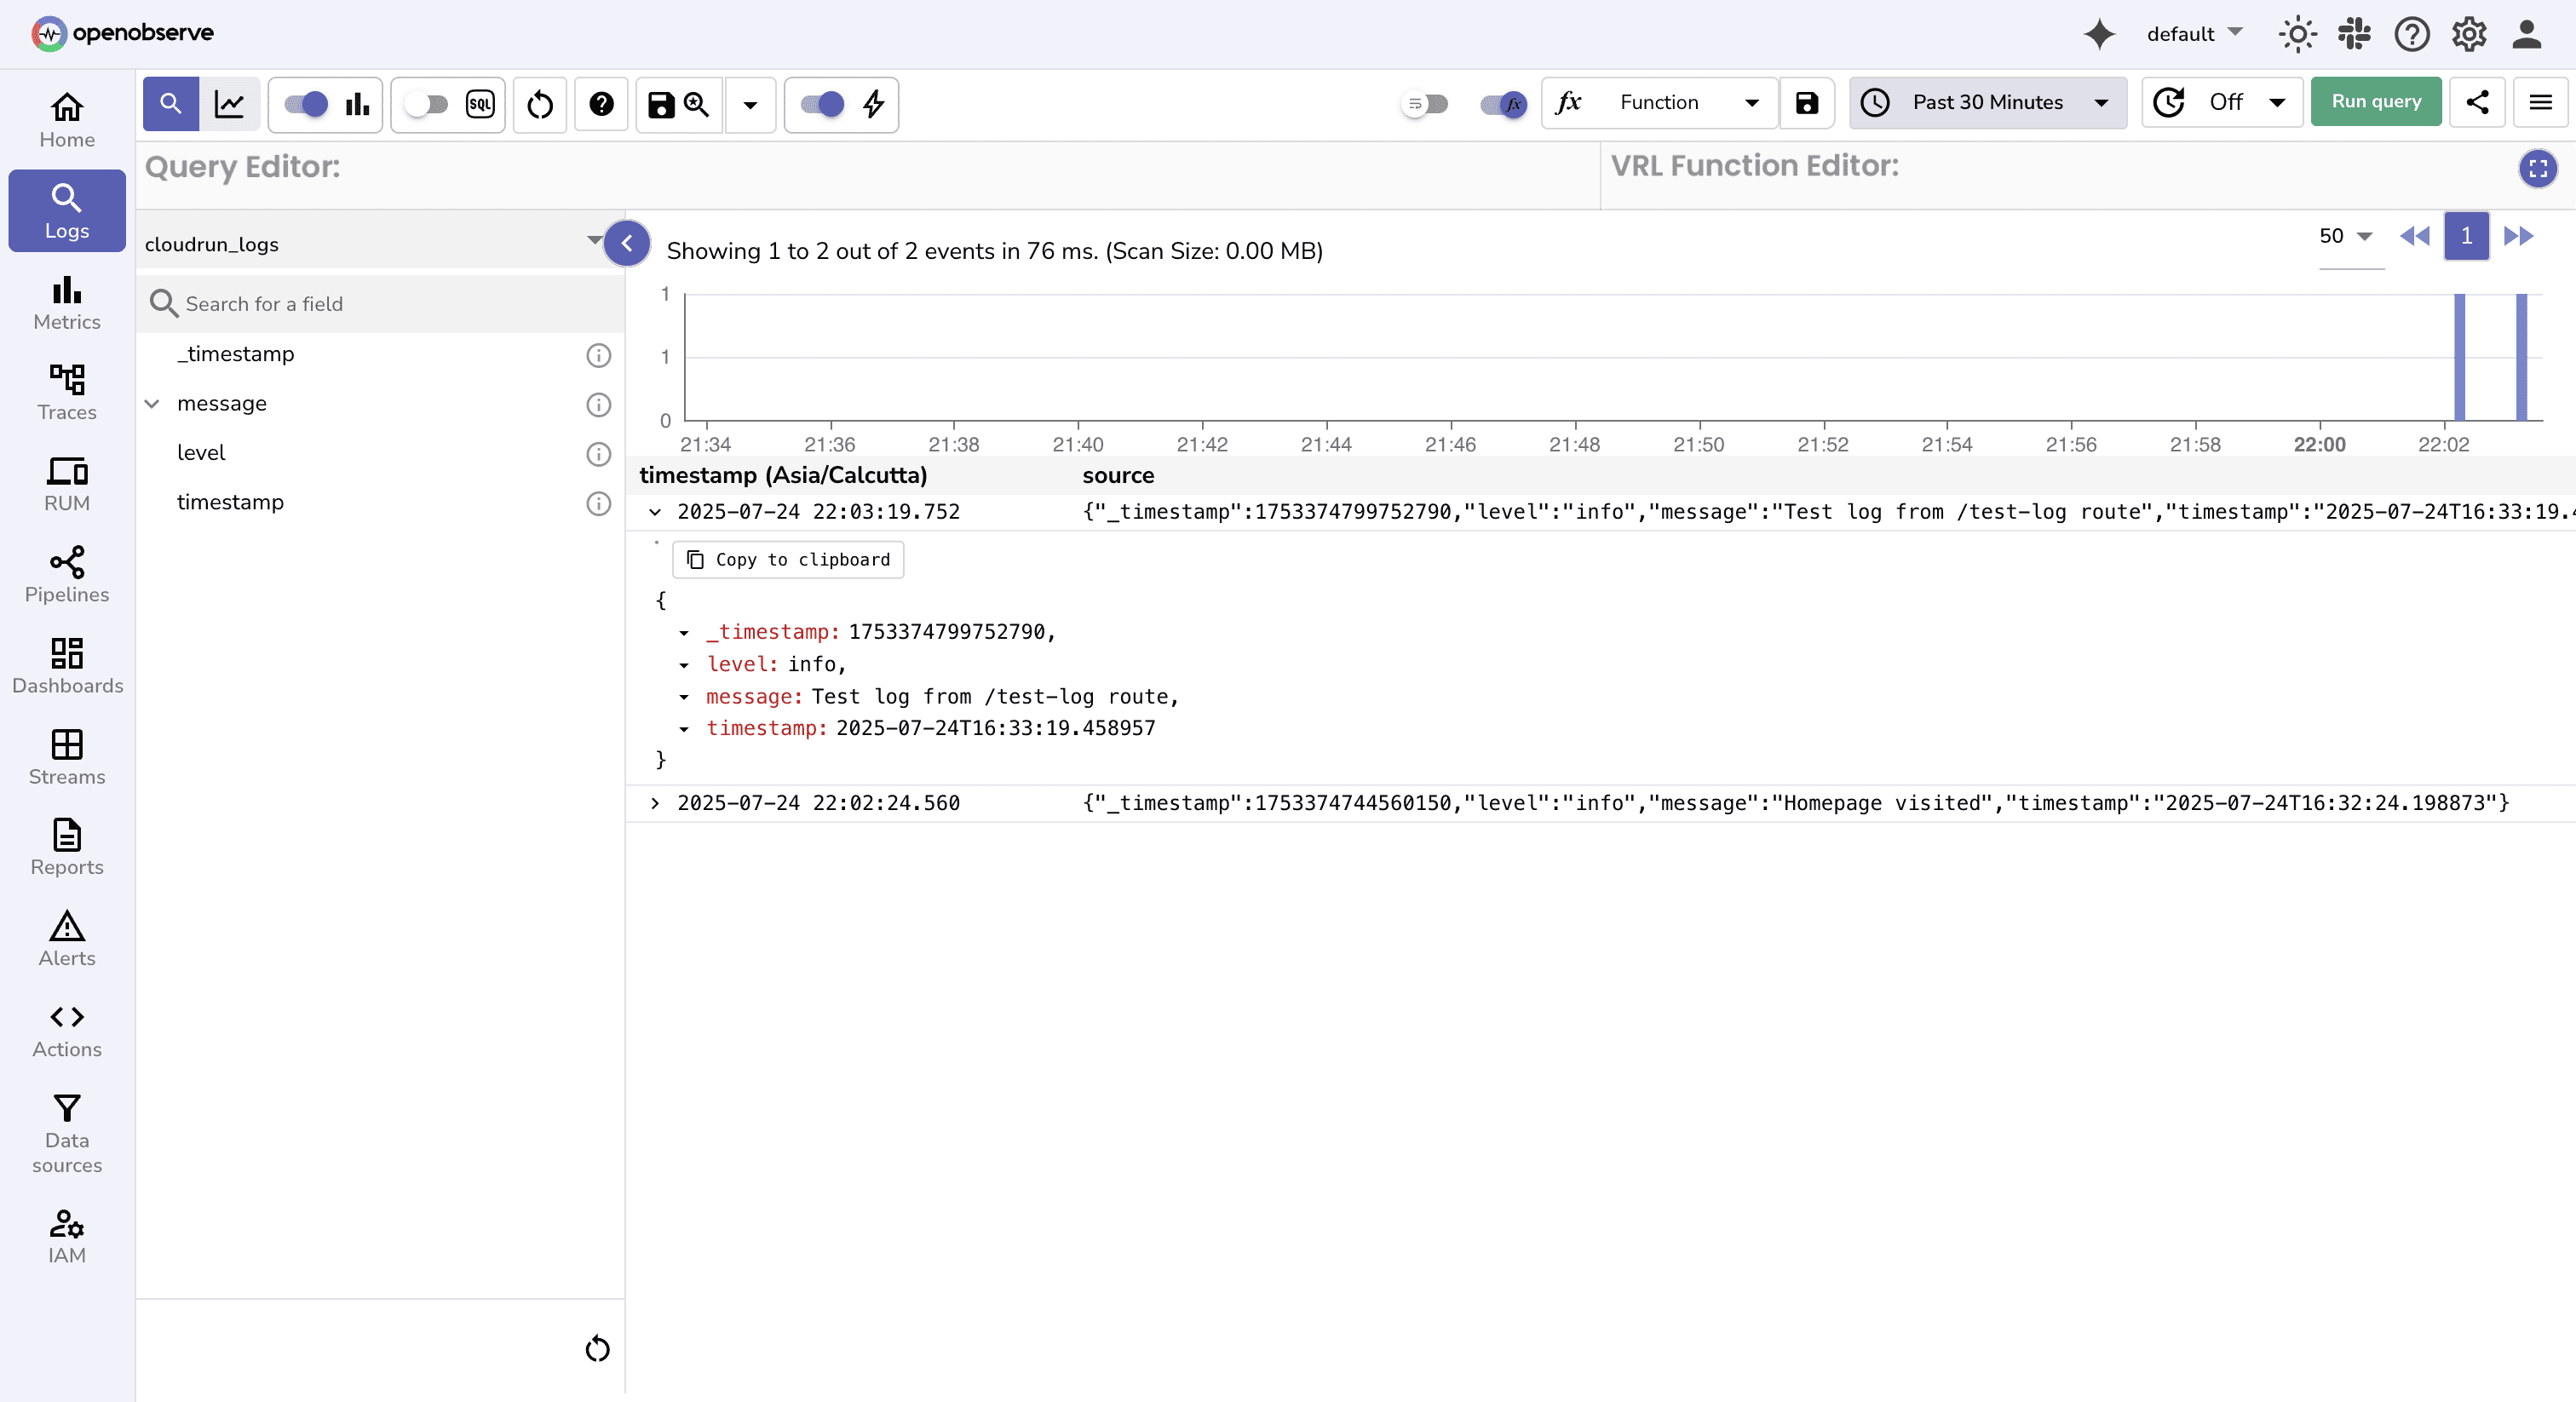
That’s it! Your Cloud Run app now streams structured logs directly to OpenObserve , giving you richer filtering, and better cost control.
## Troubleshooting Common Issues
**Logs not appearing in OpenObserve?**
Here are a few things to check:
- **Stream or Organization Name Typos**
Double-check that the values for OPENOBSERVE_STREAM and OPENOBSERVE_ORG exactly match what’s configured in OpenObserve.
- **Cloud Run Logs Show 404 or 401**
A 404 typically means the stream path is incorrect.
A 401 usually means the API key or auth format is invalid.
- **No Response from Log Sender Function**
Add flush=True in the print() calls to ensure logs appear in Cloud Run’s stdout logs:
```
print(f"Log sent. Status: {response.status_code}", flush=True)
```
- **Try with cURL First**
Before debugging the app, test OpenObserve ingestion with a simple cURL request:
```
curl -X POST \
-H "Authorization: Basic YOUR_AUTH_KEY" \
-H "Content-Type: application/json" \
-d '[{"message": "test log"}]' \
https://YOUR_OPENOBSERVE_URL/api/YOUR_ORG/YOUR_STREAM/_json
```
## Conclusion
By streaming logs directly to OpenObserve, you're no longer limited by Cloud Logging’s cost or search performance. This setup supports:
- Fast search across high-volume and historical logs
- Structured logging and alerting
- Longer retention at significantly lower cost
- The ability to unify logs, metrics, and traces in one system
## Next Steps
- [Search and filter logs](https://openobserve.ai/docs/user-guide/data-exploration/logs/logs/#get-started-with-logs) in OpenObserve
- Add structured fields like user_id, status_code, or latency
- Set up [alerts](https://openobserve.ai/docs/user-guide/analytics/alerts/) and [dashboards](https://openobserve.ai/docs/user-guide/analytics/dashboards/dashboards-in-openobserve/) from logs
- Set up [real-time pipelines](https://openobserve.ai/docs/user-guide/data-processing/pipelines/pipelines/#real-time-pipelines) in OpenObserve to enrich logs
## Looking to Centralize Logs Across GCP?
While this guide shows how to send logs directly from a Cloud Run service using simple HTTP calls, there’s another approach worth exploring, especially if you want to forward logs from multiple GCP services like GKE, Cloud Functions, or even Cloud Load Balancers.
You can use Google Cloud’s native logging pipeline (Cloud Logging → Pub/Sub) to stream logs into OpenObserve without modifying your app code.
→ Check out our guide on [forwarding GCP logs to OpenObserve via Pub/Sub](https://openobserve.ai/blog/send-gcp-logs-to-openobserve/)
## Ready to Get More from Your Logs?
- Get an [OpenObserve Demo](https://openobserve.ai/demo/)