# SLO-Based Alerting in OpenObserve
> Master SLO-based alerting in OpenObserve. Easily set reliability targets, track error budgets, and cut alert noise with SQL-driven monitoring.
Source: https://openobserve.ai/blog/slo-based-alerting/
Published: 2025-08-20
Authors: Simran Kumari
Category: How To
Tags: Alerts, Dashboards, Tracing
---
## SLO-Based Alerting in OpenObserve
For SREs and Developers, What You’ll Learn:
1. What Service Level Objectives (SLOs) are: measurable reliability target
2. How to define and select meaningful SLOs using SLIs and error budgets
3. How alerts based on SLOs reduce noise and improve relevance
4. How to create and automate burn rate alerts in OpenObserve using SQL
5. Practical SQL examples for error rates, latency, and request throughput
## Introduction
Monitoring tools often throw hundreds of alerts like high CPU, slow responses, disk usage. But most of these don’t answer the real question: **“Is the user experience impacted?”**
That’s what **Service Level Objectives (SLOs)** are for.
SLOs let you focus on **reliability goals** tied to real user expectations, not just infrastructure signals. Instead of reacting to everything that _could_ go wrong, you set targets for what _must_ go right, based on your business and real user expectations.
## SLO Basics: From Services to Reliability Targets
A **service** is anything your users rely on, like your website, login system, billing API, or background jobs. Each one is expected to function reliably.
To measure how reliably a service performs, we use **Service Level Indicators (SLIs)**. These are metrics like:
- Success rate (e.g., % of 2xx responses)
- Error rate (e.g., % of 5xx)
- Latency (e.g., 95th percentile response time)
- Availability (e.g., uptime %)
A **SLO** is a target you set for an SLI over a time window. For example, "99.9% of requests should succeed over 7 days."
SLOs are **reliability targets** that guide operational focus. Instead of chasing infrastructure metrics like CPU or memory usage, SLOs help you focus on what _matters_: whether the service is _available_, _responsive_, and _not throwing errors_.
For example, your database service might show high CPU usage. That alone doesn’t matter to the service owner unless users are seeing slow queries or failed transactions. SLOs let you ignore noisy alerts and focus only when actual user impact is at risk.
**Understanding Error Budgets**
Every SLO implies an **error budget** i.e. the small, acceptable margin for failure. Example: If your SLO is 99.9%, you have an error budget of 0.1% failures in a given time window.
This error budget isn’t just for alerts. It’s a decision-making tool:
- Can we release this new feature? \
→ If we’re within budget, we might accept some risk.
- Should we pause feature work and invest in reliability? \
→ If we’re burning the error budget too quickly, yes.
- Is this operational risk acceptable right now? \
→ Depends on how much of the budget is left and how fast we’re consuming it.
You alert **not because the SLO is breached**, but when you’re **burning through the error budget too fast**.
_Note_: A SLO is _not_ an alert by itself,it’s a long-term reliability target. Alerts are derived from how fast or how often you're deviating from that SLO.
Let’s see how SLOs play out with a real-world example.
## SLO Workflow in OpenObserve: Demo
### Prerequisites
Before we dive into the demo, make sure you have the following set up:
- **A running OpenObserve instance:** Either [self-hosted](https://openobserve.ai/docs/getting-started/#option-2-self-hosted-installation) or an [OpenObserve Cloud](https://cloud.openobserve.ai/) account.
- **At least one [alert destination](https://openobserve.ai/docs/user-guide/account-administration/management/alert-destinations/) configured:** You'll need this to receive alerts (e.g., Slack, email, webhook).
- **Alert templating enabled** (recommended) \
This allows you to use dynamic values in alert messages. \
→[ Templating Reference](https://openobserve.ai/docs/user-guide/account-administration/management/templates/)
**The scenario**: Your users are complaining about slow login experiences. Let's build a complete SLO monitoring system in OpenObserve that tracks, alerts, and helps debug latency issues.
We'll walk through the entire workflow:
Define SLO → Build Dashboard → Create Alerts → Debug Issues when at risk.
**Where to Define SLOs in OpenObserve?**
OpenObserve doesn’t have a built-in SLO object. You define an SLO by writing a SQL query that evaluates whether your service is meeting the target. You can then:
- Add the query result to a dashboard to track trends
- Set up a scheduled alert to trigger when the condition fails
In short, the SLO lives in the query and the alert logic you create , giving you full control over how it's defined and enforced.
## **Step 1: Setting Your Latency SLO**
**Business Context**: Users expect login to feel responsive. Research shows anything above 500ms feels sluggish.
**Sample trace data** (already flowing into OpenObserve):
**Note:** OpenTelemetry collects traces in a nested JSON structure (e.g., `resource.attributes`, `scopeSpans.spans`). OpenObserve automatically flattens these fields during ingestion for easier querying. The flattening depth is controlled by the environment variable `ZO_FLATTEN_LEVEL` (default: `3`). That’s why in the example below you see simple keys like `service_name` instead of deeply nested.
```
{
"trace_id": "abc123abc123abc123abc123abc123ab",
"span_id": "def456def456def4",
"operation_name": "POST /login",
"start_time": 1754664691403452700,
"end_time": 1754664691409971500,
"duration": 518600,
"http_method": "POST",
"http_status_code": 200,
"http_url": "http://authservice.local/login",
"service_name": "auth-service",
"span_kind": 3,
"span_status":"UNSET",
"status_code":0,
"status_message":"",
}
```
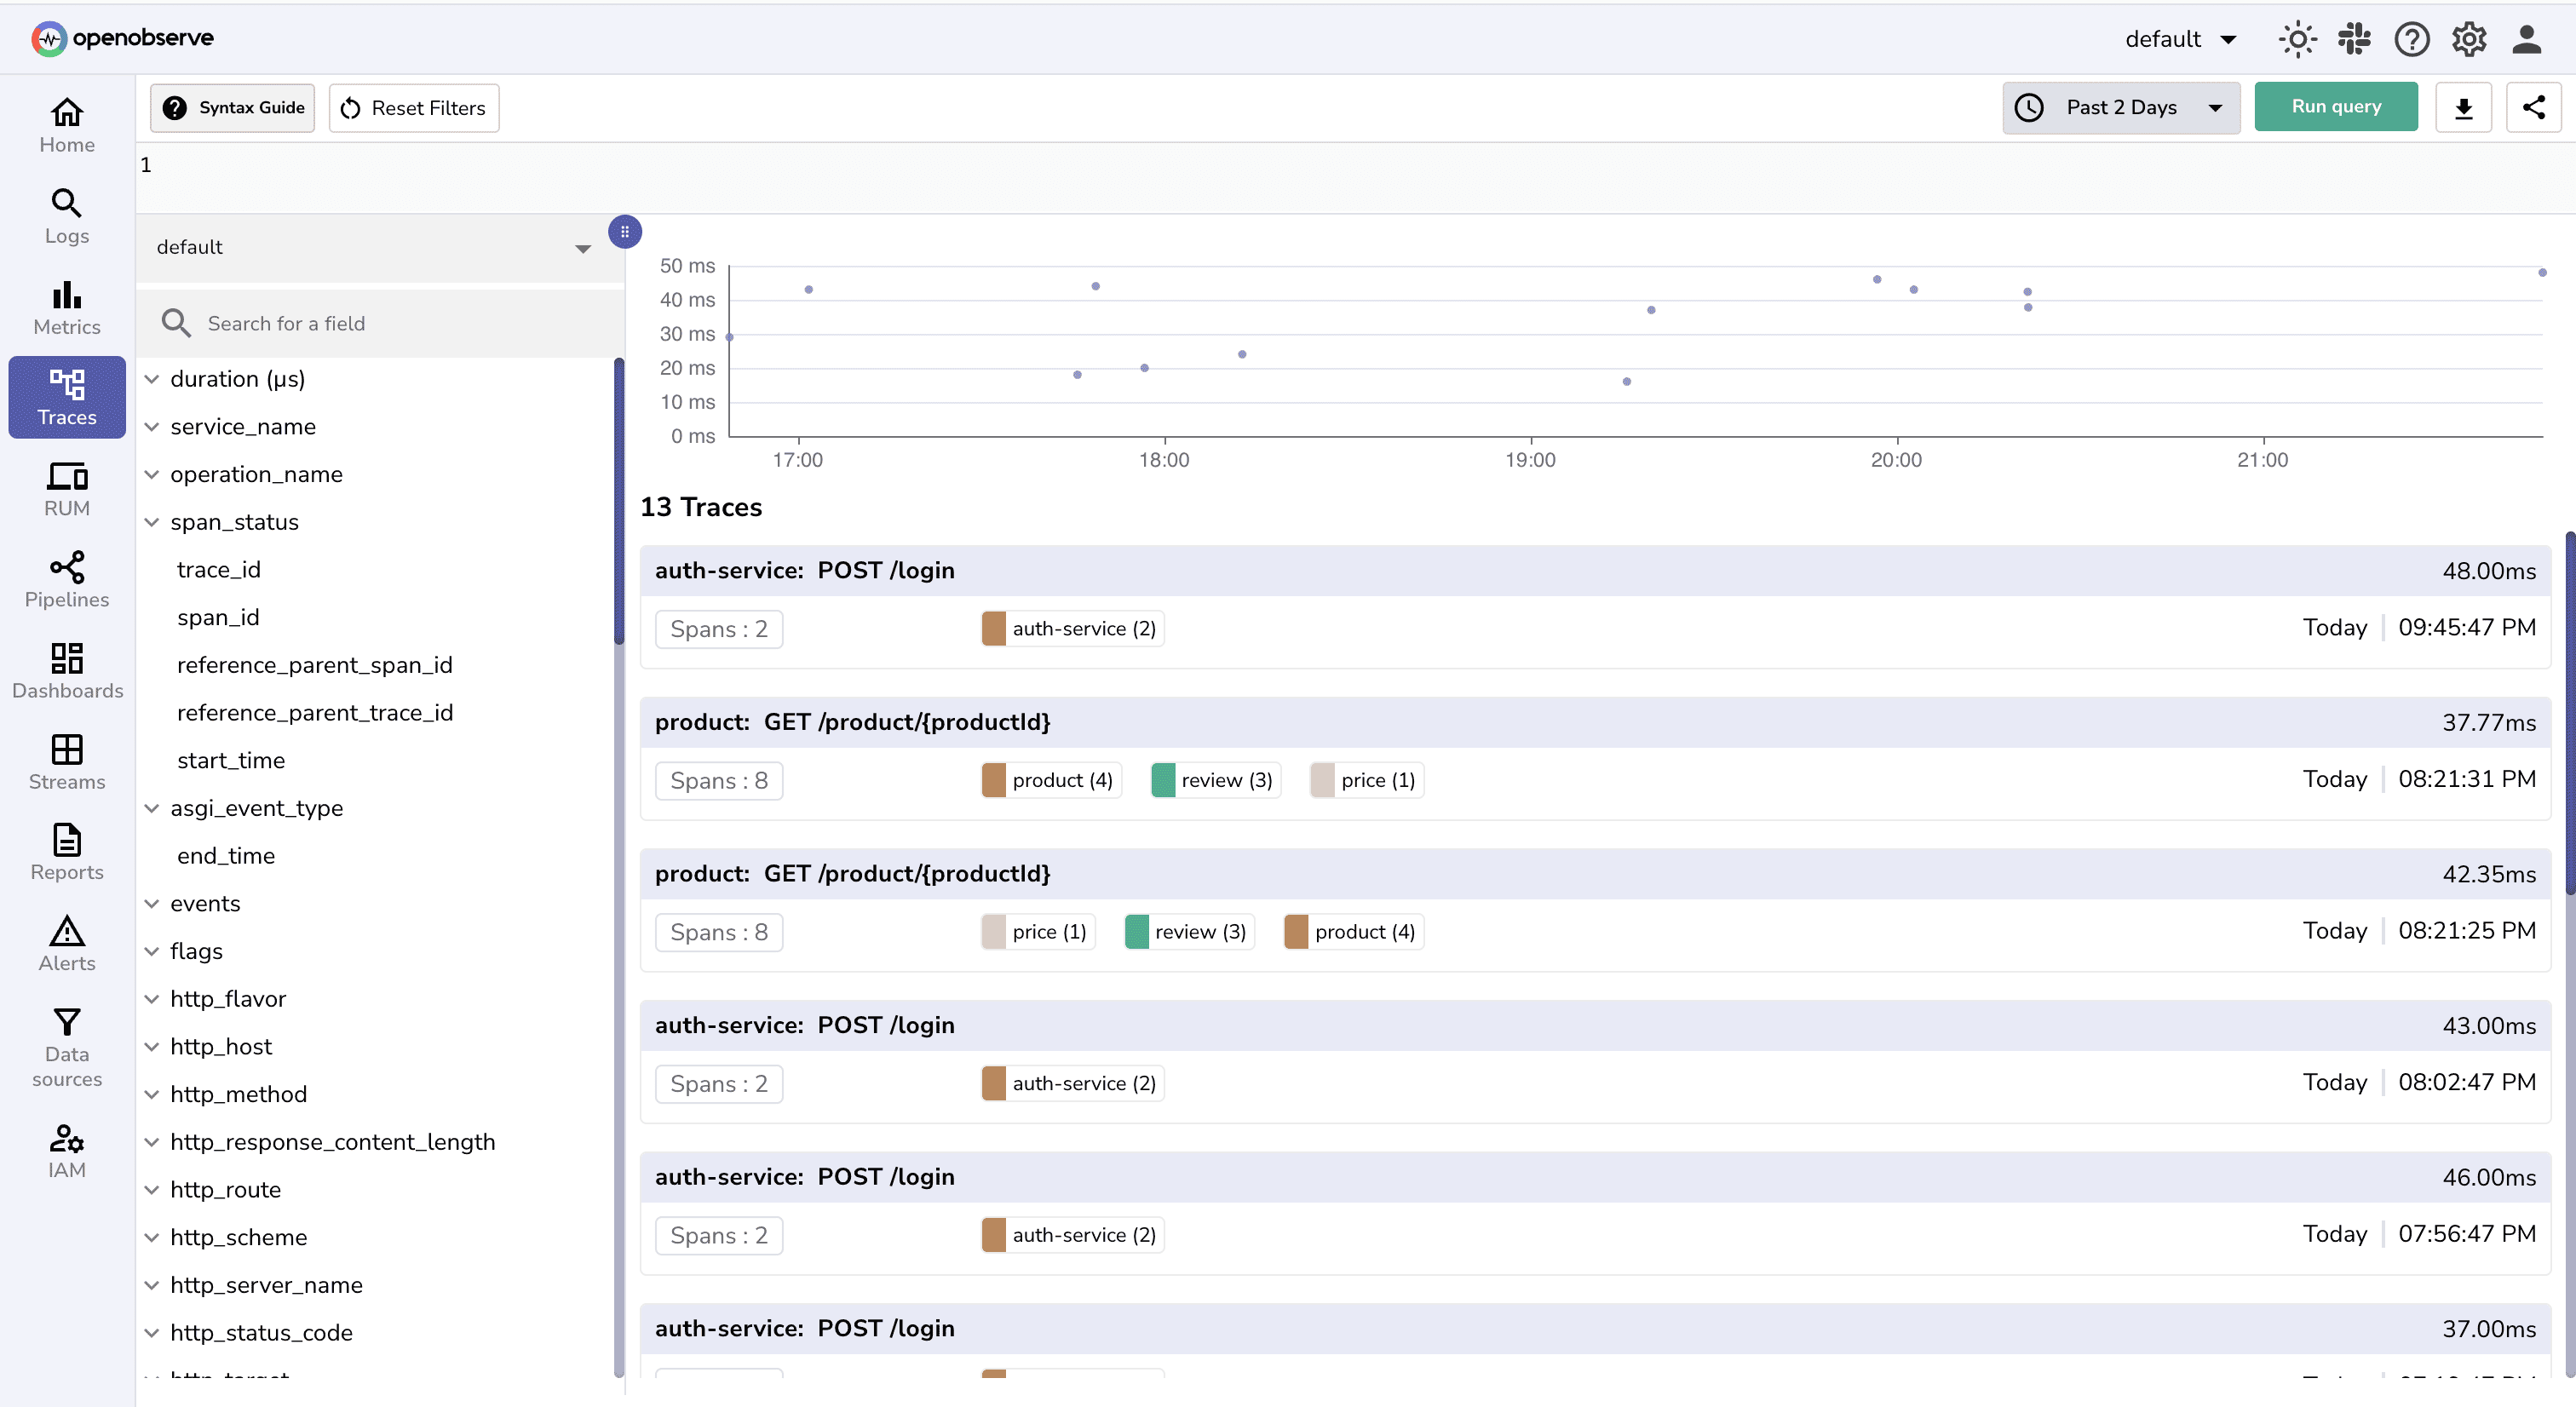
**SLO**: _"95th percentile login response time should stay under 500ms over any 7-day rolling window"_
(_Note_: This threshold is just an example. SLOs vary based on business impact, user expectations, and service risk tolerance.)
**Why P95?** Averages hide problems. P95 tells us 95% of users get a response faster than this threshold, catching tail latency issues that affect real users.
## Step 2: Track your SLO
You need to verify if your service is meeting its defined performance targets.
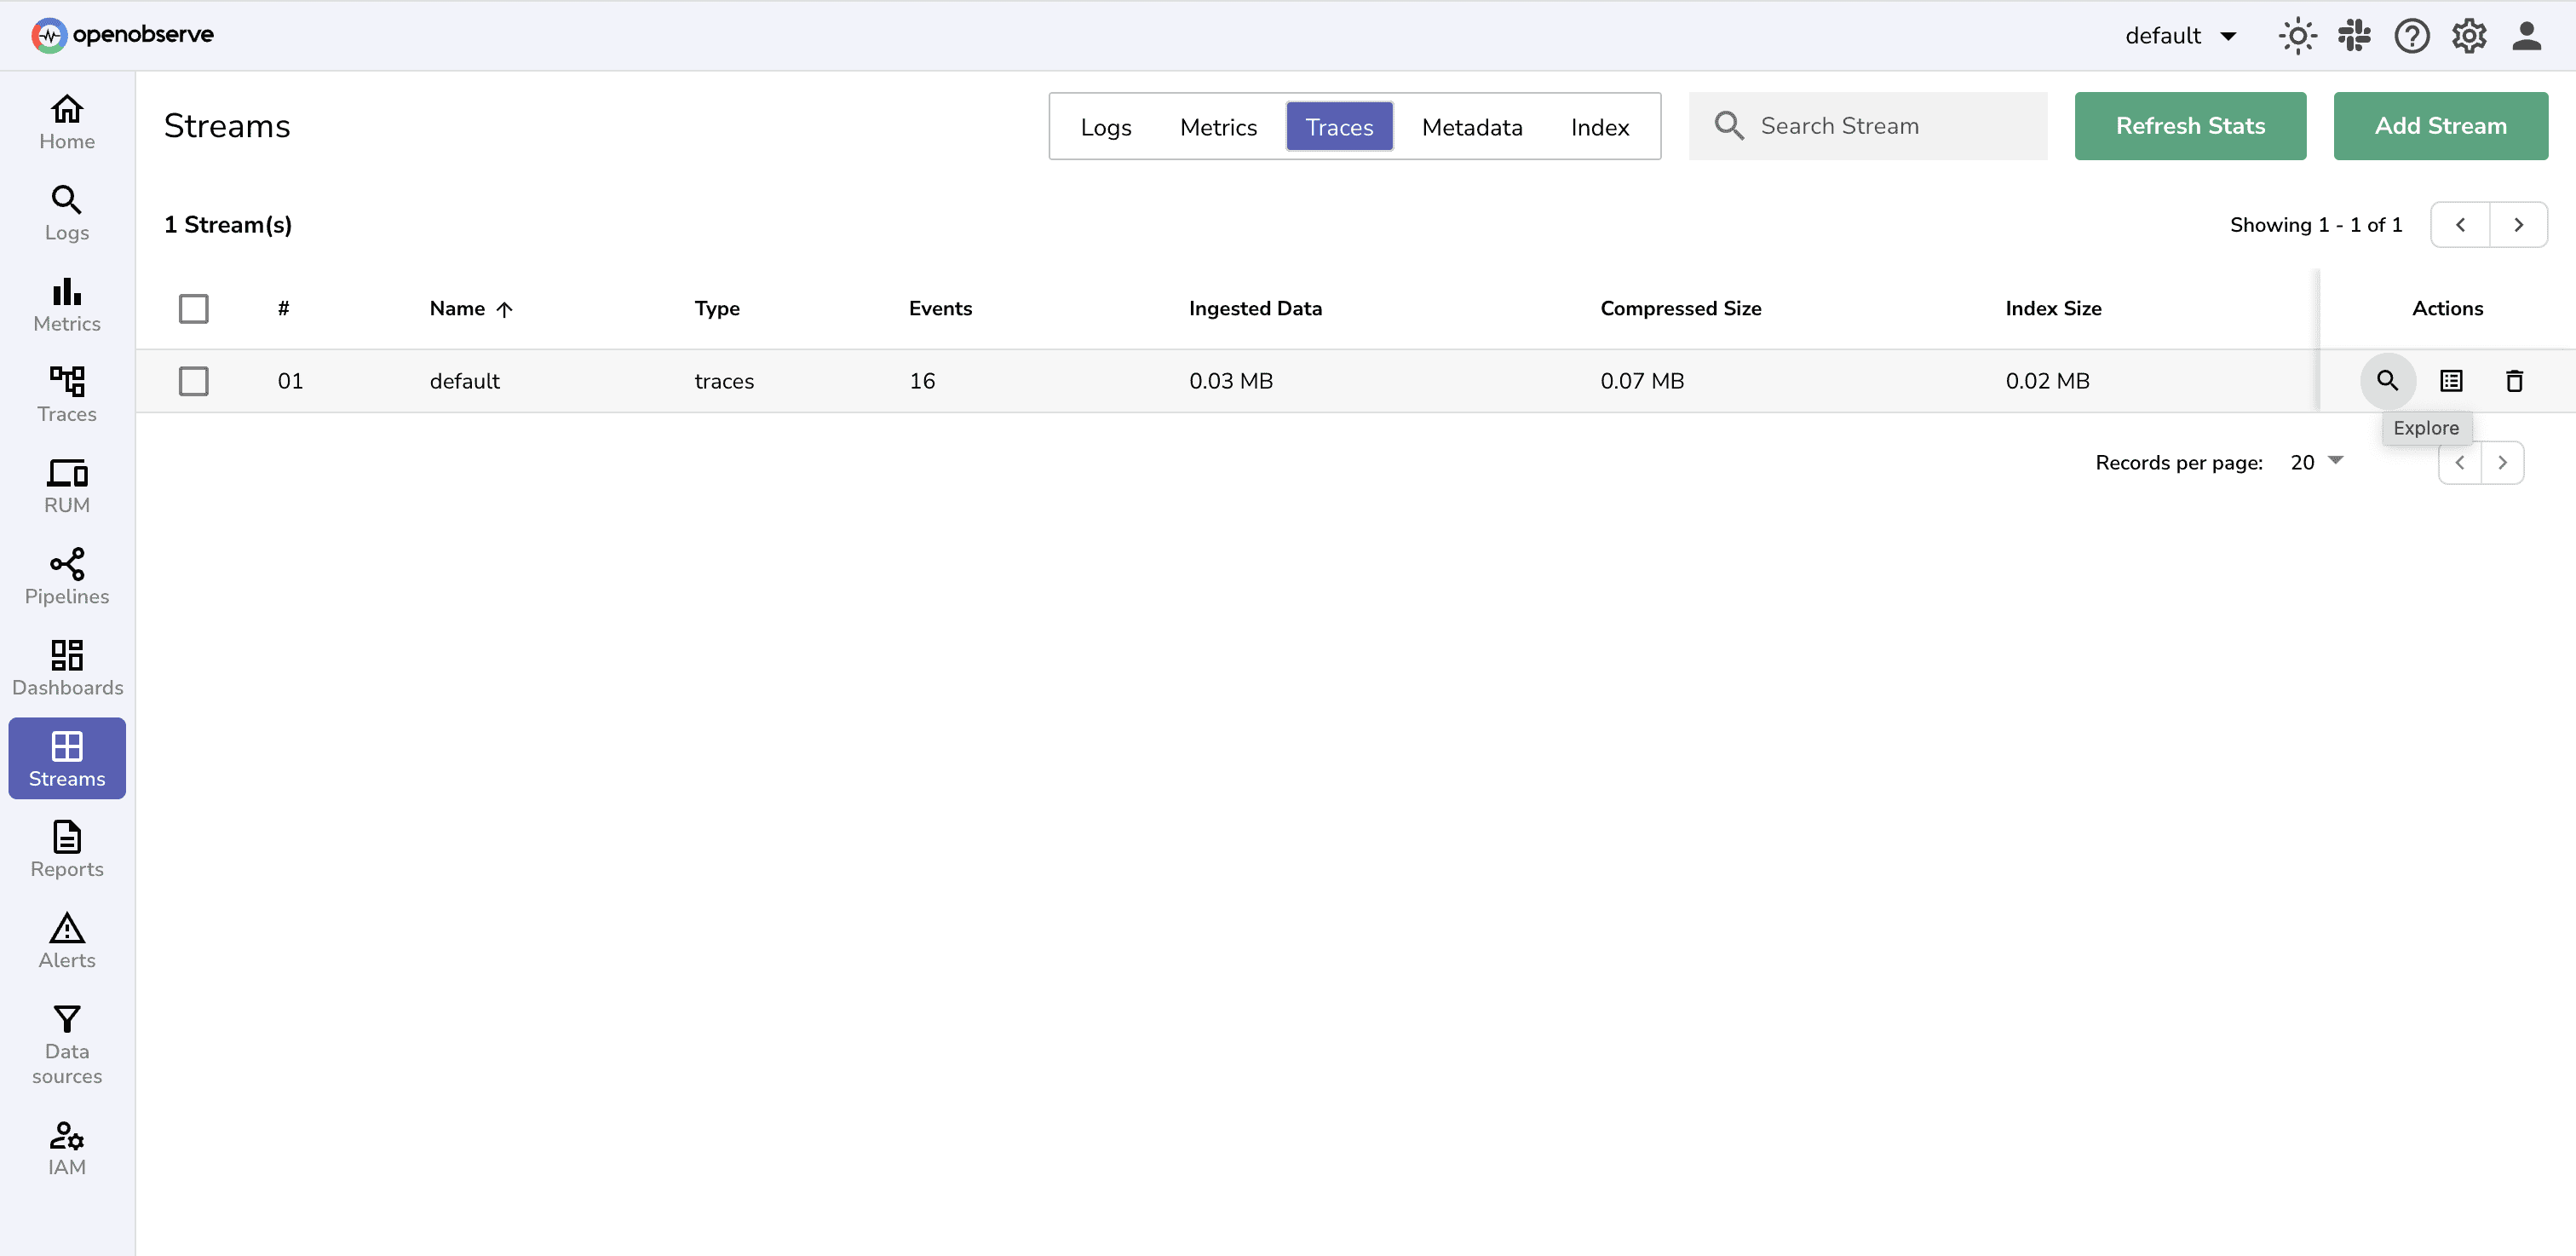
1. In the OpenObserve UI , go to `Stream` section and select your traces stream and click on `Explore` icon.
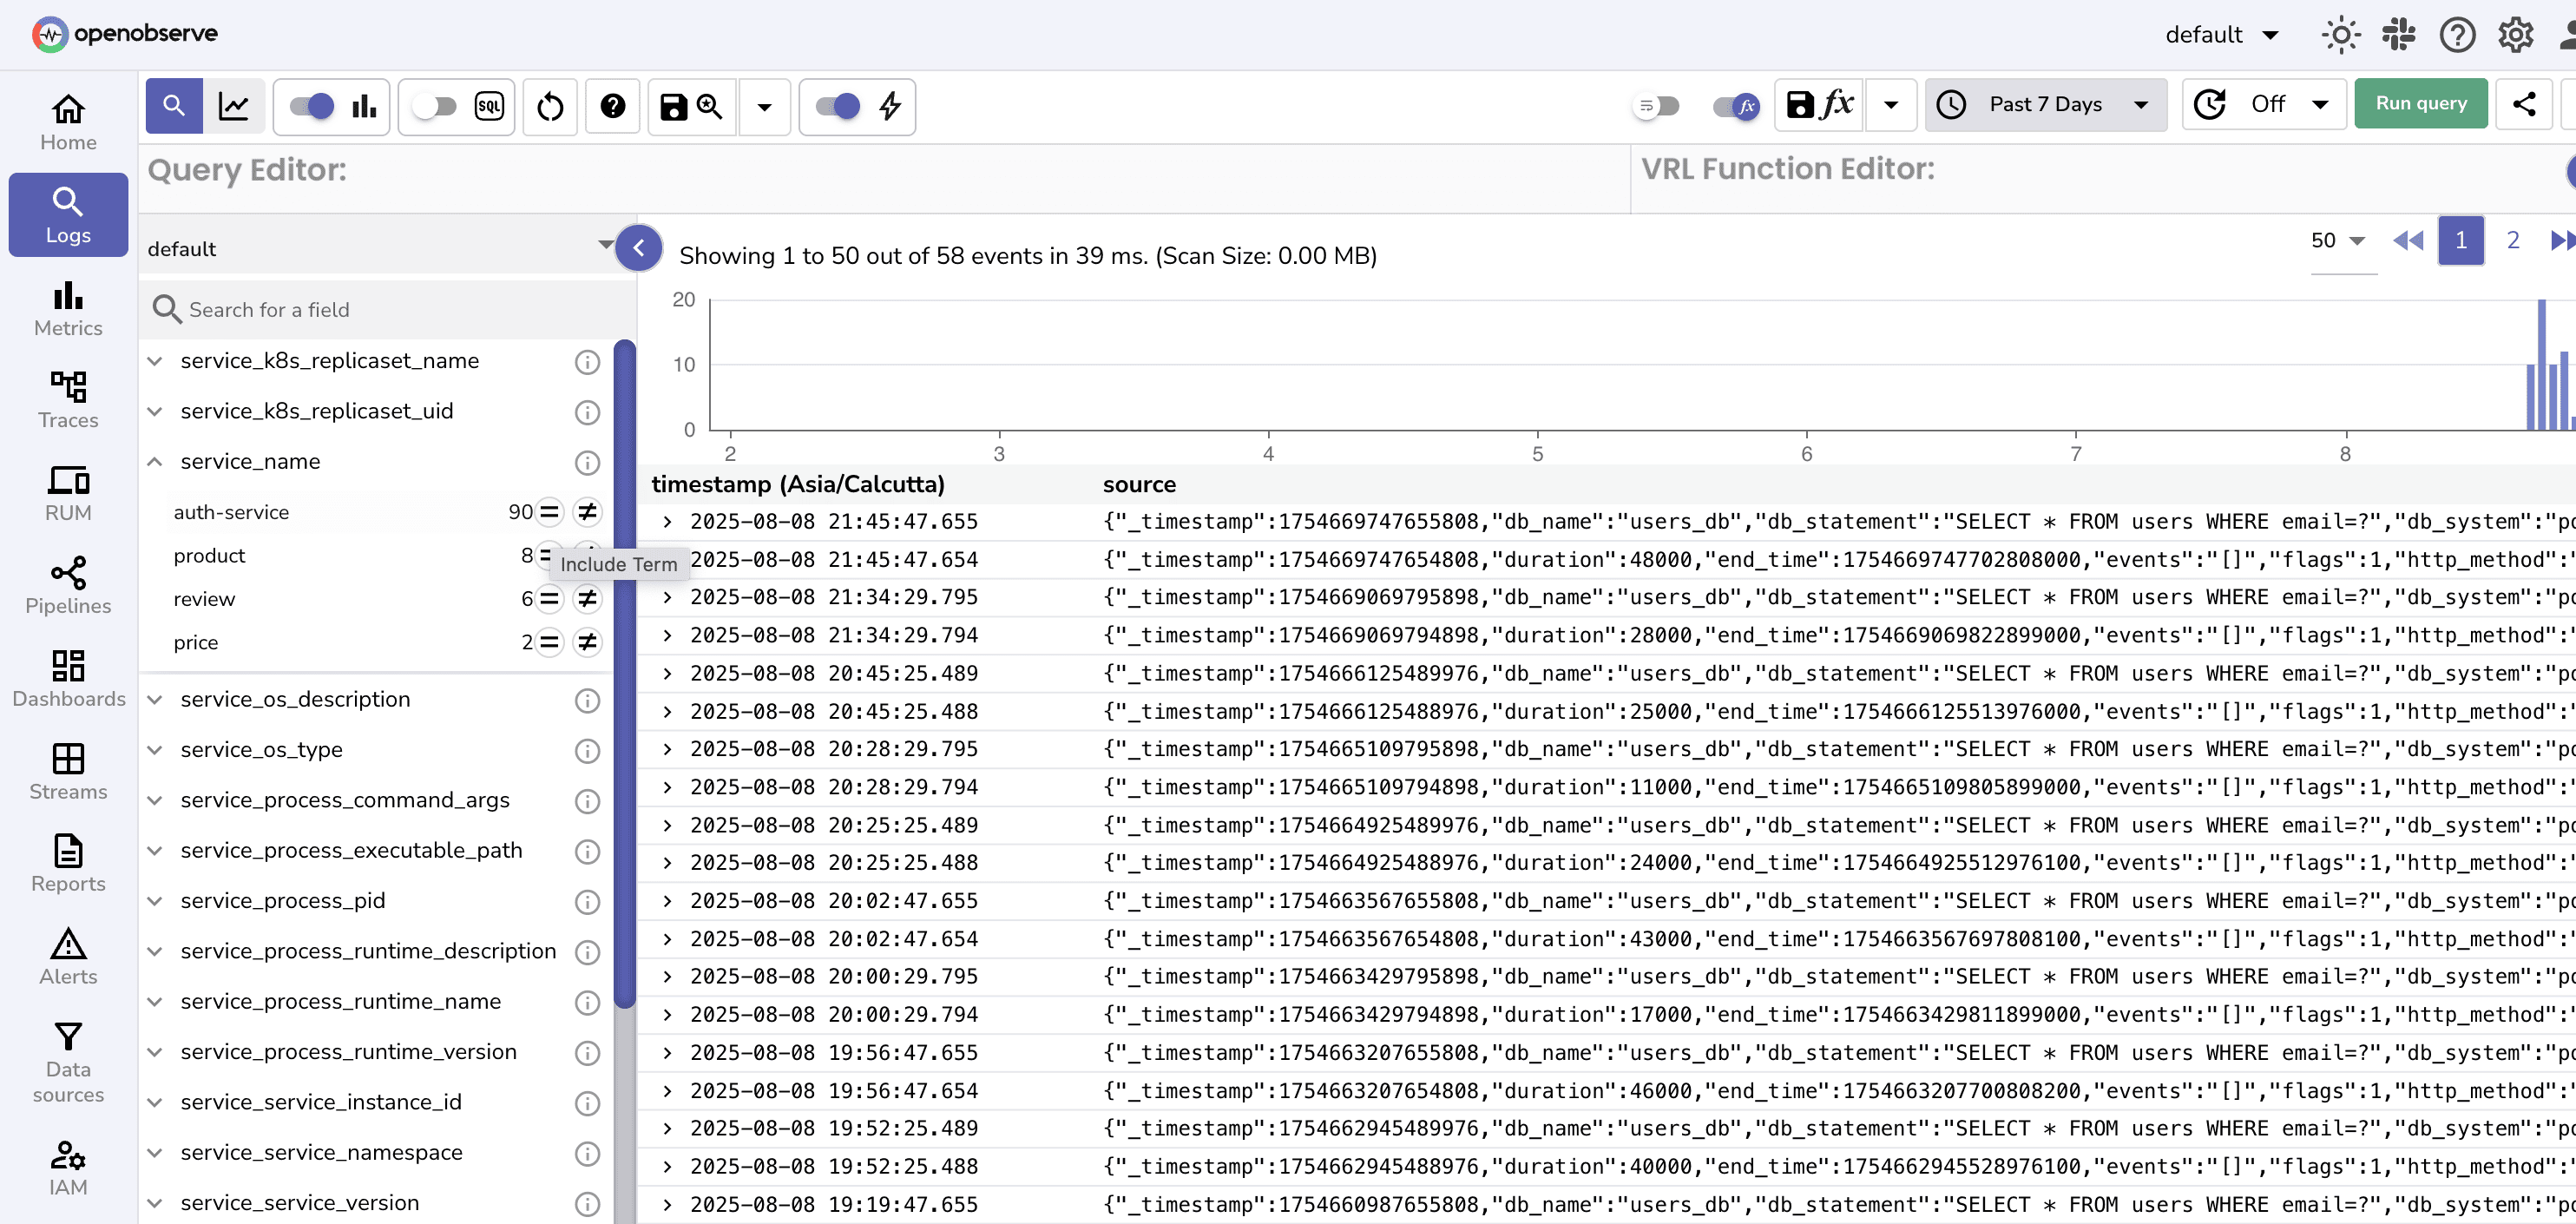
2. Use the Include term icon to filter for respective service, operation name and status code.
3. After filtering use SQL function to calculate 95th percentile for response time and check if the target is met.
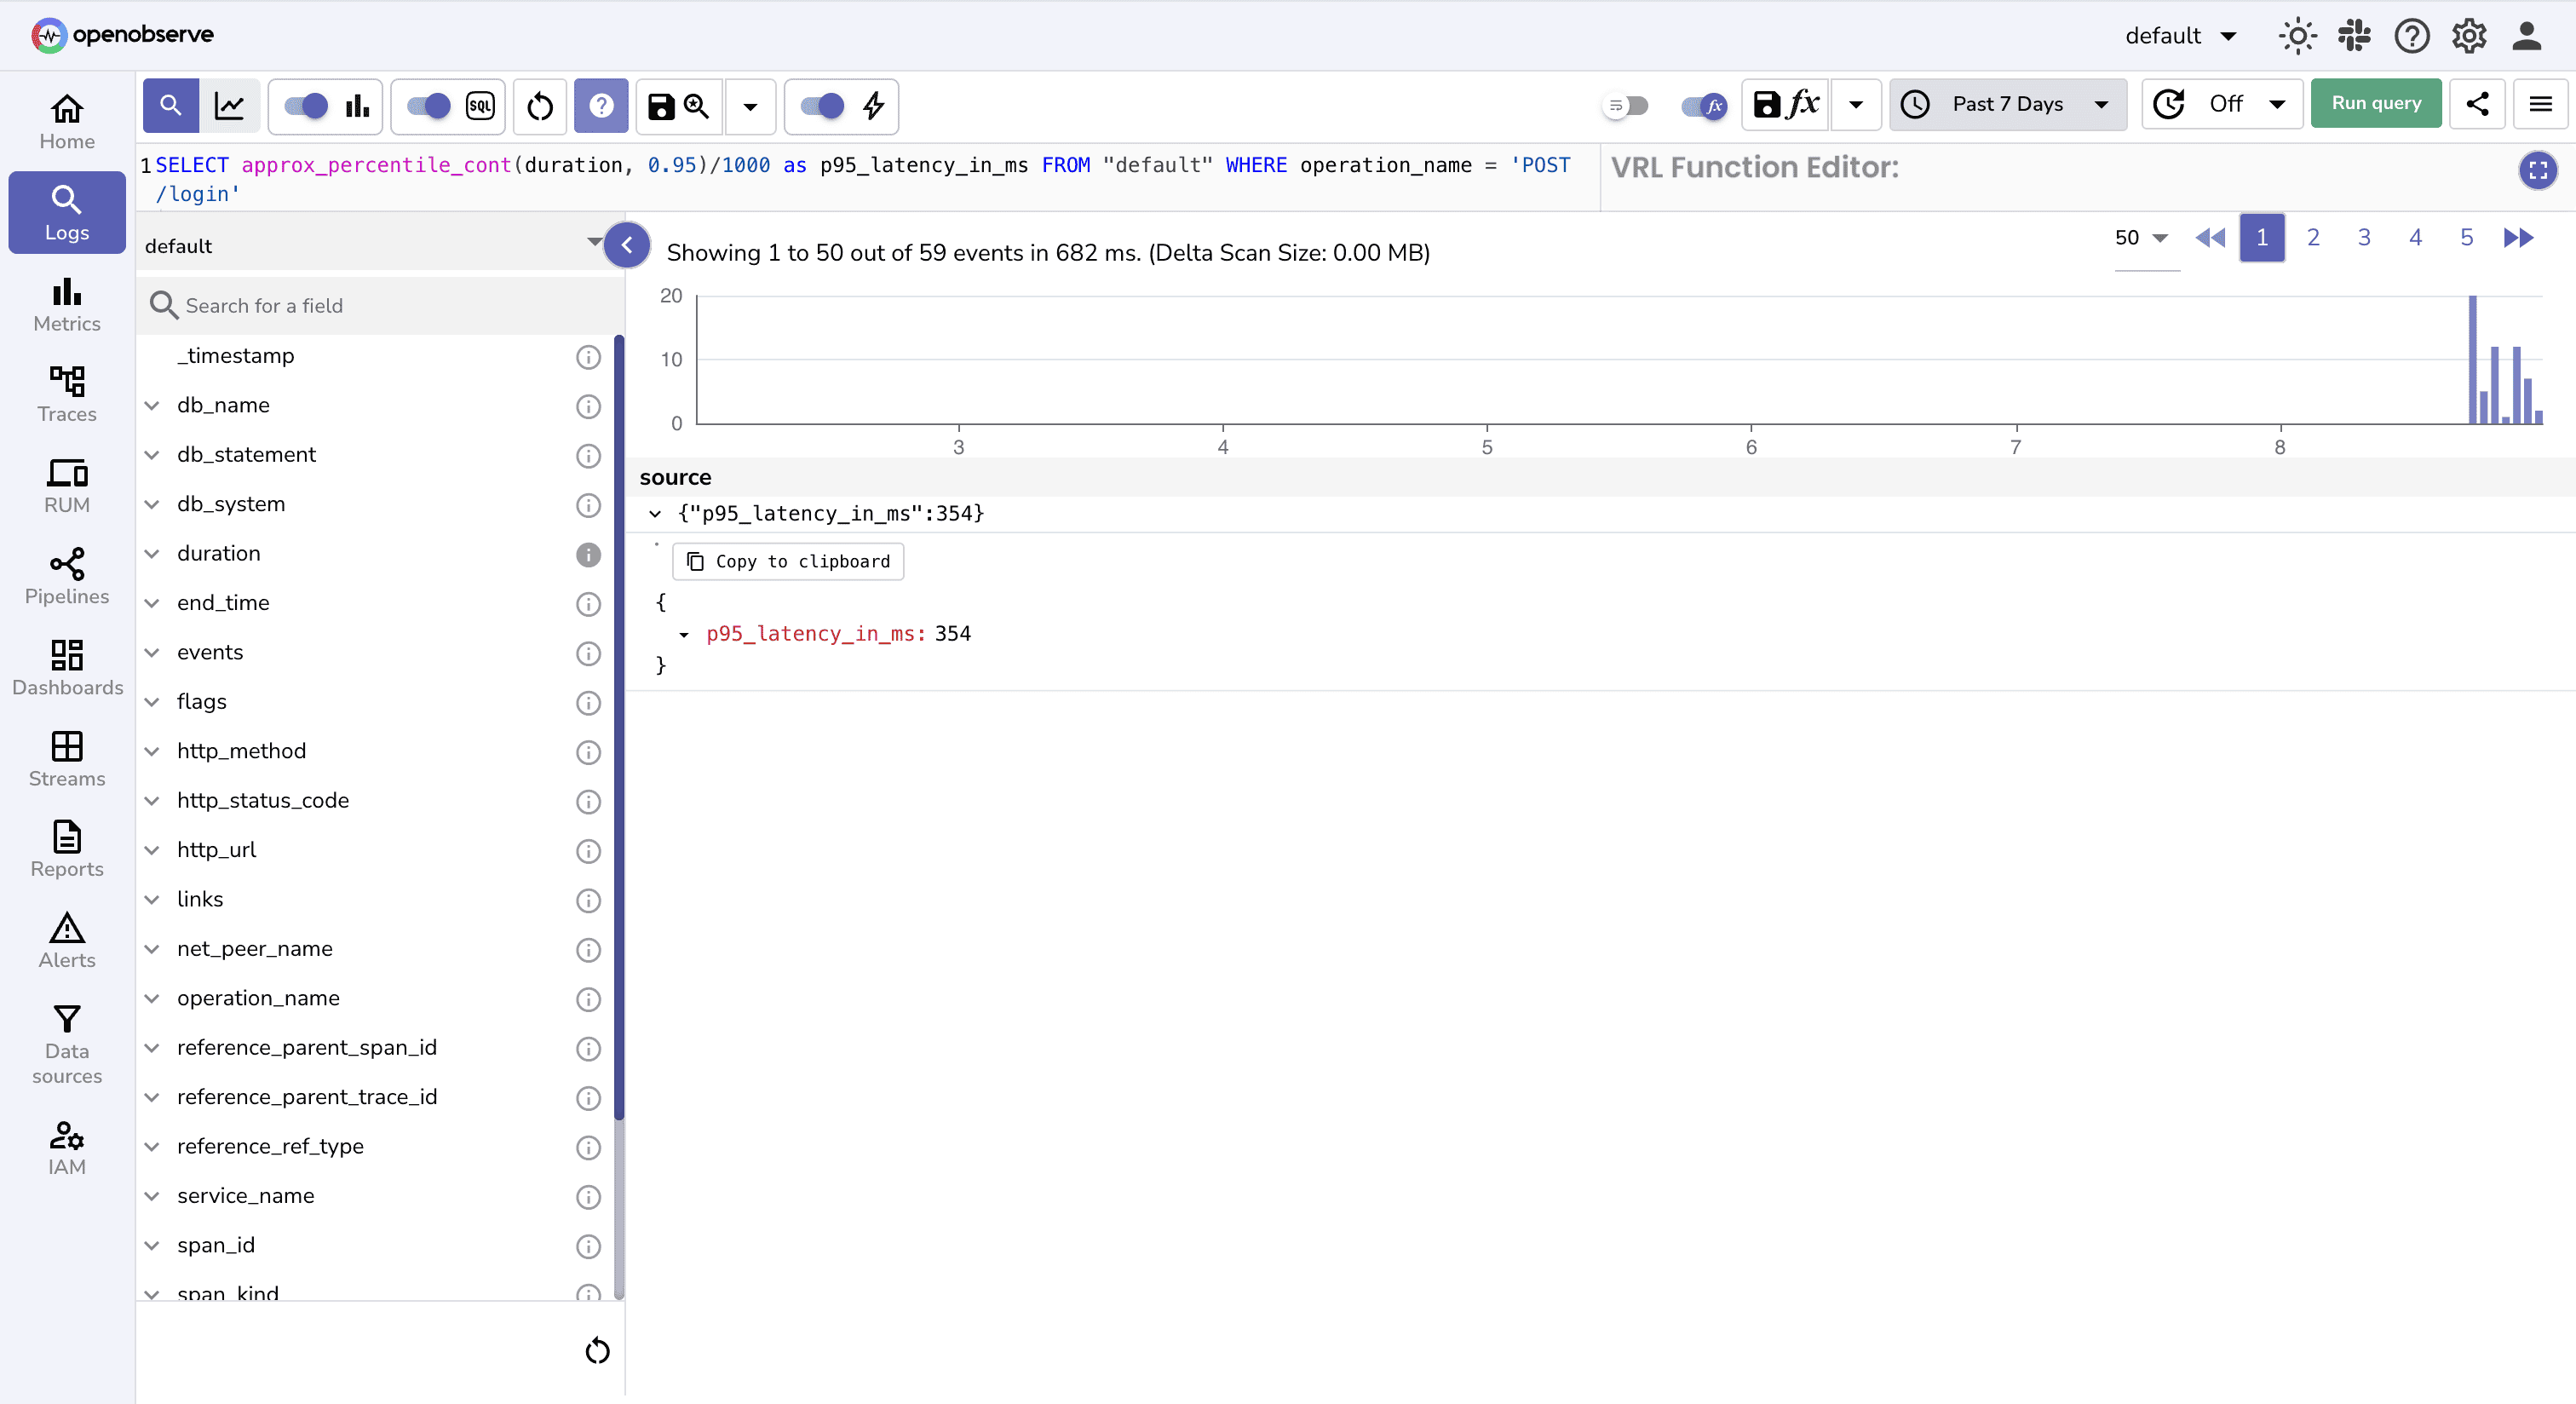
**Note:**
- We're filtering for `status_code < 400` because we want to consider **only successful or redirected requests** (i.e., not client or server errors) when evaluating latency SLOs.
- The `duration` field is in microseconds in this case, so we divide by 1000 to convert the result to milliseconds for comparison with the 500ms SLO target.
So, p95_latency is <500 ms, so our SLO target is not at risk. But do we need to rewrite the query every time to check compliance?
Well , no. Instead, we can create dashboards.
## Step 3: Build Your SLO Dashboard
Creating a dashboard helps visualize and observe SLO compliance trends over time without repeating manual checks.
1. Navigate to **OpenObserve → Dashboard** and create a new dashboard.
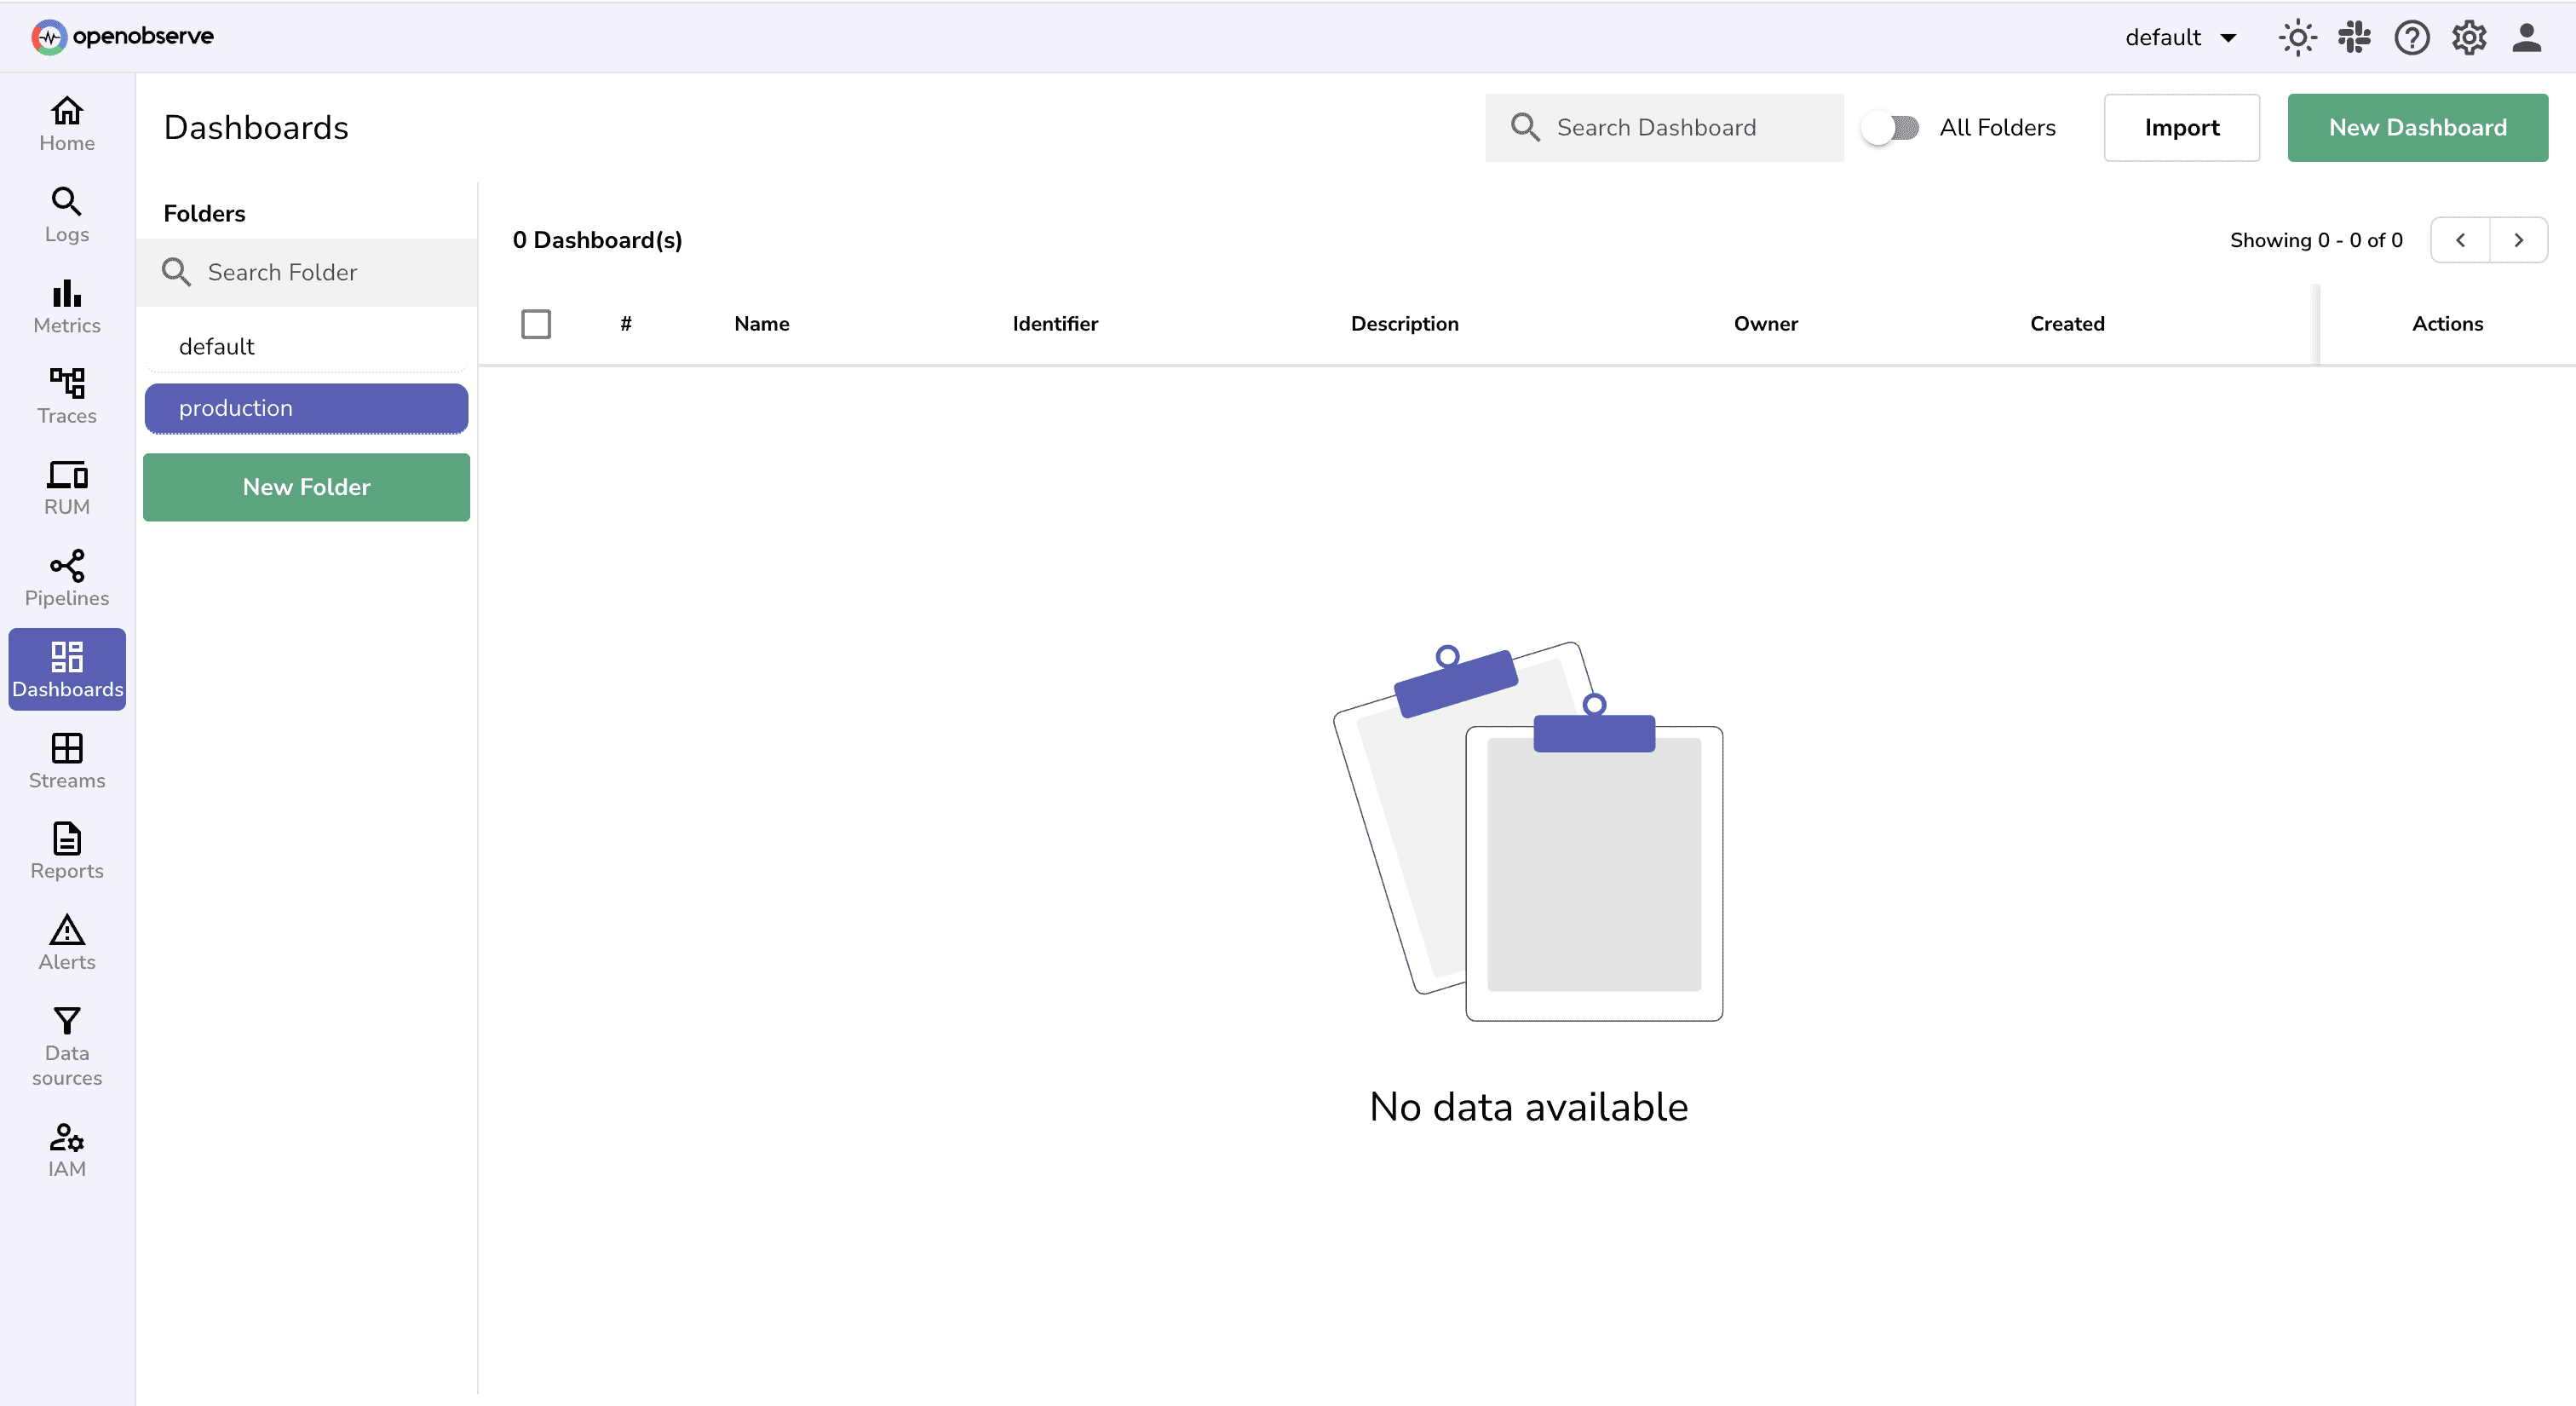
2. Next, add Panels to your dashboard
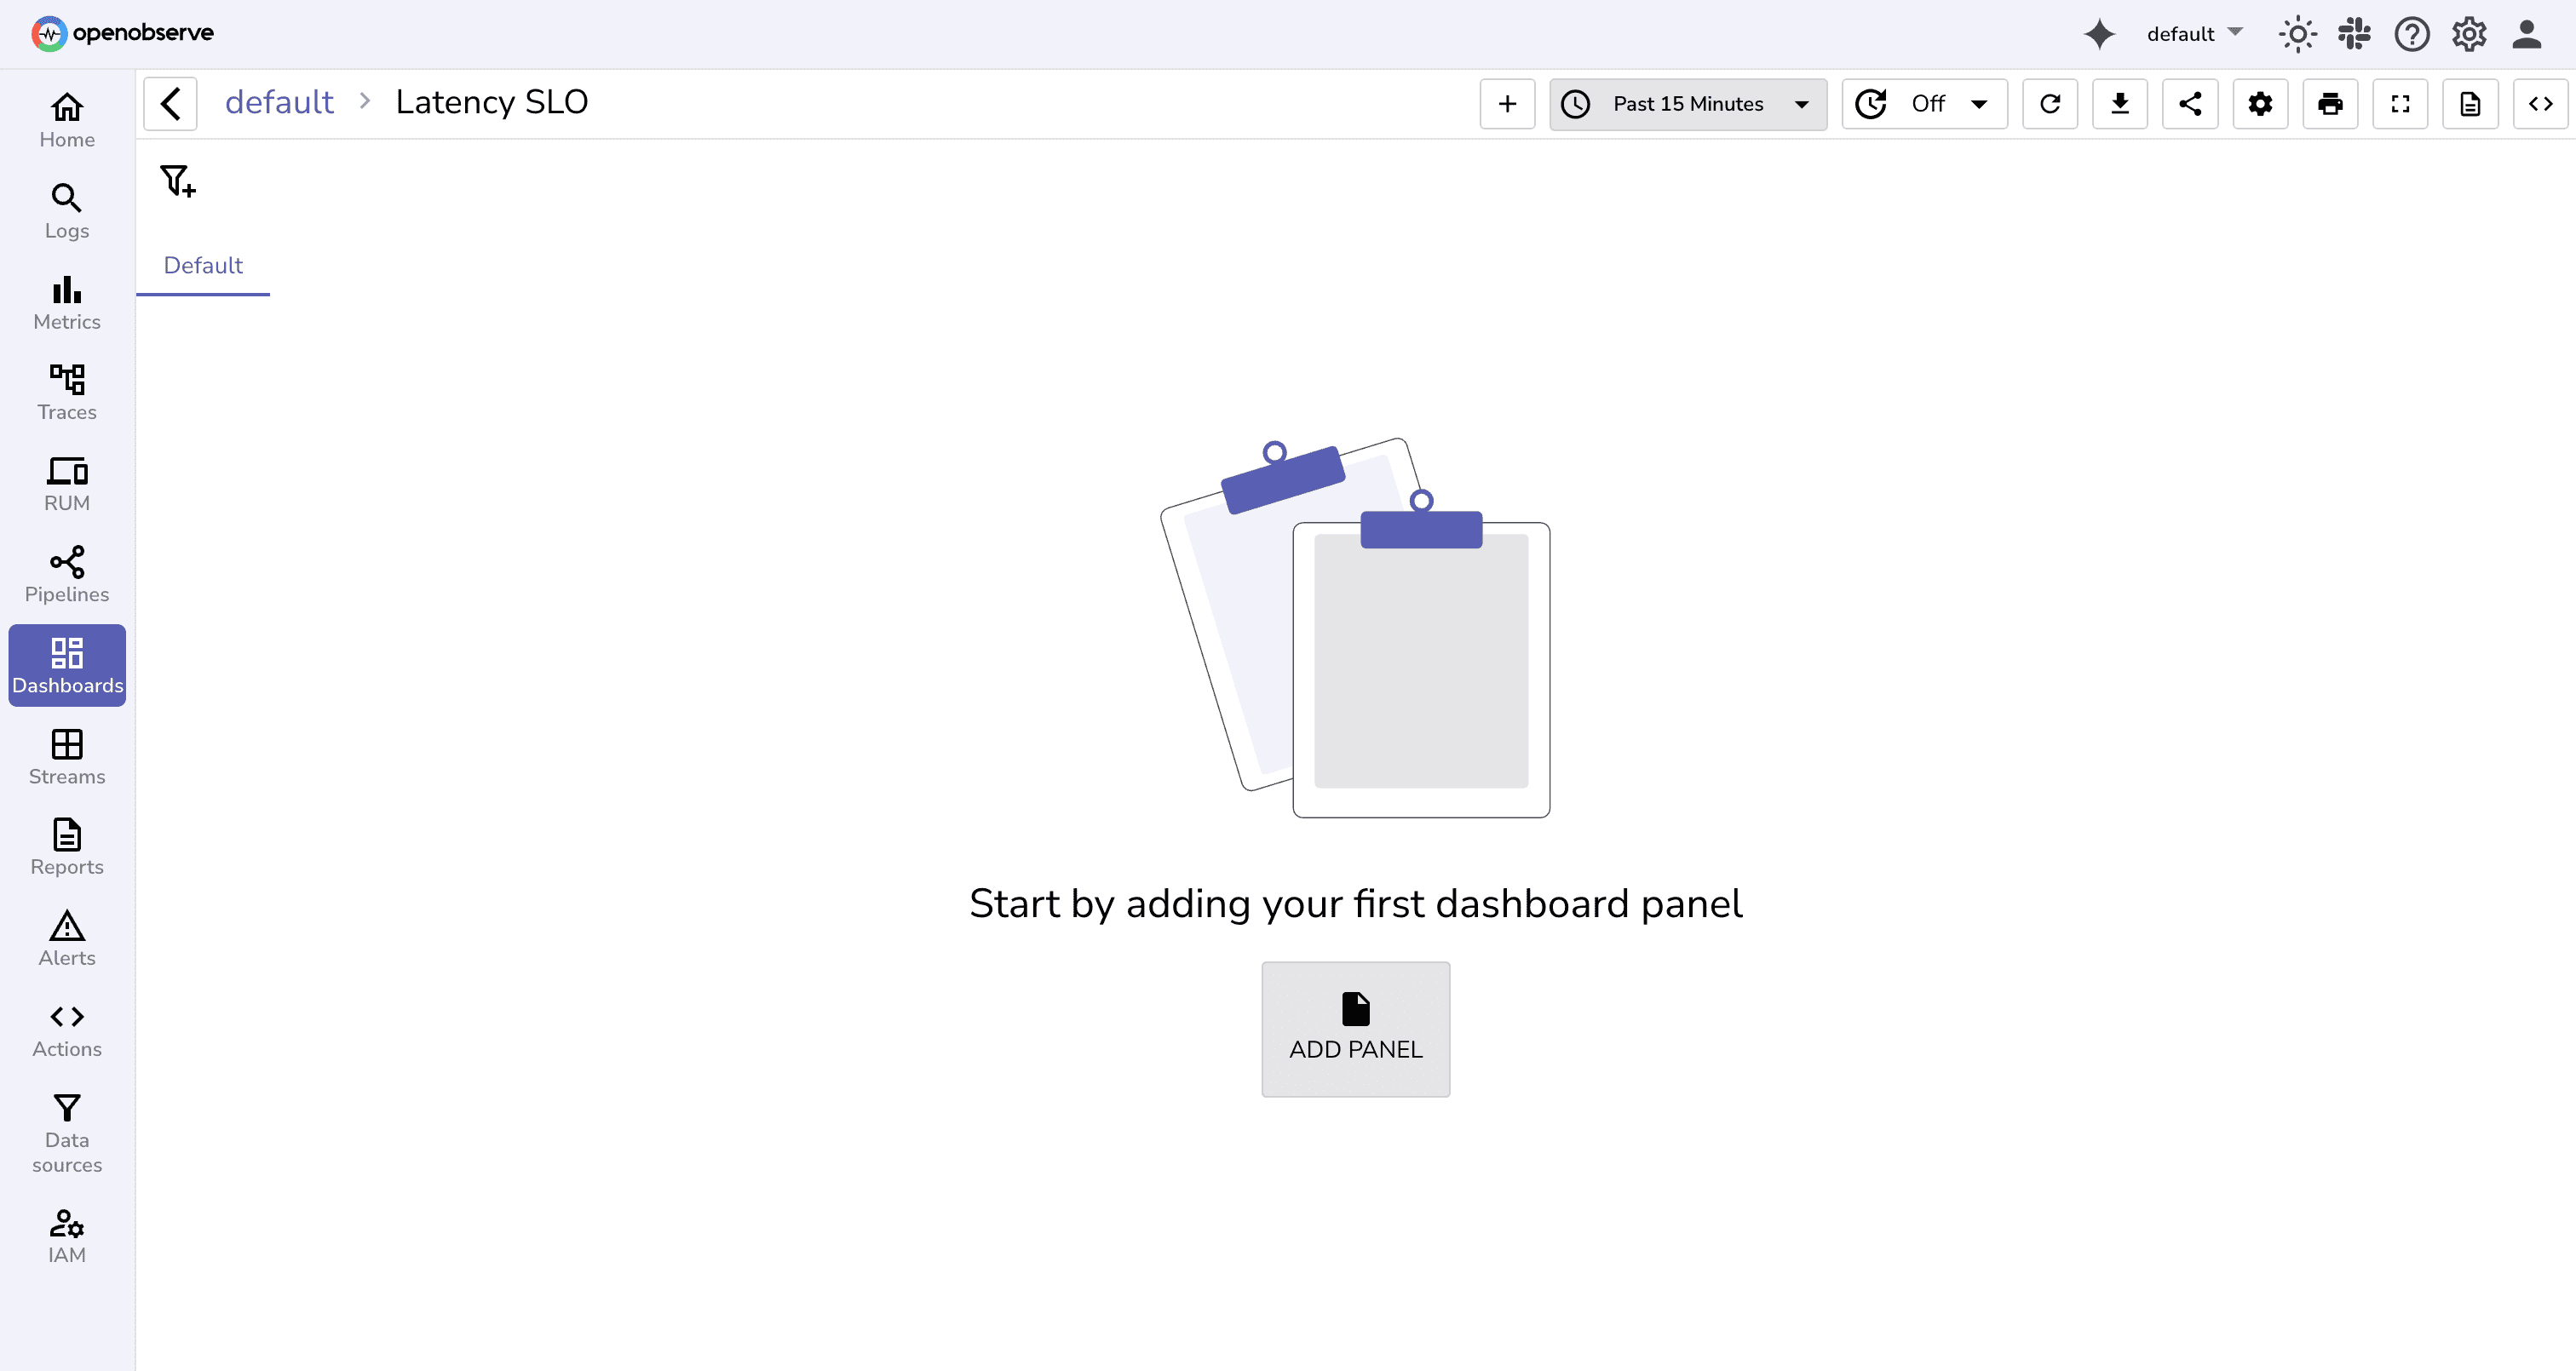
### Panel 1: SLO Status Summary
- Select Chart type -> Markdown
- Add a **Markdown text** with your SLO definition:
```
## Login Latency SLO
- **Target**: P95 < 500ms over 7 day rolling window
- **Error Budget**: 5% of requests can exceed 500ms
- **Business Impact**: Latency >500ms correlates with 12% higher bounce rate
- **Owner**: Backend Team
- **Escalation**: #backend-oncall
```
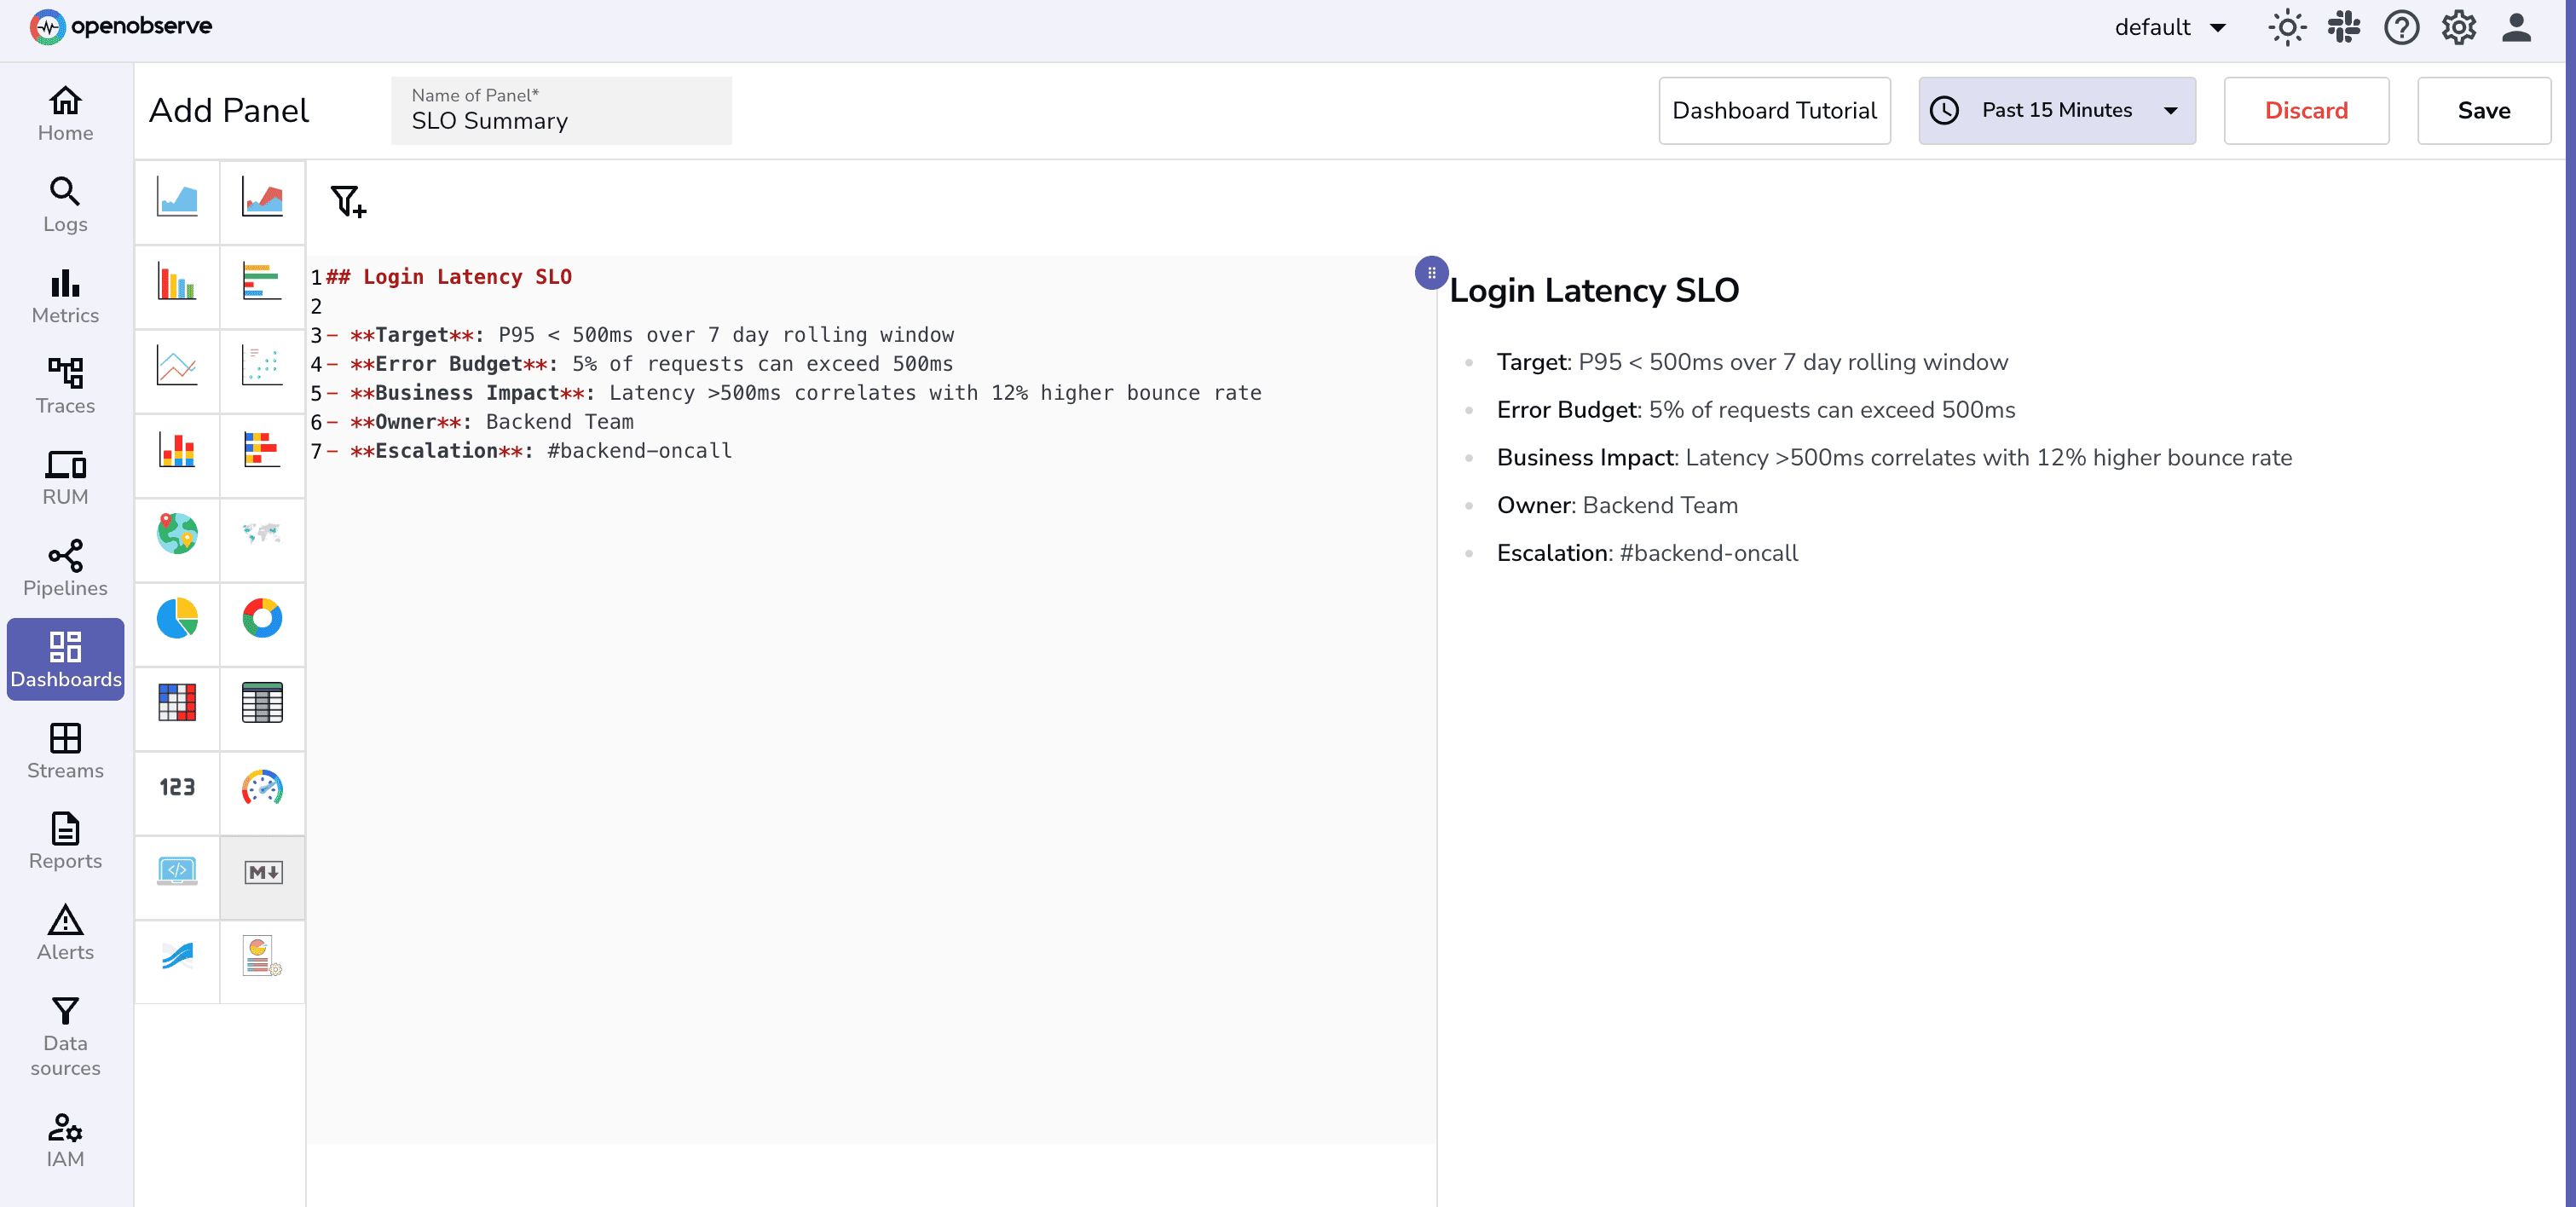
This provides a clear, at-a-glance summary of the SLO, helping teams align on objectives, impact, and ownership.
### Panel 2: SLI- Latency Trend Over Time
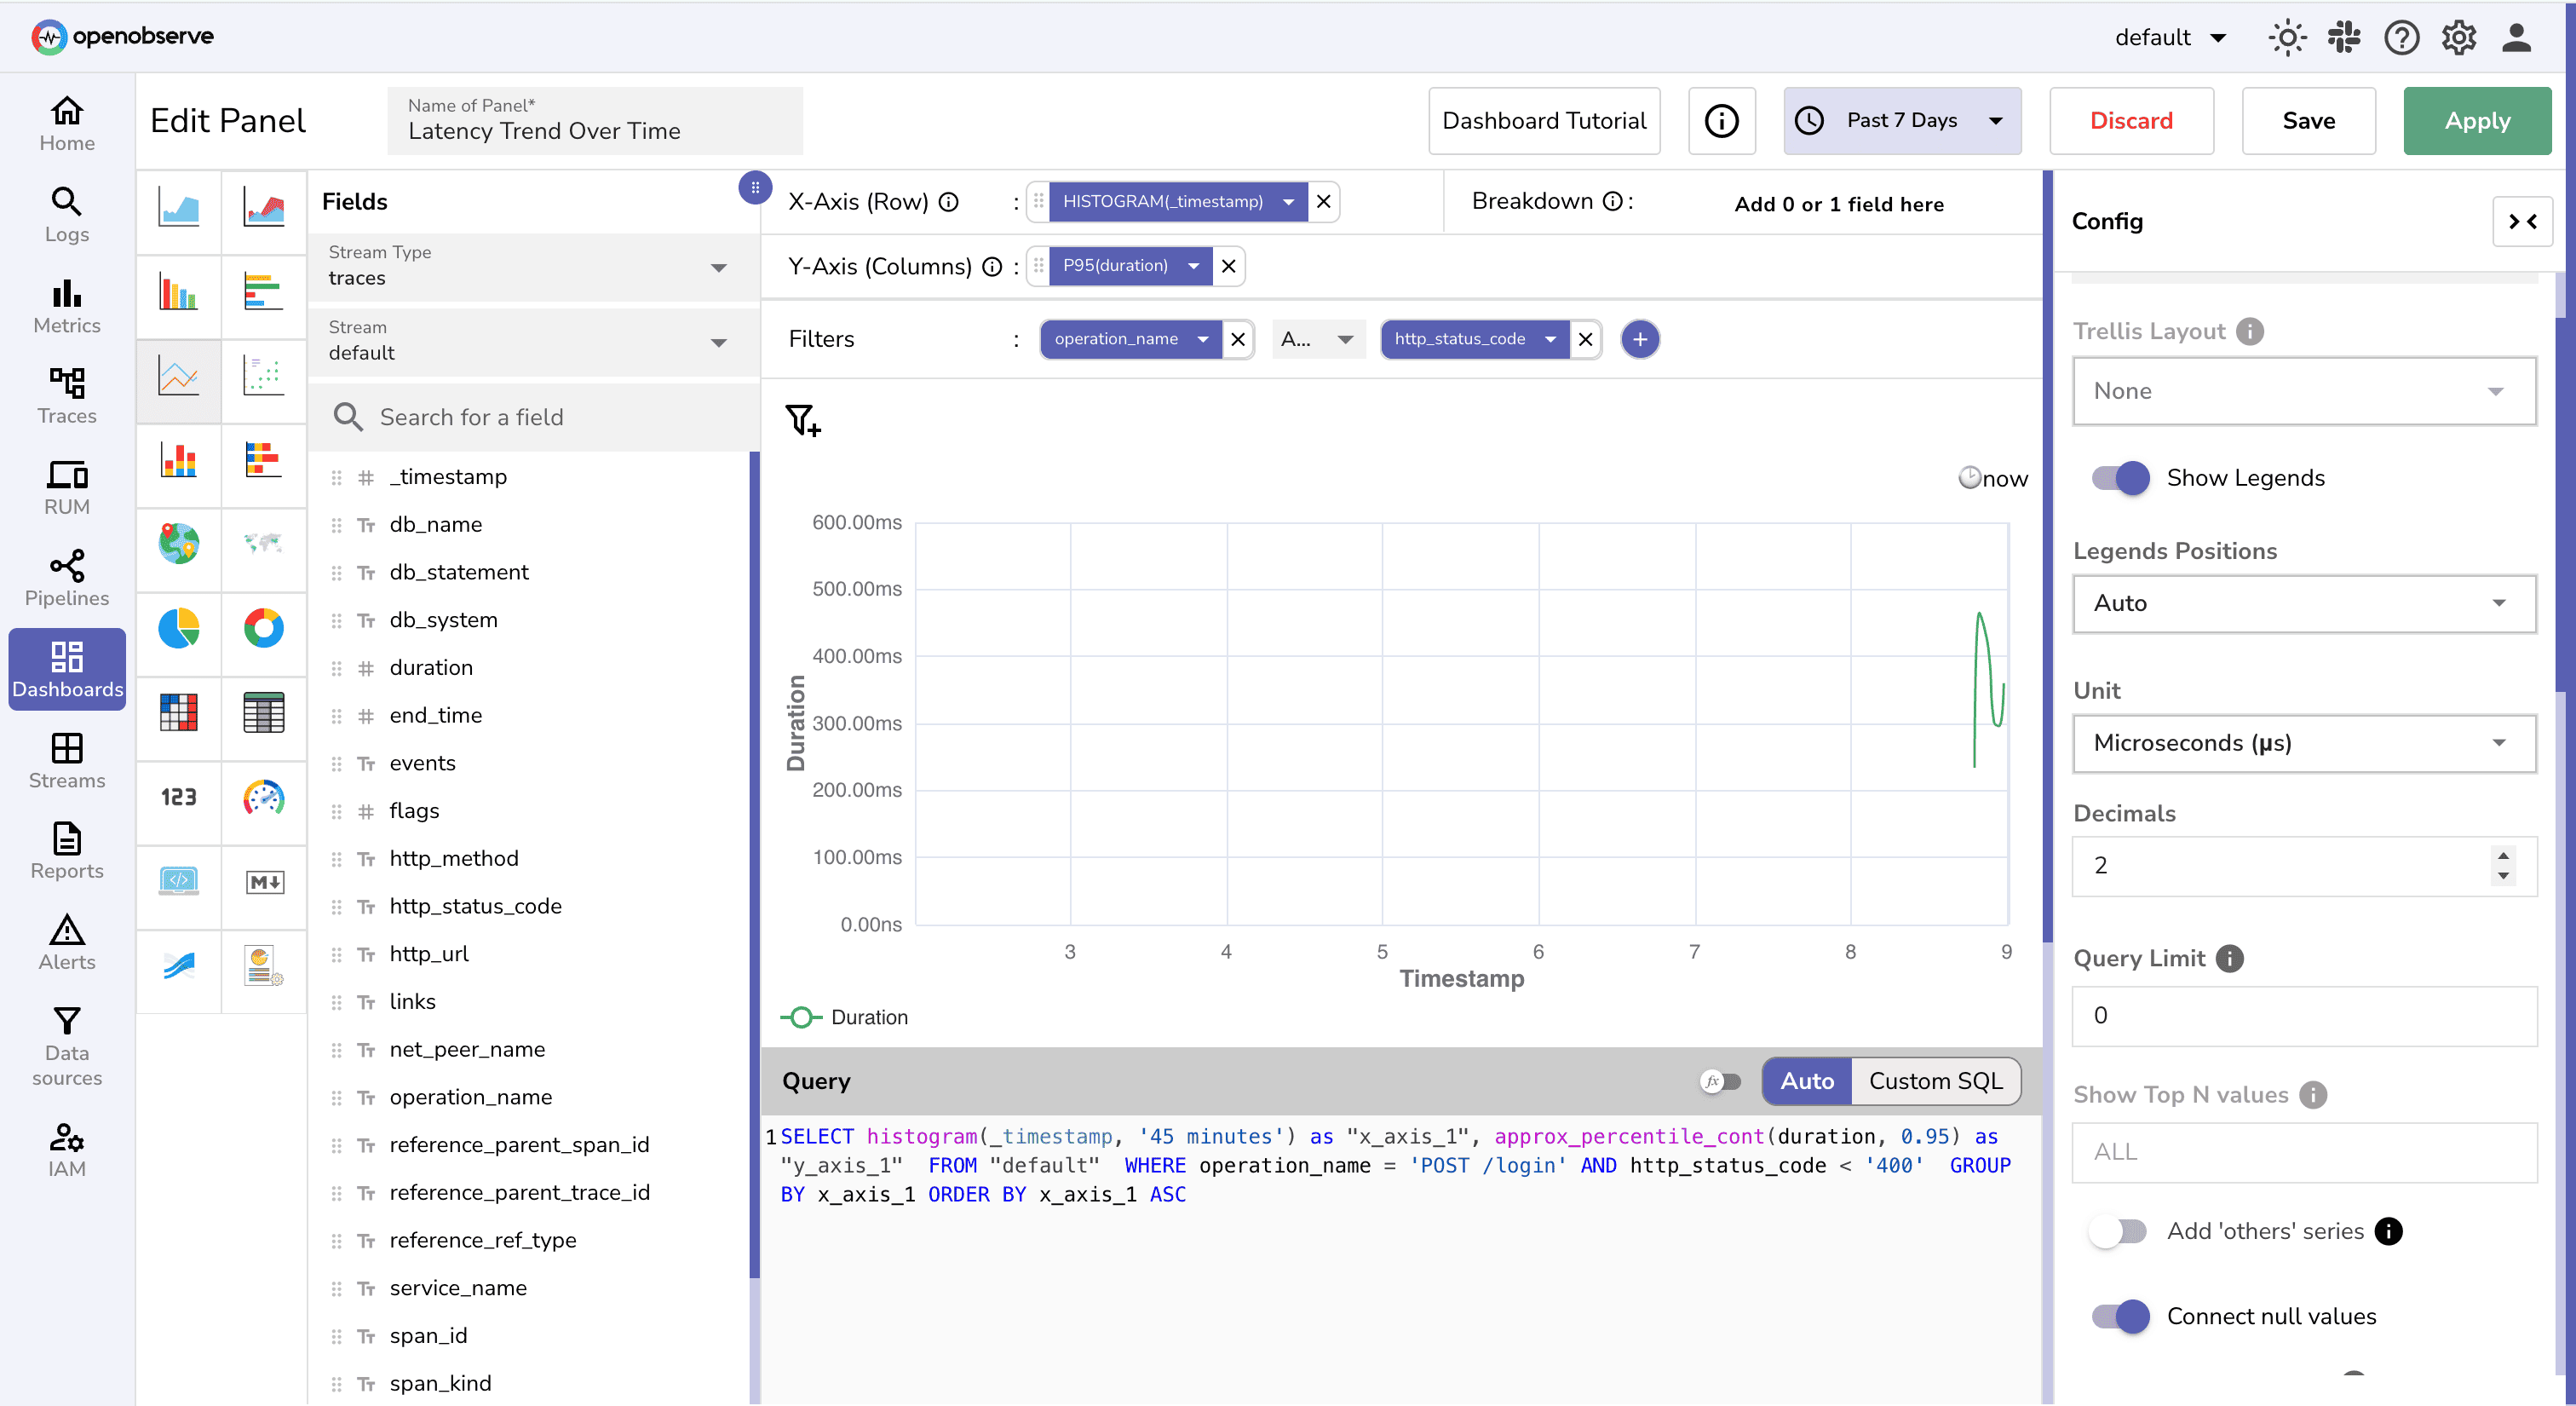
Create a line chart to capture your latency trends over time.
- Select the chart type as Line chart
- Select stream type and stream name
- Add `timestamp` in x-axis and P95 of response time / duration on y-axis
- Add filters based on `operation_name` and `status_code`
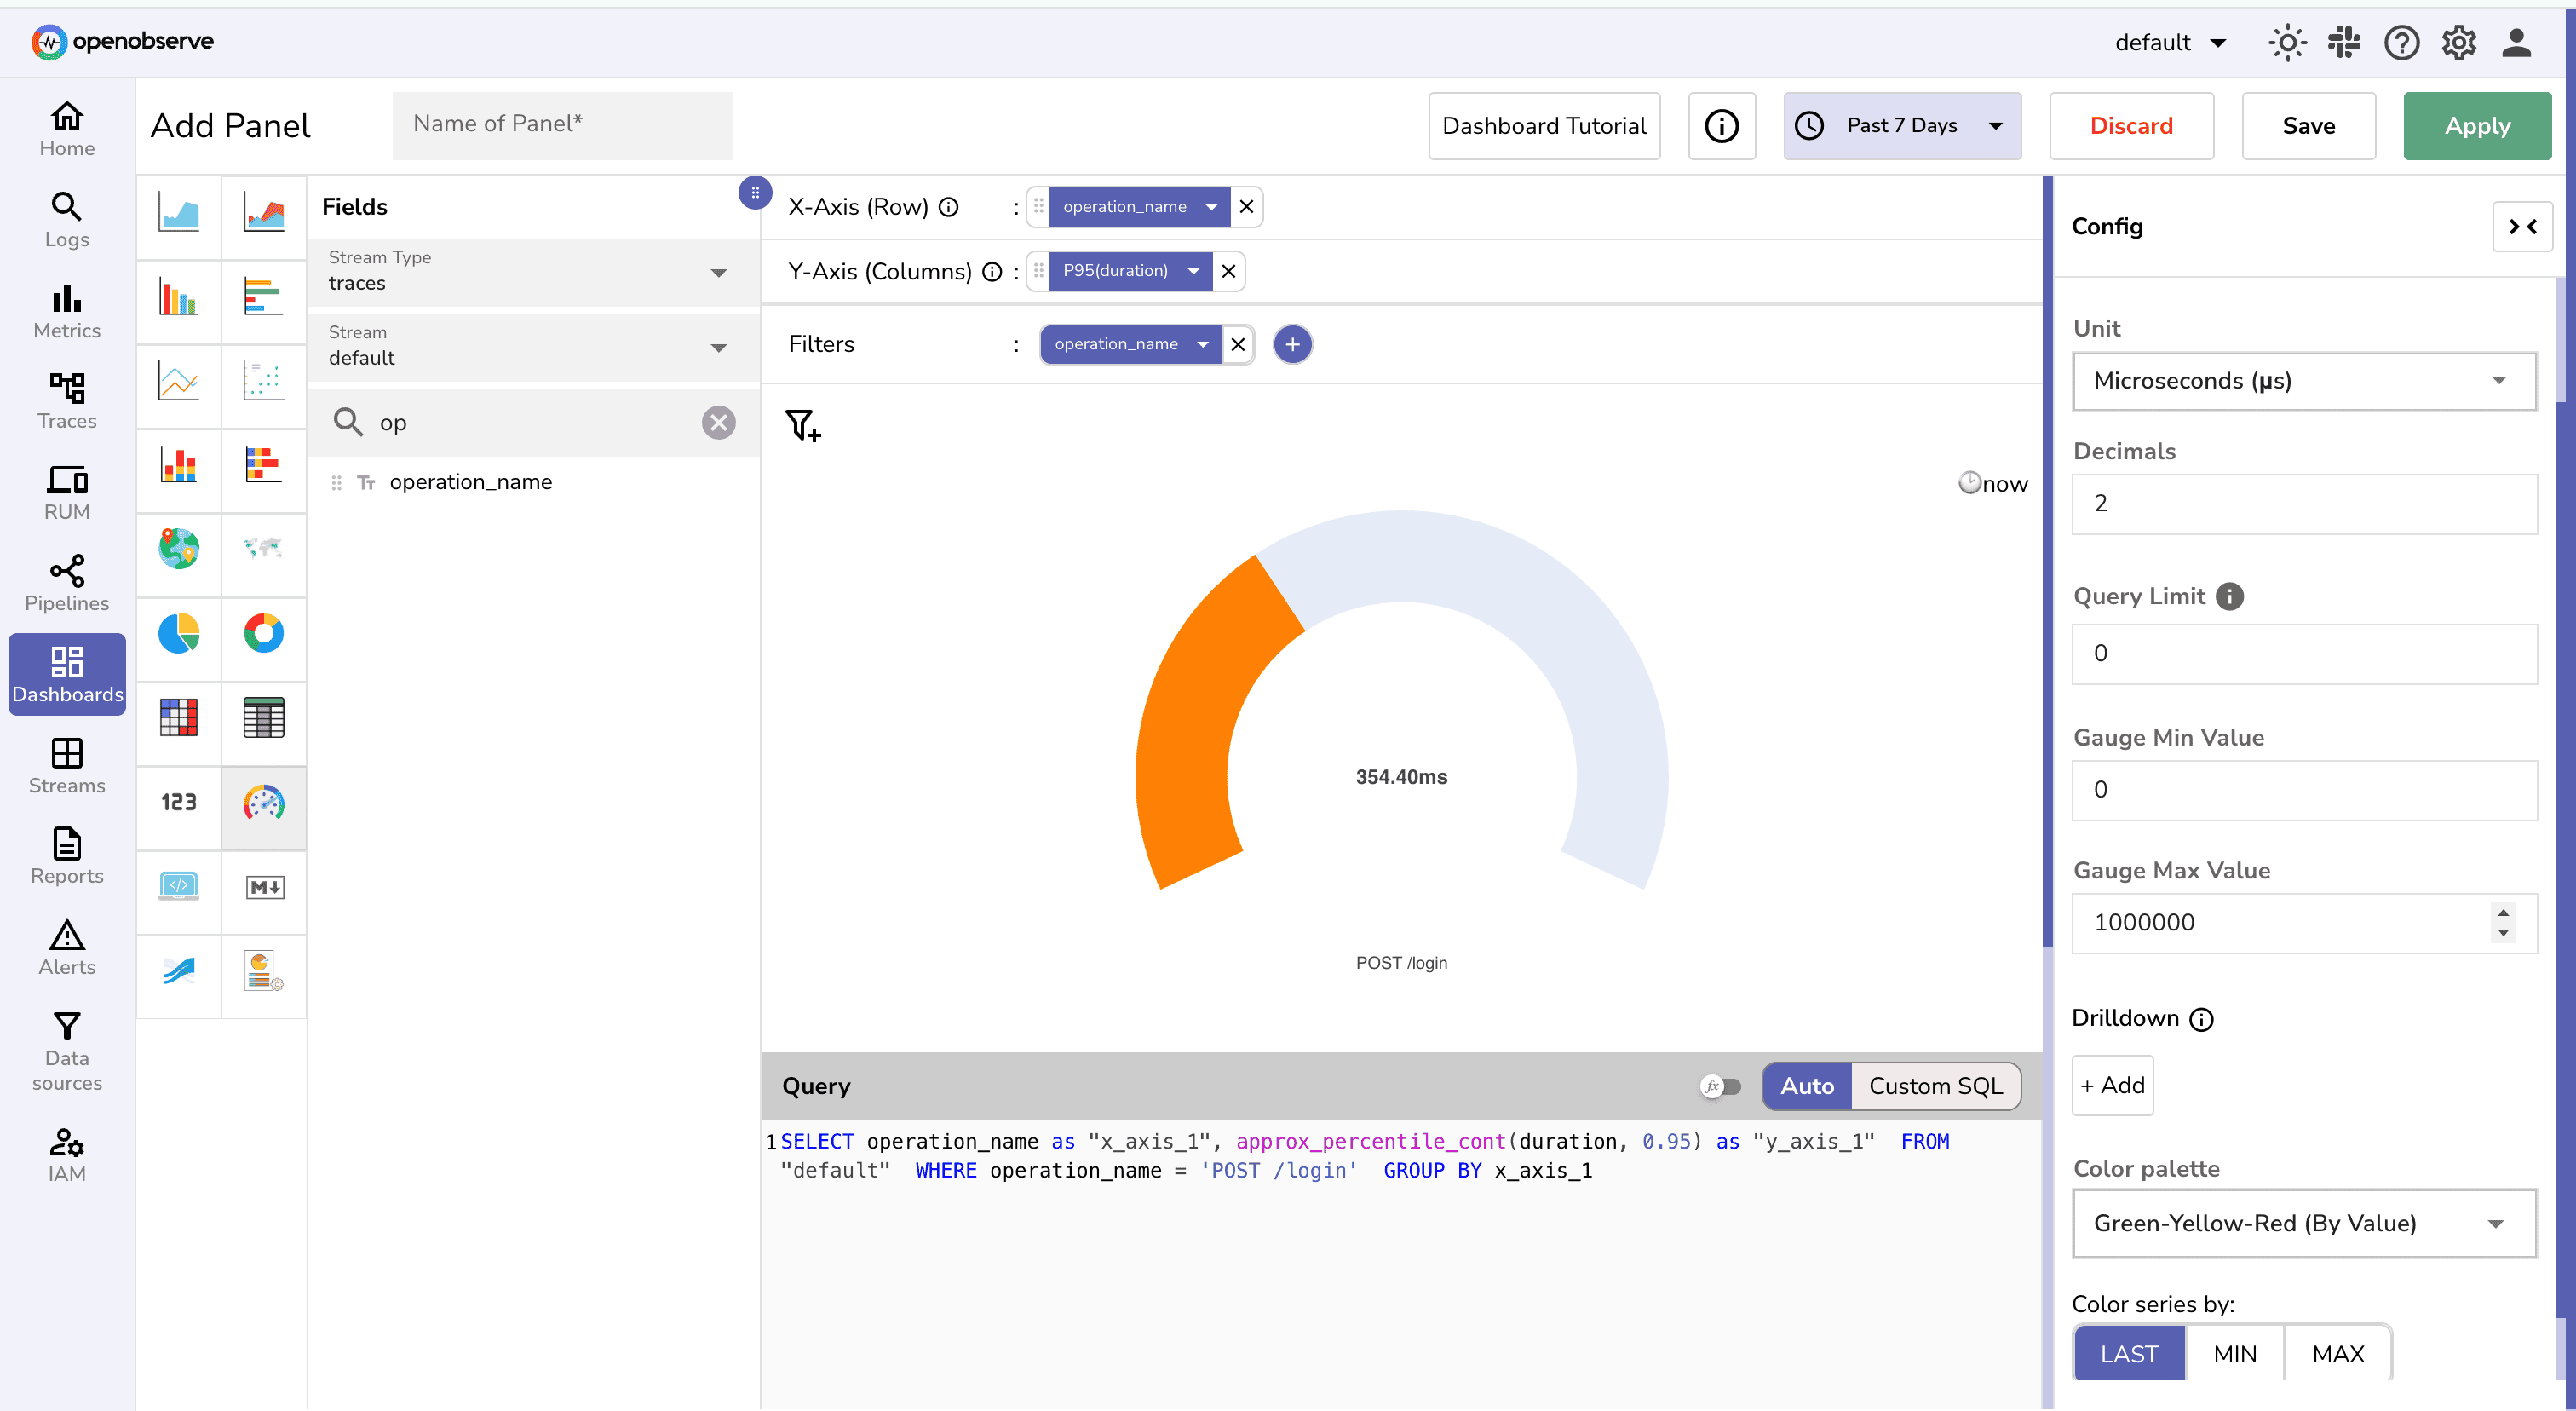
### Panel 3: Current SLO Compliance
Create a gauge chart which shows real-time compliance with the latency SLO to quickly identify if the service is meeting performance targets.
- Select Chart type -> Gauge Chart
- Select stream type and stream name.
- Filter based on operation name, and status code.
Your final dashboard may look something like this:
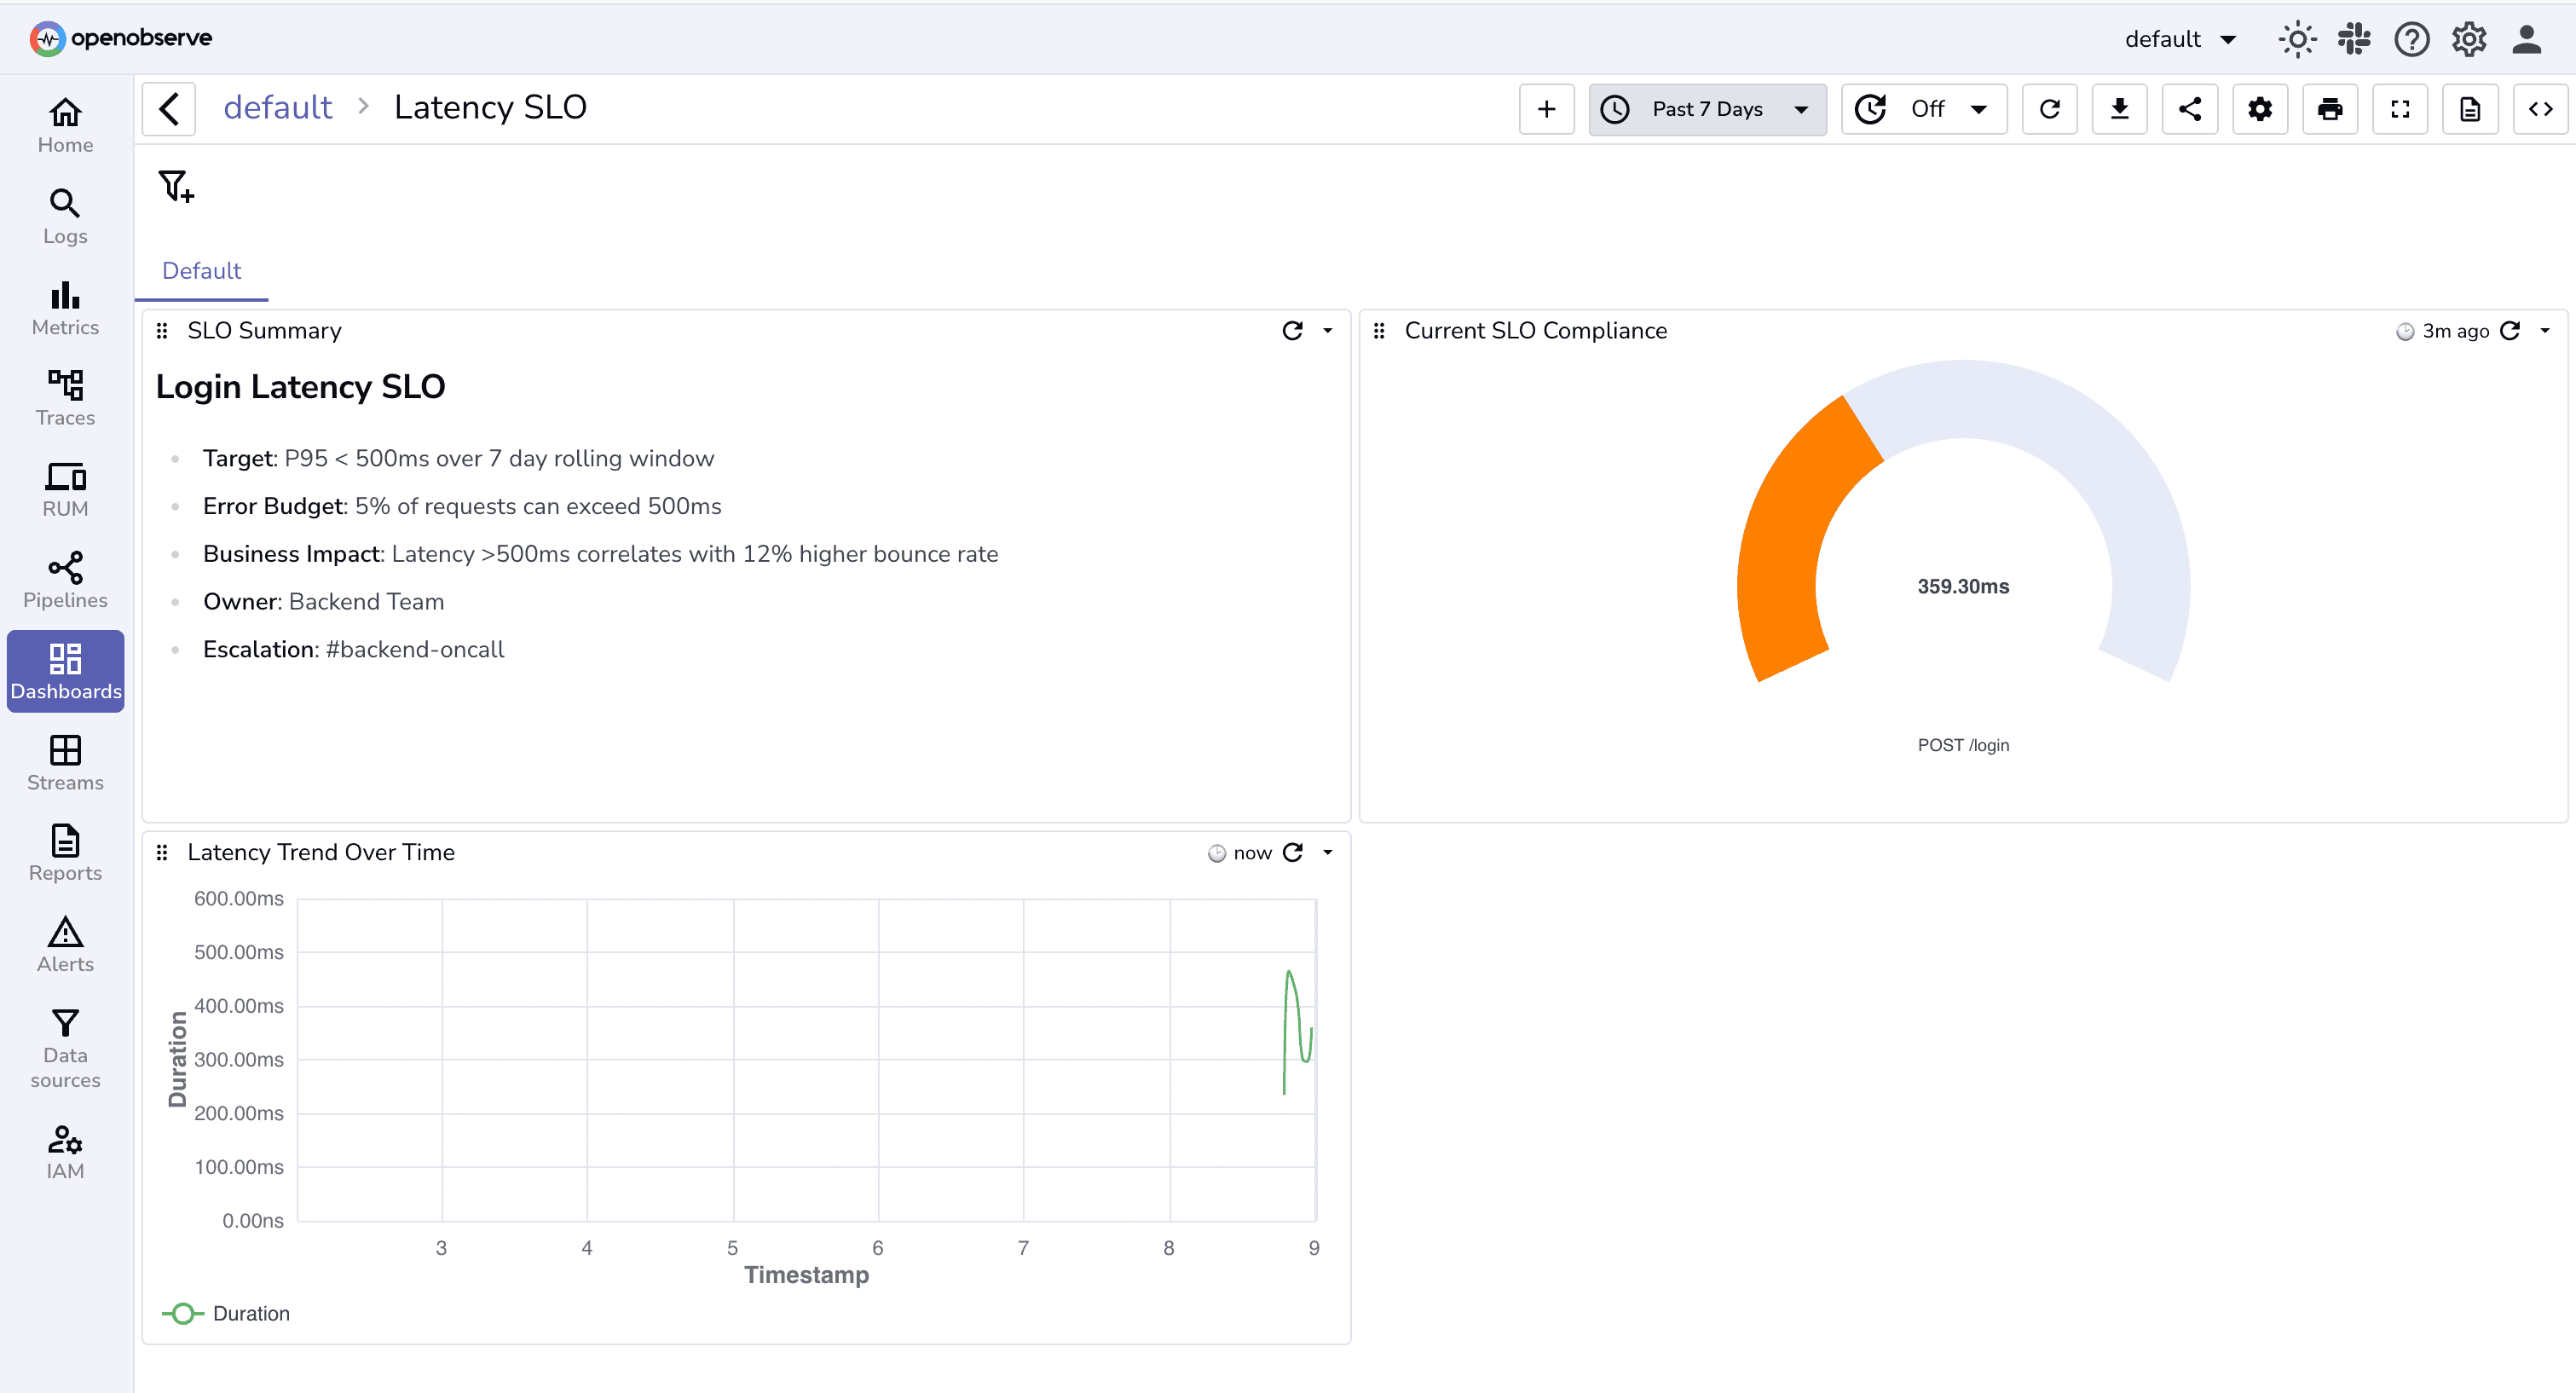
You can add more panels and charts based on your needs.
Use Dashboard settings to update the default duration as 7-days to avoid manual changes every-time you visit the dashboard:
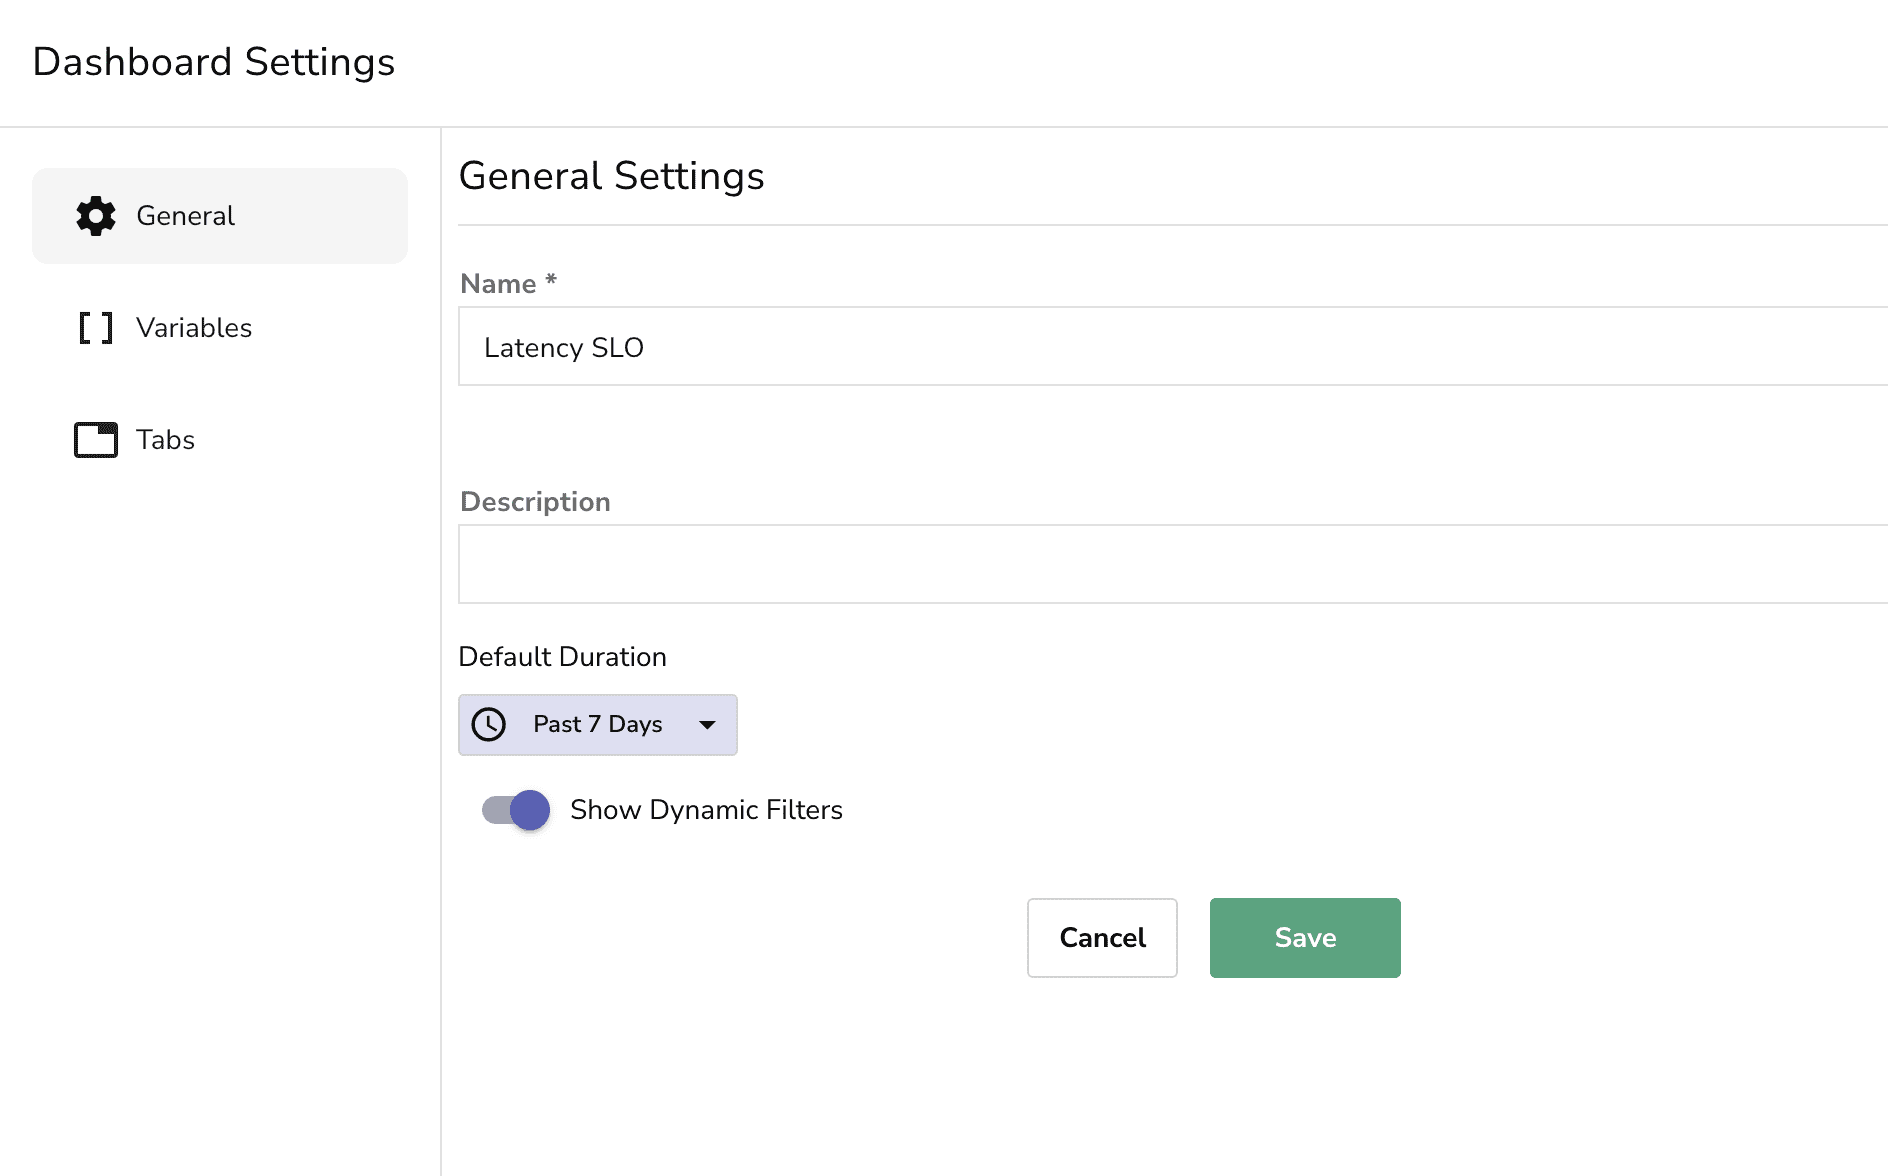
**Pro tip**: Set dashboard to auto-refresh every 5 minutes so it stays current.
So far, the dashboard tells you _what's happening_, but someone still has to look at it. That doesn't scale.
To truly **defend your SLO**, you need to:
- Detect when latency is **violating** your target
- Get notified **before** it impacts users or burns through your error budget
## **Step 4: Create SLO Alerts**
Alerts turn SLO breaches into immediate signals , so your team can act before SLAs (Service Level Agreements) or user experience are impacted.
Setting SLO Breach Alert
1. Navigate to **OpenObserve → Alerts → Add Alert**
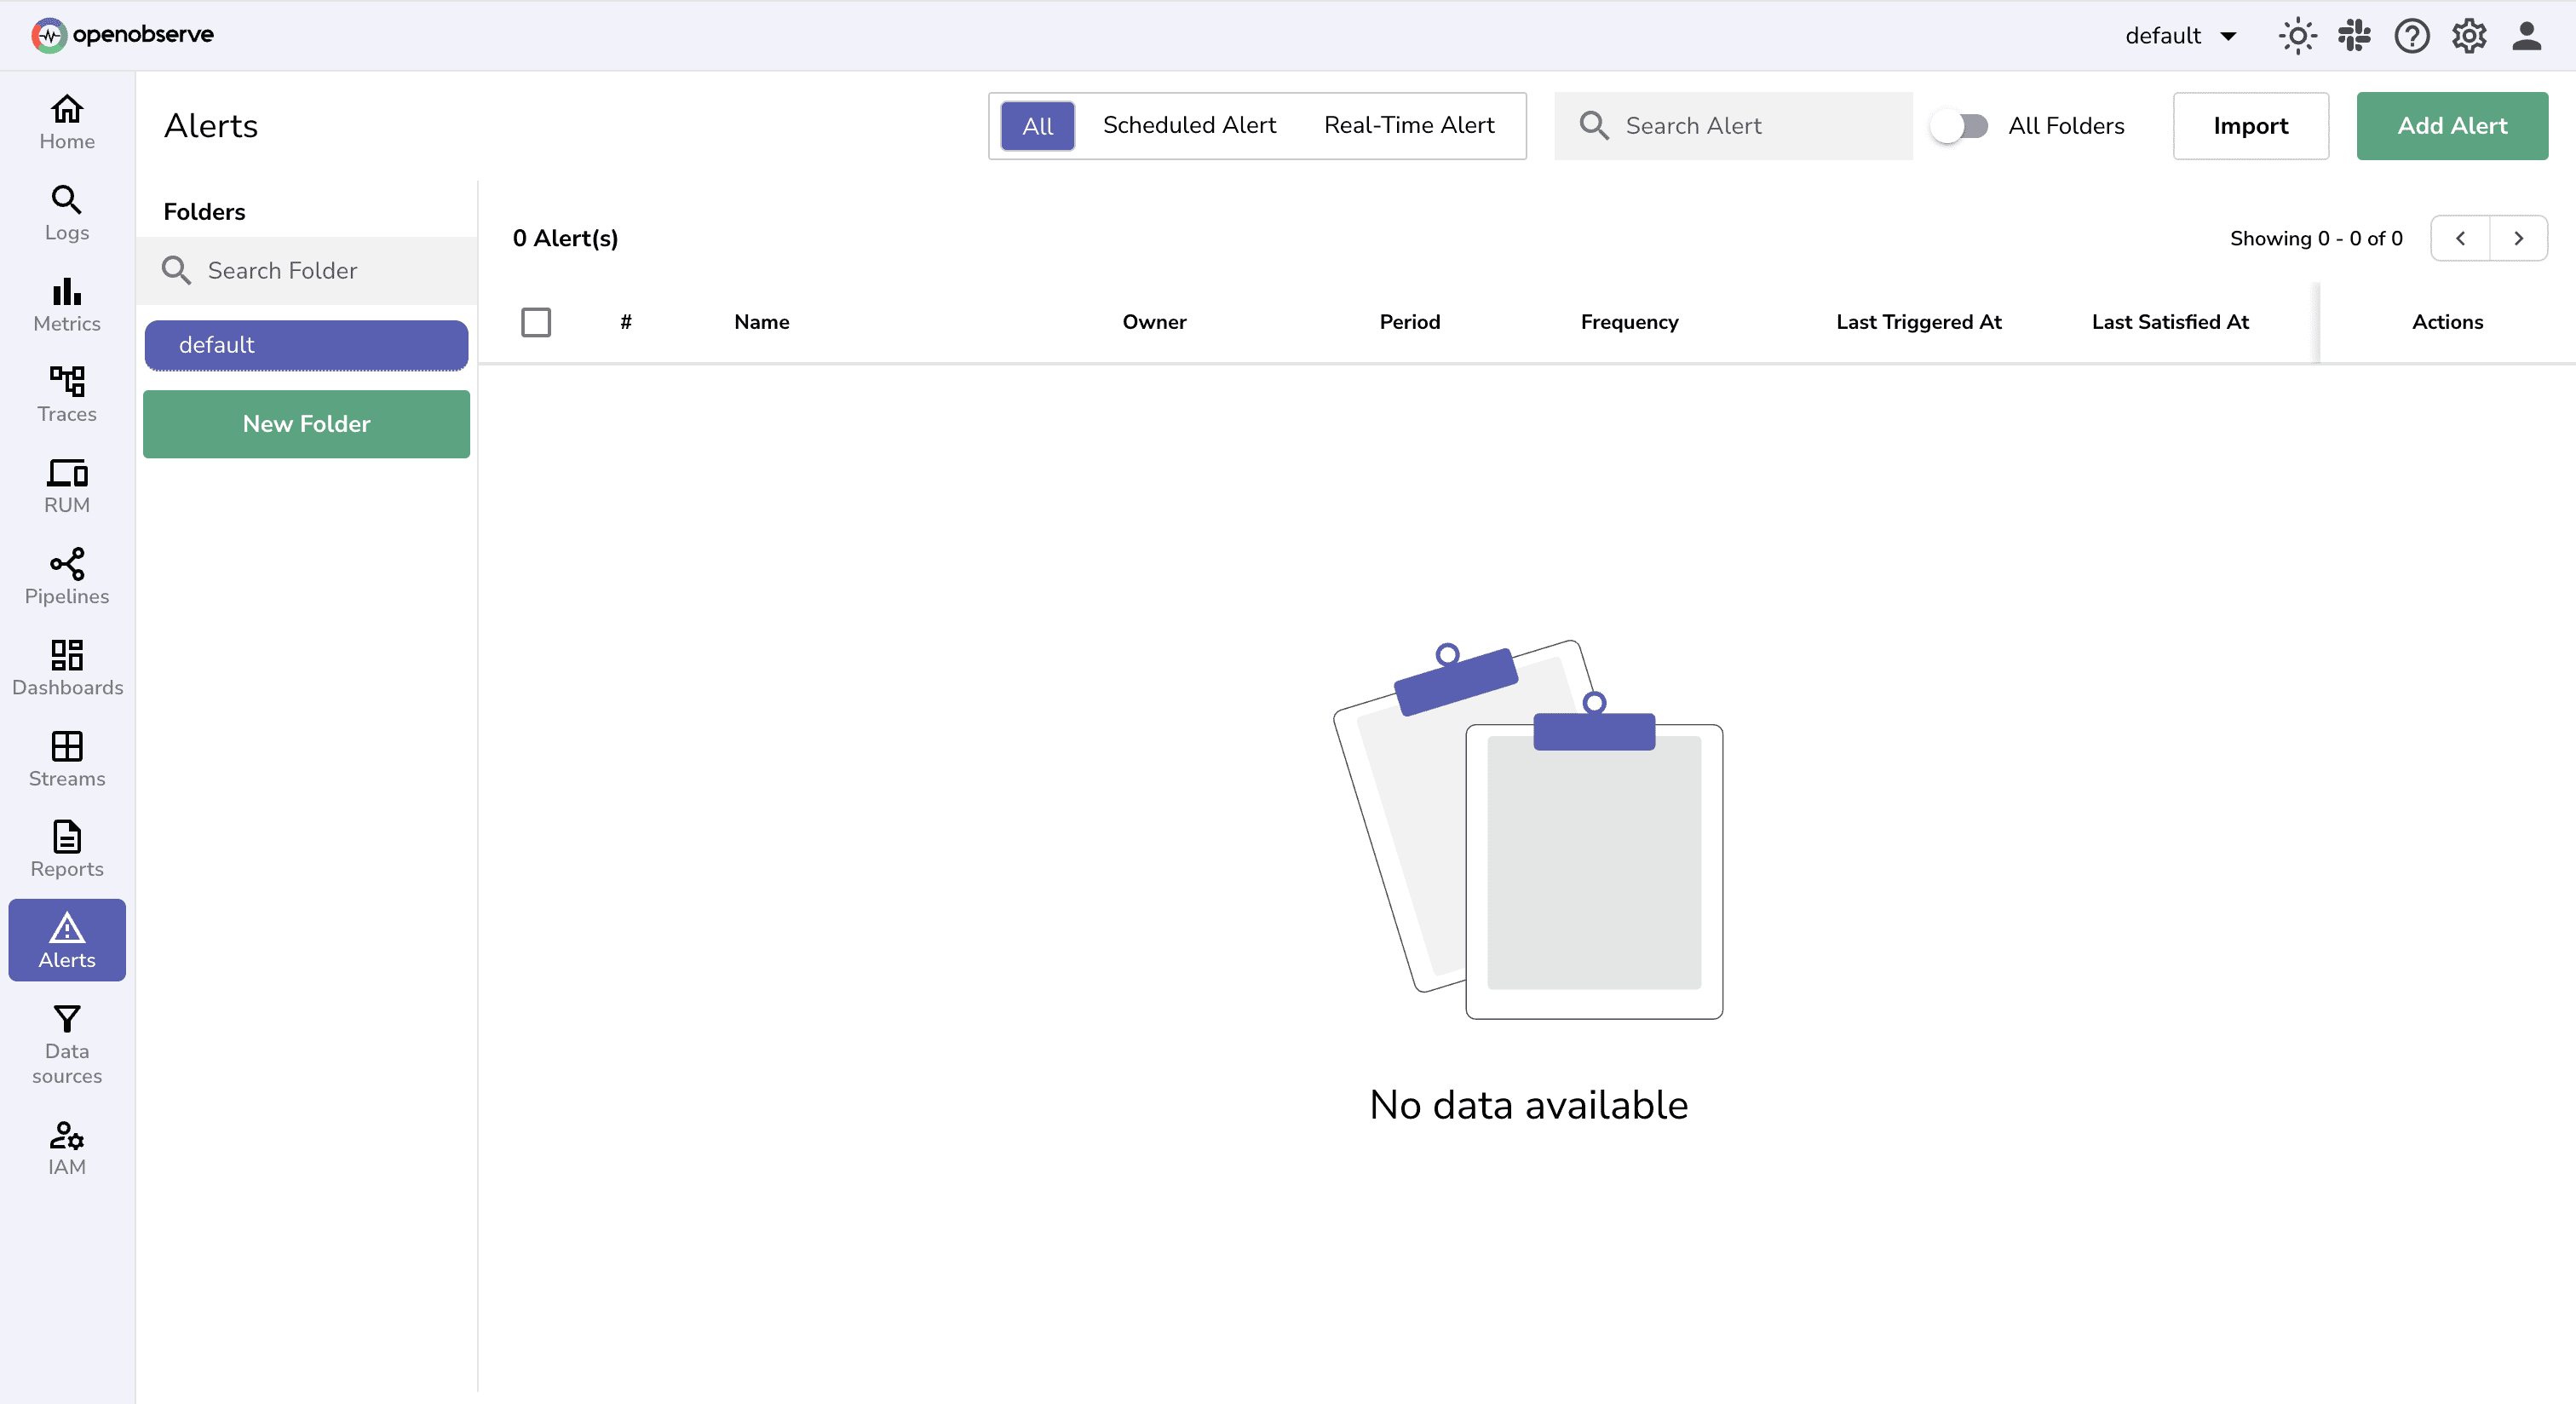
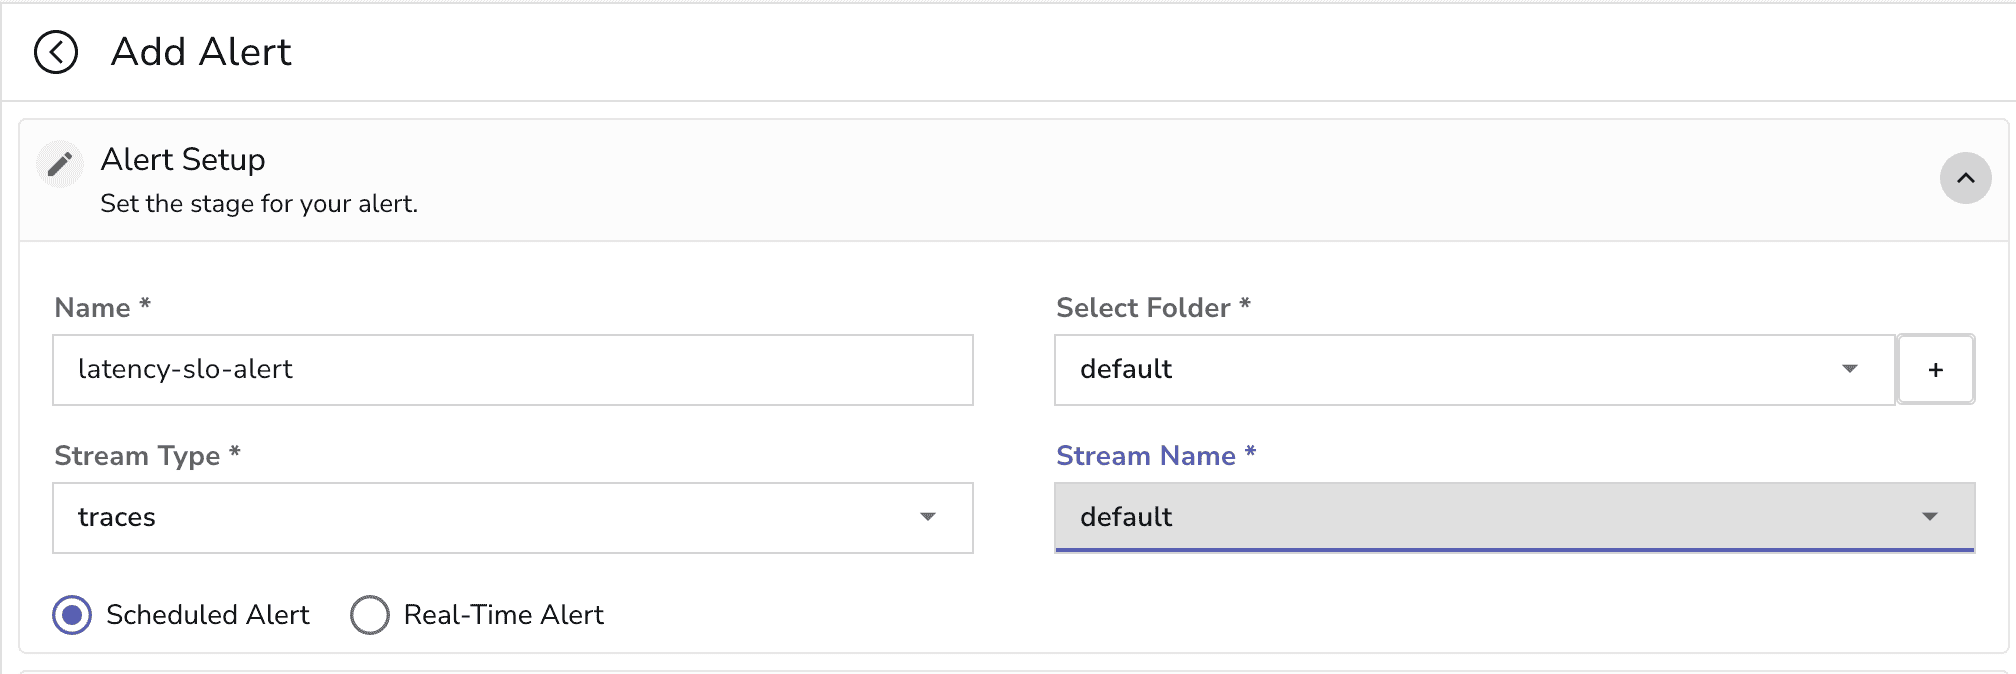
2. Fill in Alert-Setup details:
- Give the alert a meaningful name
- Choose stream type and Select corresponding stream from the dropdown
- Set alert type to **Scheduled Alert**, since we want to evaluate data aggregated over a 1 hr window instead of triggering alerts in real-time
3. Configure alert Settings. Select the corresponding destination where you want to receive the alert notification.
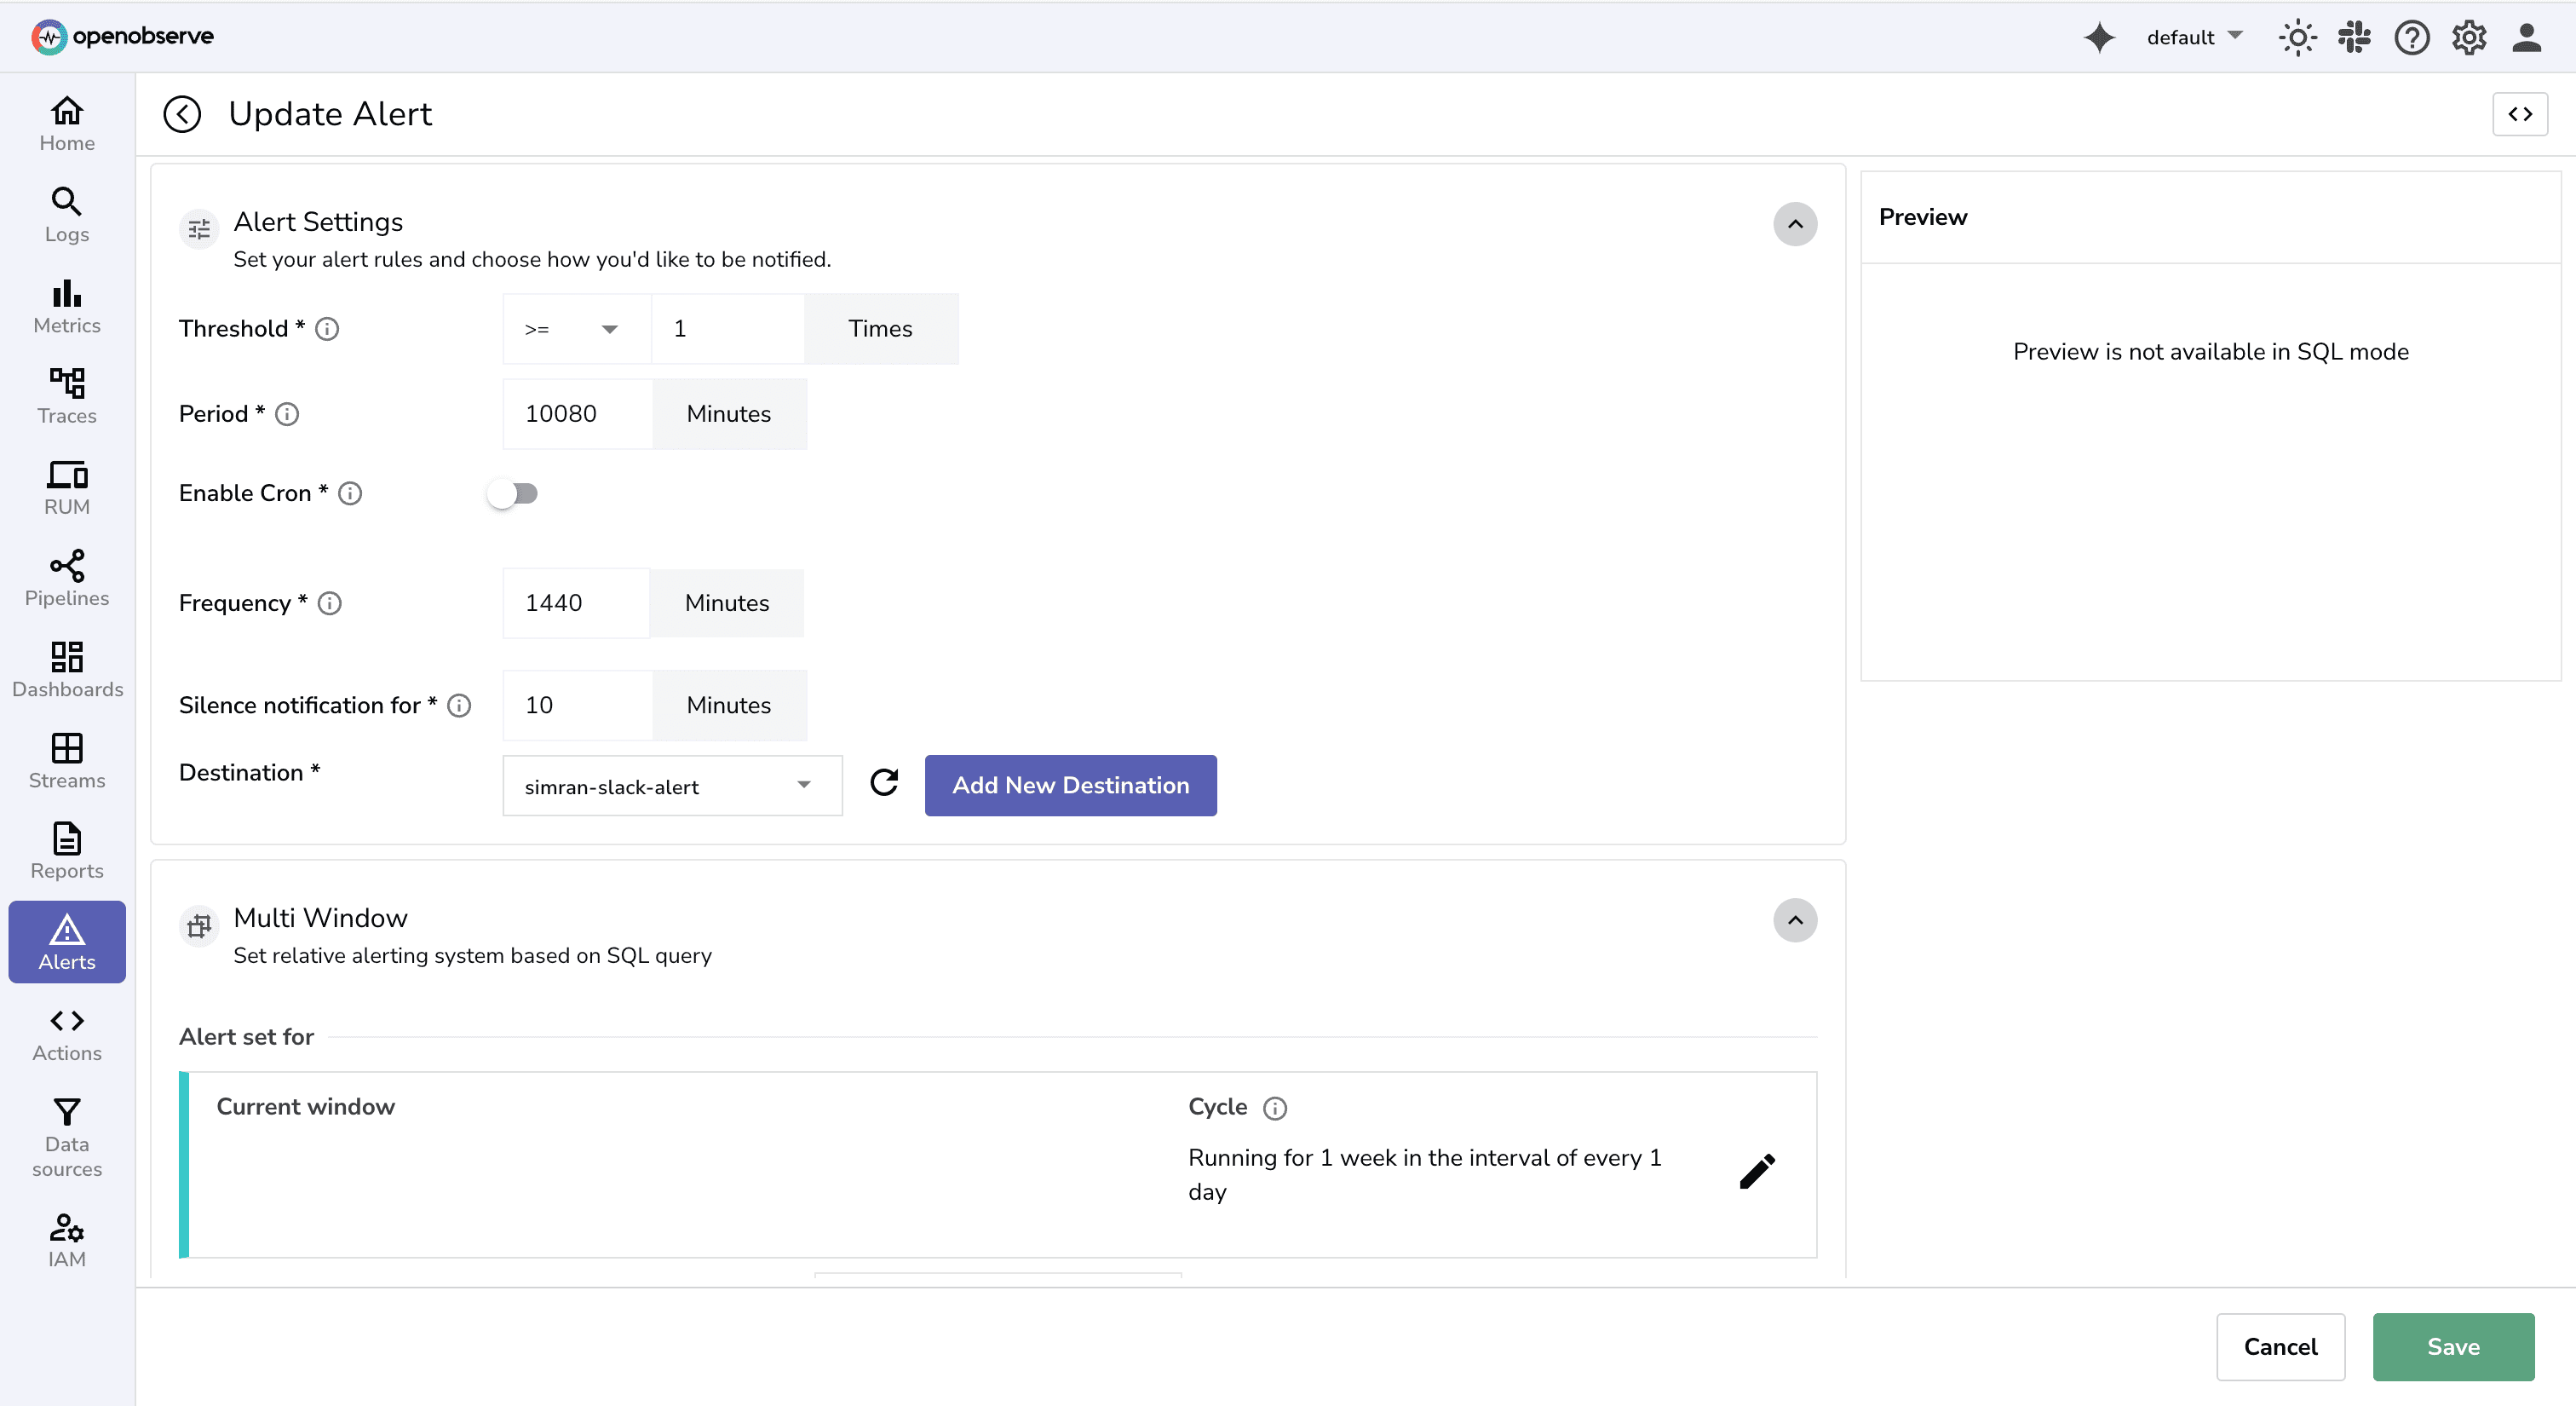
The [Alerts in OpenObserve](https://openobserve.ai/docs/user-guide/analytics/alerts/#concepts) documentation provides details around Alerts parameters. Or you can click on the `i` icon for summary details.

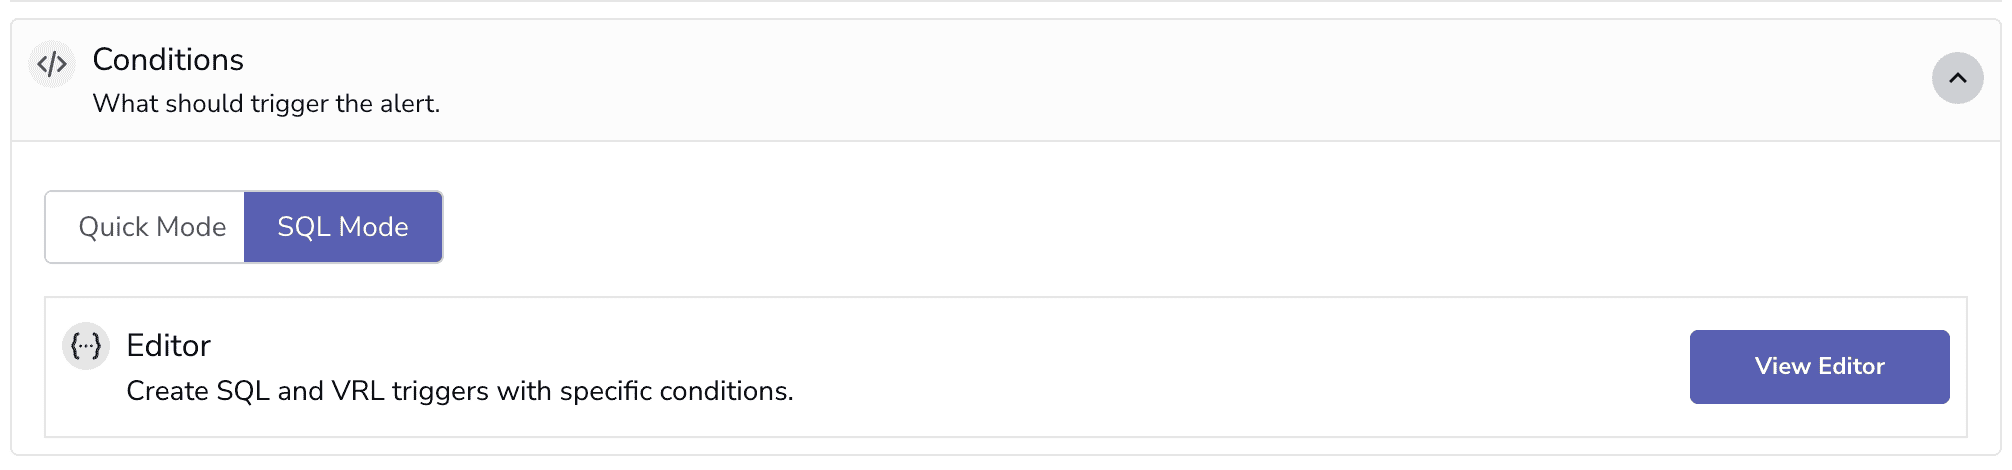
4. Next, we need to set conditions for alert.
- Select **SQL-Mode** under the **Conditions** section on the Alerts page
- Click on **View Editor** to open the SQL query editor for defining alert conditions
- Paste the Query
```
SELECT
service_name,
APPROX_PERCENTILE_CONT(response_time_ms, 0.95) AS p95_latency_ms
FROM
WHERE
service_name = 'auth-service'
AND operation_name= 'POST /login'
AND status_code < 400
GROUP BY service
```
This query checks if the 95th percentile latency for the `/login` endpoint in the `auth-service` is exceeding the SLO threshold of 500 ms. (In case the duration is micro seconds don’t forget the conversion)
- `HAVING p95_latency_ms > 500`: triggers logic only when the SLO is violated ,making it perfect for alerting.
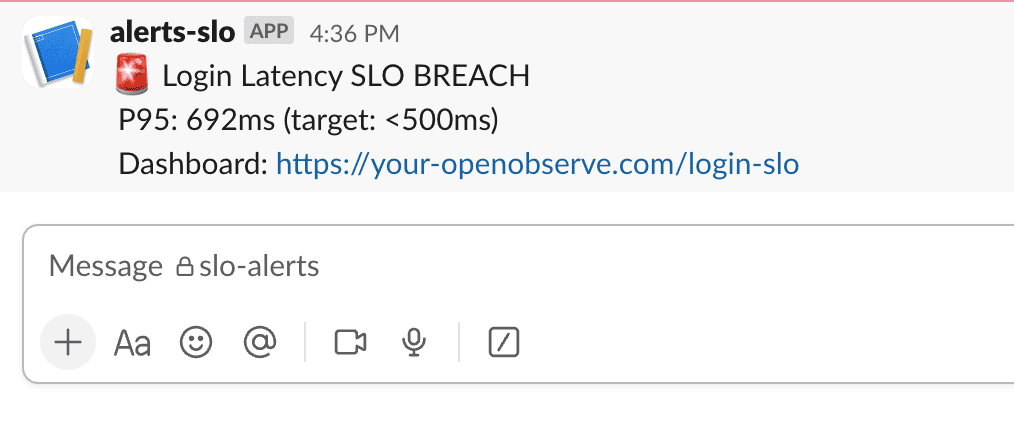
You can set the Message Template as :
```
🚨 Login Latency SLO BREACH
P95: {p95_latency_ms}ms (target: <500ms)
Dashboard: https://your-openobserve.com/login-slo
```
**_Note_:** While threshold-based alerts (like p95 latency > 500ms) work well, teams aiming for more resilient and user-centric alerting often use **burn rate alerts**. Burn rate is the speed at which you're consuming your SLO's error budget and alerts can be tuned for fast vs slow incidents.
For a deeper understanding, see Google's Site Reliability Workbook (Chapter 6: Alerting on SLOs)
## **Step 5: Debug SLO Violations**
Once an alert fires, you need to figure out _why_.
Focus on these four angles:
- **Impact Scope** : Is it a tail latency issue (only p95 is bad) or widespread (p50 is also slow)?
- **Who’s Affected** : Are certain users, regions, or clients consistently slower?
- **When It Started** : Use time charts to find exactly when latency spiked.
- **Likely Cause** : Correlate with logs or upstream errors to narrow down root causes.
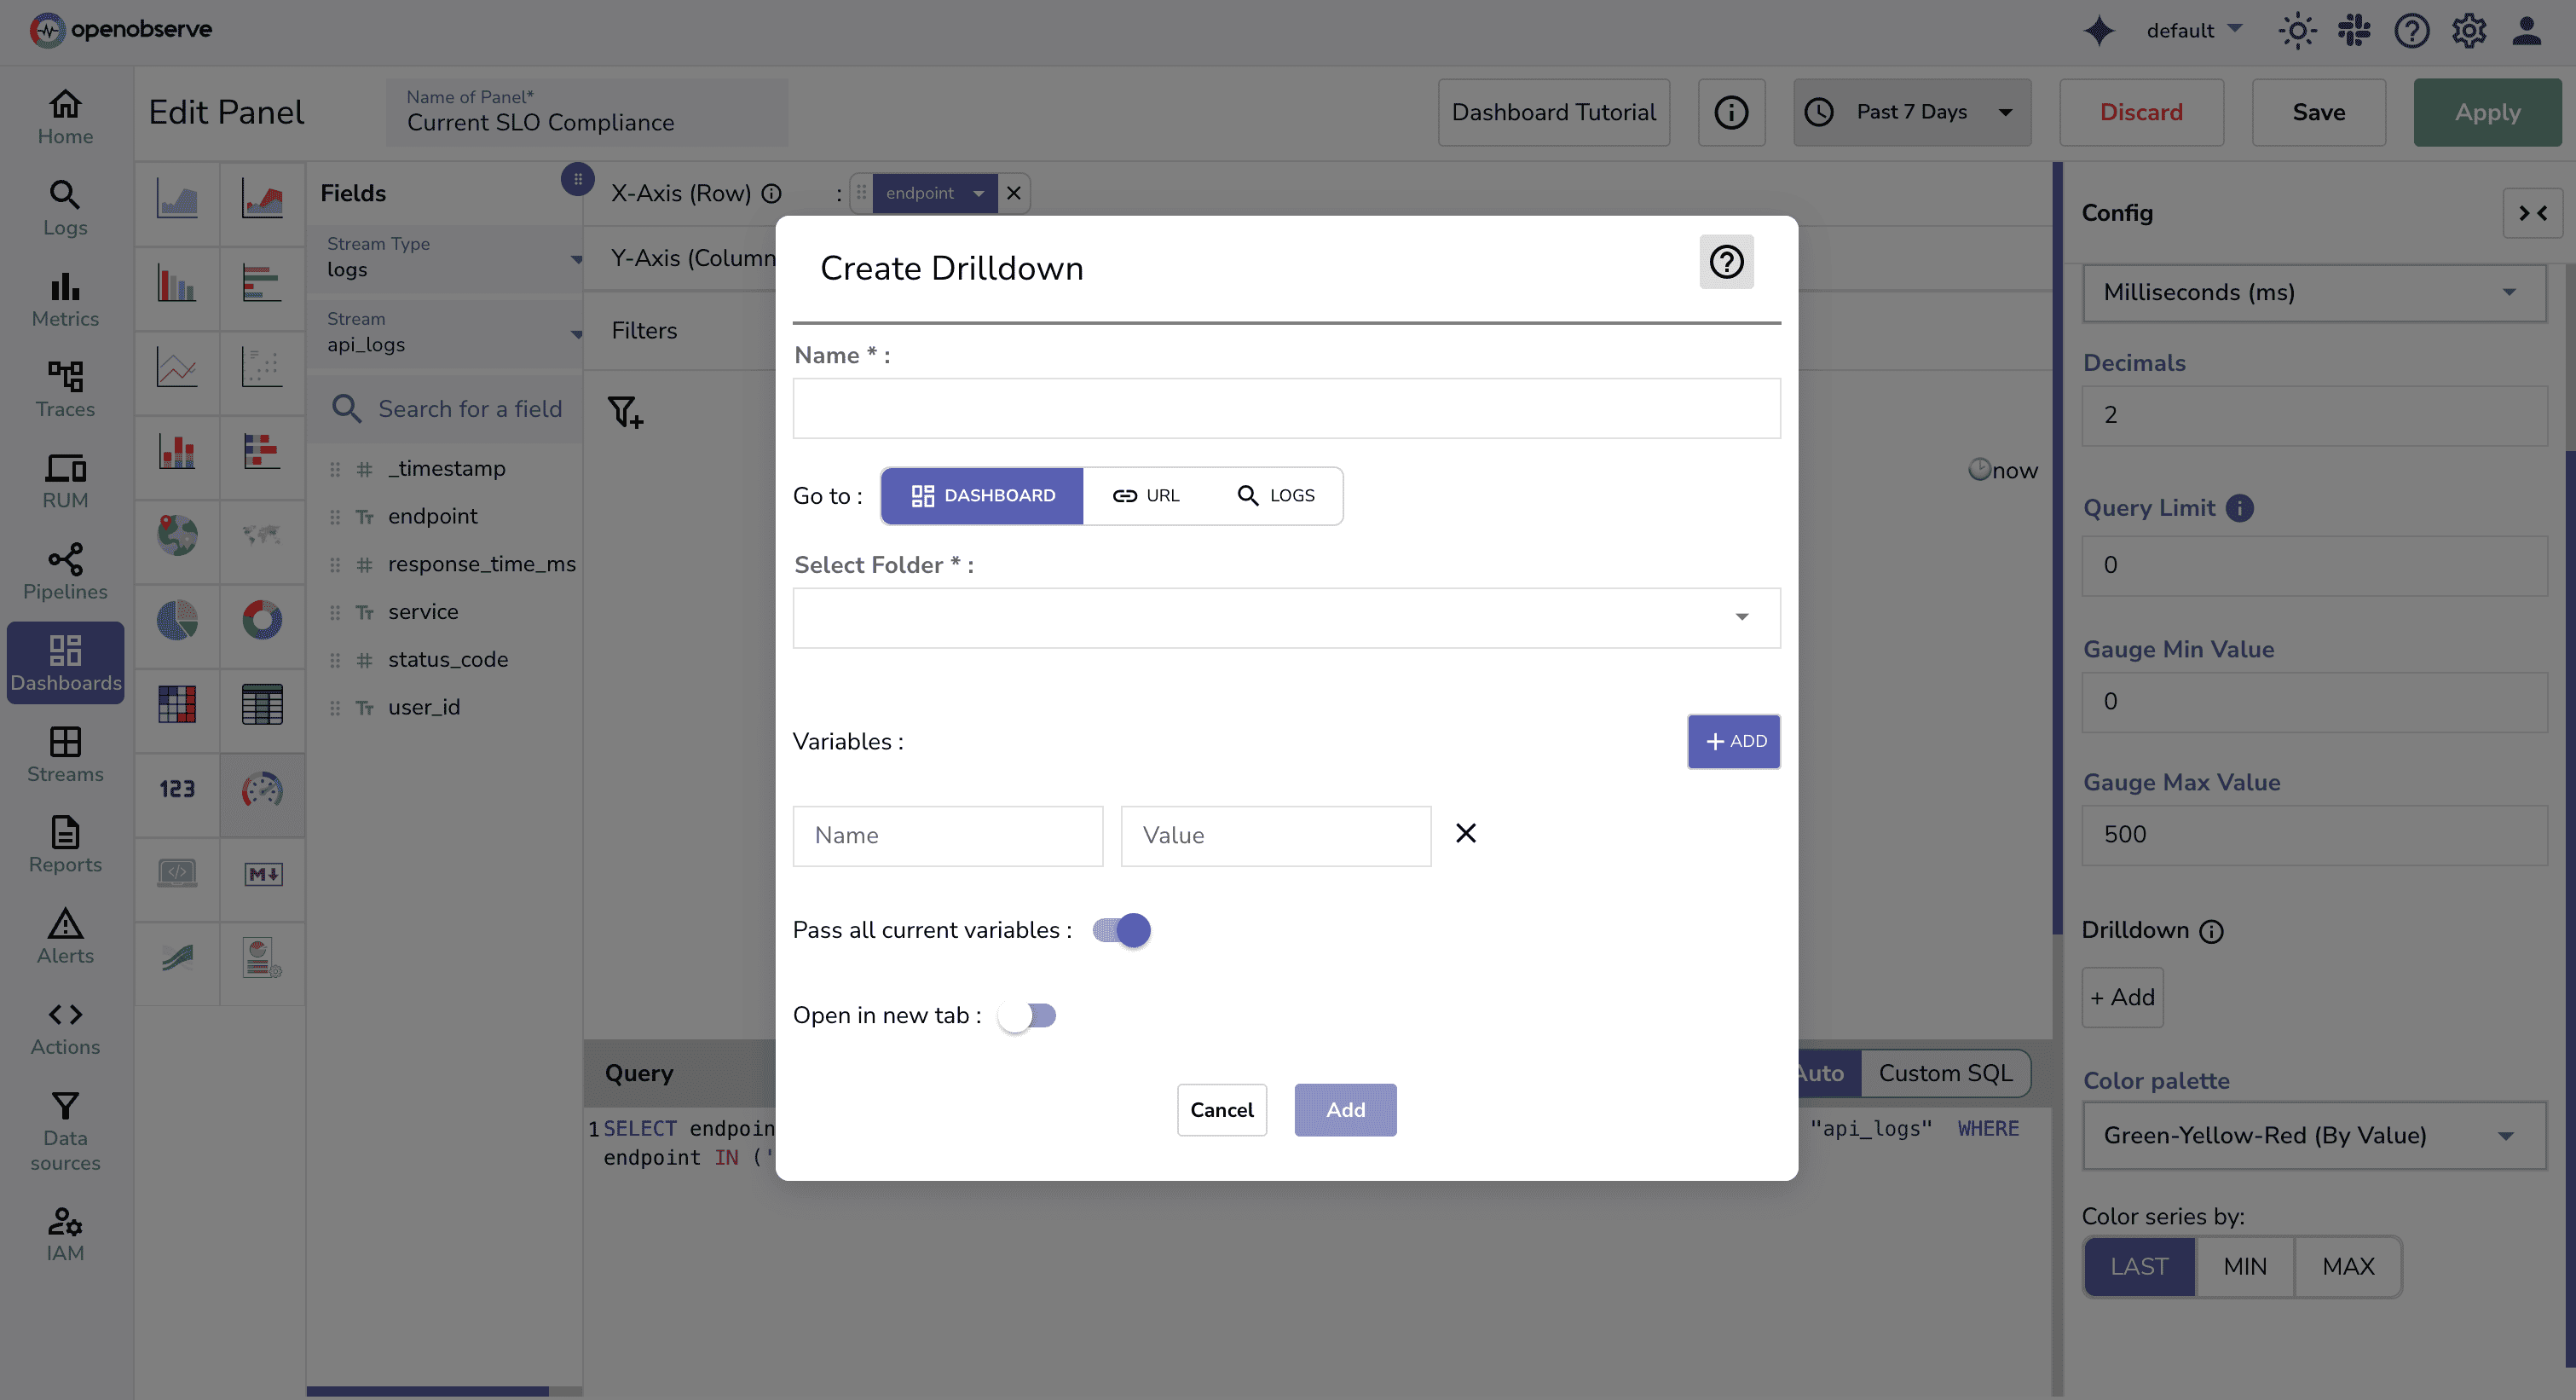
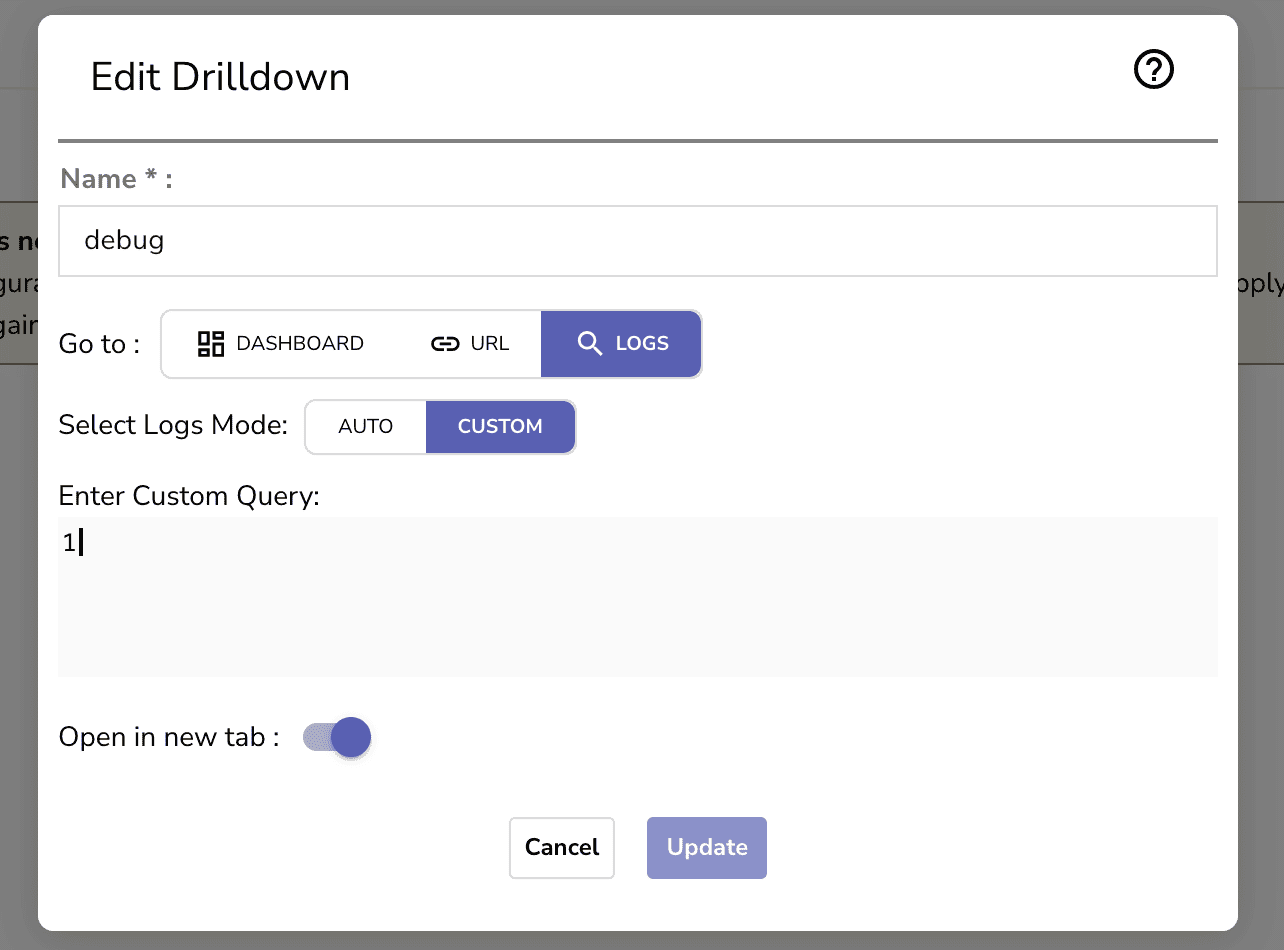
_**Pro tip**_: Use drilldown to link to dashboards/logs for quick triage when an alert hits.
## **Takeaways**
SLOs aren’t just theory, they’re your best defense against alert fatigue.
By focusing on what users actually care about, and combining that with OpenObserve’s SQL-powered alerting, you can:
- Cut down on noisy, one-off threshold alerts
- Surface only the issues that threaten real reliability
- Empower devs and SREs to share one clear standard of "good enough"
- Start small, and scale your SLO coverage as your systems grow
OpenObserve gives you the flexibility to express these goals in code and turn them into actionable alerts.
> #### Get Started with OpenObserve Today!
>
> Sign up for a [14 day cloud trial](https://cloud.openobserve.ai).
> Check out our GitHub repository for self-hosting and contribution opportunities.