# 15 Essential SRE Tools in 2026: Monitoring, Alerting, Tracing & Incident Response
> A practical guide to 15 essential SRE tools in 2026: OpenObserve, Datadog, PagerDuty, Prometheus, Jaeger, and LitmusChaos. Covers unified observability, alerting, incident management, SLO tracking, and chaos engineering.
Source: https://openobserve.ai/blog/sre-tools/
Published: 2026-07-07
Authors: Simran Kumari
Category: Engineering
Tags: Comparisons, Observability, Monitoring, Tracing, OpenTelemetry, DevOps, Cost
---
## TL;DR
OpenObserve is the best SRE observability platform in 2026 for teams that need unified monitoring, tracing, and alerting without managing multiple tools. Its O2 AI SRE Agent automates root cause analysis, and the Insights feature surfaces incident dimensions in under 60 seconds, reducing mean time to resolution for on-call engineers.
- **Best unified SRE observability platform**: OpenObserve: logs, metrics, traces, and RUM in one platform with AI-assisted root cause analysis
- **Best for reducing MTTR**: OpenObserve: O2 AI SRE Agent and Insights feature surface anomaly causes in under 60 seconds
- **Best for cost-efficient SRE monitoring**: OpenObserve: object storage backend at $0.50/GB with no per-host or per-metric fees
- **Best for OpenTelemetry-native SRE stacks**: OpenObserve: OTel-native with no proprietary agents; integrates with any collector
- **Best for on-call alert routing**: OpenObserve: native alerting integrates with PagerDuty, Slack, Opsgenie, and ServiceNow
- **Best for replacing fragmented SRE toolchains**: OpenObserve: replaces Prometheus, Grafana, Loki, Tempo, and Jaeger with one deployment
[Try OpenObserve free →](https://cloud.openobserve.ai/)
---
## **Why Your SRE Toolchain Matters in 2026**
Site Reliability Engineering has undergone a quiet revolution. The move to distributed, cloud-native systems has made "just throwing more monitoring at it" a losing strategy. In 2026, the average engineering org manages dozens of microservices, multiple cloud providers, and a flood of telemetry that would have been unimaginable five years ago.
The problem is no longer *having* data, it's having **too much of it**, fragmented across too many tools. On-call engineers jump between five dashboards to correlate a single incident. Alert fatigue is epidemic. And observability bills have quietly become one of the largest line items in infrastructure budgets.
This guide covers the 15 tools that matter most, organized by category, with honest takes on pricing, integration complexity, and who each tool is actually for. If you're new to the underlying concept these tools all serve, see [What Is Observability? The Complete Guide](https://openobserve.ai/blog/what-is-observability/).
## **Category Overview**
| Category | Tools Covered |
| ----- | ----- |
| Unified Observability | OpenObserve, [Datadog](/datadog-alternative/), Grafana |
| Distributed Tracing | Jaeger, Grafana Tempo, OpenTelemetry |
| Log Management | Elasticsearch/OpenSearch, Loki |
| Alerting & On-Call | PagerDuty, Prometheus Alertmanager |
| Incident Management | incident.io, FireHydrant |
| SLO Tracking | Nobl9 |
| Chaos Engineering | Chaos Monkey/Toolkit, LitmusChaos |
## **The Tools**
## **Observability Platforms**
### **1\. OpenObserve All-in-One Observability Layer**
**Website:** [openobserve.ai](https://openobserve.ai/) **GitHub:** github.com/openobserve/openobserve **License:** AGPL-3.0 (self-host) | [SaaS (cloud)](https://cloud.openobserve.ai/)
#### **What It Does**
OpenObserve is a petabyte-scale, full-stack observability platform built to replace the fragmented "Prometheus \+ Loki \+ Tempo \+ Grafana" stack with a single, unified system. It ingests **logs, metrics, traces, and frontend RUM data** all into one storage layer making cross-signal correlation automatic rather than manual.
Built in Rust, it uses Vertex and object storage (S3, GCS, Azure Blob) under the hood, which is how it achieves approximately 140× lower storage costs in typical log workloads compared to Elasticsearch-based stacks (actual results vary based on data entropy and cardinality) while still supporting petabyte-scale retention. There's no per-host pricing, no OTel penalties, and no surprise bills, just usage-based ingestion at **$0.50/GB**.
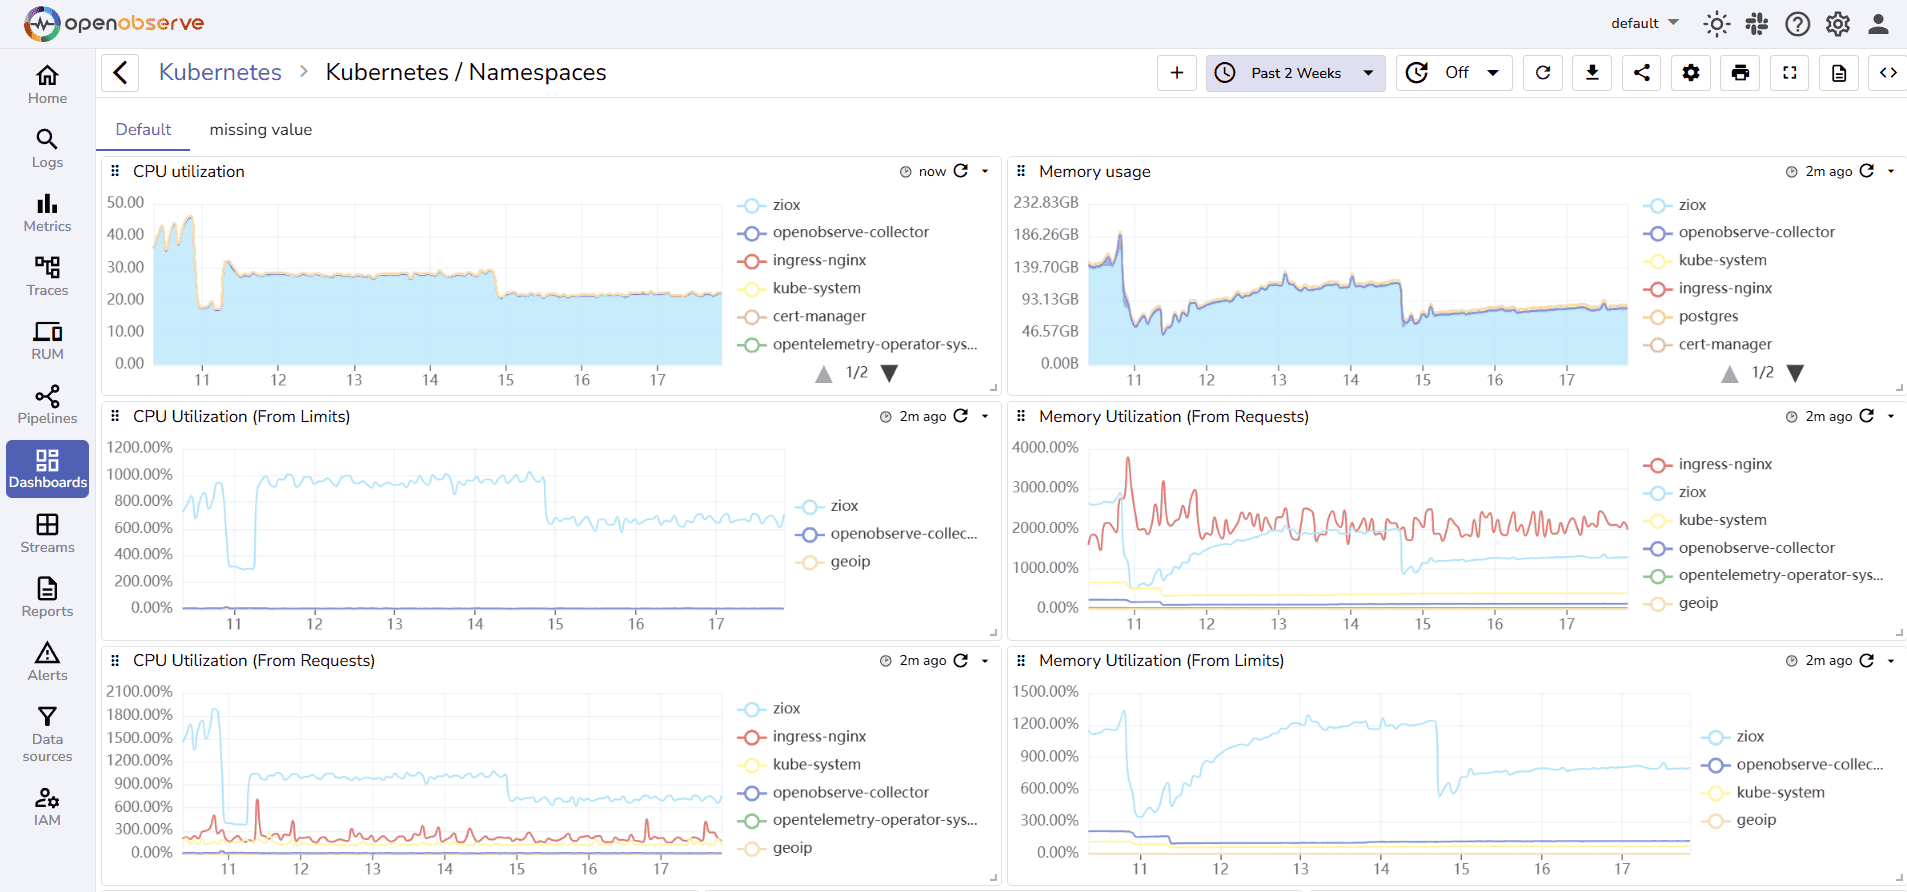
Key capabilities:
* **Unified logs, metrics, traces, and RUM** in a single UI
* **SQL \+ PromQL** querying no need to learn LogQL, TraceQL, and PromQL separately
* **Real-time alerting pipelines** with webhook destinations (PagerDuty, Slack, ServiceNow, Opsgenie)
* **O2 AI SRE Agent** an always-on assistant that automates root cause analysis across your full telemetry
* **Insights feature** automated dimension analysis that surfaces why an incident happened in under 60 seconds
* **RBAC, SSO, OAuth, multi-tenancy** enterprise-ready out of the box
* **OpenTelemetry-native** no proprietary agents or lock-in
**Deep Dive:** [Full-Stack Observability: Connecting Logs, Metrics, and Traces](https://openobserve.ai/blog/full-stack-observability-logs-metrics-traces/) how OpenObserve unifies your telemetry signals into a single investigation workflow.
**Related:** [Top 10 Open Source Observability Tools in 2026](https://openobserve.ai/blog/top-10-open-source-observability-tools/) vendor-neutral comparison including OpenObserve, Grafana, Jaeger, and more.
#### **Who It's For**
OpenObserve is ideal for:
* **Teams drowning in toolchain complexity** replacing 4–6 point solutions with one platform
* **Cost-conscious engineering orgs** hitting Datadog or Splunk pricing ceilings
* **Kubernetes-native teams** running distributed microservices at scale
* **Startups and scale-ups** who want enterprise observability without enterprise contracts
[Kubernetes Monitoring Tools: Top 10 Guide for 2026](https://openobserve.ai/blog/top-10-k8s-monitoring-tools/) includes OpenObserve's native K8s monitoring capabilities.
#### **Pricing**
| Tier | Cost |
| ----- | ----- |
| Self-hosted (OSS) | Free |
| Cloud | $0.50/GB ingested (logs, metrics, traces) |
| Queries | Additional per-query charges |
| RUM & Error Tracking | Add-on pricing |
| Enterprise | Custom |
14-day free trial on Cloud (no credit card required). Available on the AWS Marketplace for consolidated billing.
#### **Integration Complexity**
**Low.** OpenObserve accepts data from FluentBit, Fluentd, Logstash, OpenTelemetry Collector, Prometheus, Jaeger, and Zipkin meaning you can plug it into an existing stack without re-instrumentation. The single API handles ingest, search, alerting, and dashboards.
- **How to build SRE dashboards:** [Observability Dashboards: How to Build Them and What to Show](https://openobserve.ai/blog/observability-dashboards/)
- **Reduce MTTR:** [Faster MTTD & MTTR: Cut Alert Fatigue with OpenObserve](https://openobserve.ai/blog/reduce-mttd-mttr-openobserve-alert-correlation/)
- **Root cause in under 60 seconds:** [OpenObserve Insights: Find Root Cause, Get first insight in Under 5 Minutes](https://openobserve.ai/blog/observability-insights-troubleshooting-guide/)
### **2\. Datadog**
**Website:** datadoghq.com **License:** Proprietary SaaS
#### **What It Does**
Datadog is the dominant commercial observability platform, commanding roughly 50%+ of the enterprise monitoring market. It provides APM, infrastructure monitoring, log management, synthetic monitoring, Real User Monitoring (RUM), security monitoring, and AI observability all under one roof with 700+ integrations.
Key capabilities:
* **APM with distributed tracing** automatic service discovery and flame graphs
* **Log Management** real-time log indexing, live tail, and correlation with traces
* **Infrastructure monitoring** host, container, and Kubernetes metrics
* **Synthetic monitoring** browser tests, API checks, and multi-step synthetic workflows
* **AI observability** LLM monitoring and AI model performance tracking
* **Watchdog** AI-driven anomaly detection and root cause suggestions
#### **Who It's For**
* Large enterprises needing a fully managed, zero-ops observability platform
* Teams that prioritize out-of-the-box integrations and a polished UI over cost
* Organizations with existing Datadog footprints expanding to new surfaces
**The Catch:** Datadog's pricing model is notoriously complex per-host charges, per-GB log indexing, custom metric taxes, and per-feature add-ons can turn a modest setup into a six-figure annual spend. Vendor lock-in is real; proprietary agents and formats make migration painful.
**Comparing alternatives:** includes [Datadog pricing](https://openobserve.ai/blog/datadog-pricing/) breakdown and [alternatives comparison](https://openobserve.ai/blog/top-10-datadog-alternative-tools/).
#### **Pricing**
| Feature | Cost |
| ----- | ----- |
| Infrastructure | $15–$23/host/month |
| Log Management | $0.10/GB ingested \+ $1.70/GB indexed |
| APM | $31/host/month |
| Custom Metrics | $0.05/metric/month (\>100 included) |
**Verdict:** Best-in-class features, worst-in-class bill predictability.
#### **Integration Complexity**
**Low (setup) / High (cost management).** Getting data in is easy. Managing costs and avoiding billing surprises requires significant operational overhead.
### **3\. Grafana Stack**
**Website:** grafana.com **License:** AGPL-3.0 (OSS) | Grafana Cloud (SaaS)
#### **What It Does**
Grafana is the world's most popular open-source visualization and dashboarding layer. The broader "Grafana Stack" combines:
* **Grafana** dashboards and visualization
* **Prometheus** metrics collection and storage
* **Loki** log aggregation (LogQL query language)
* **Tempo** distributed tracing
* **Mimir** horizontally scalable metrics storage
* **Pyroscope** continuous profiling
Together, these form a complete open-source observability platform. Grafana itself has 700+ data source plugins, making it the de facto visualization standard across the industry.
#### **Who It's For**
* Teams with strong Kubernetes/DevOps expertise wanting maximum flexibility
* Organizations already invested in the Prometheus ecosystem
* Engineering teams who want open-source freedom with optional managed cloud
* Anyone who wants beautiful, customizable dashboards
**The Catch:** Each component has its own query language (PromQL, LogQL, TraceQL). Managing five separate systems at scale requires significant operational expertise. High-cardinality log data causes real performance issues in Loki.
**Alternatives comparison:** [Top 10 Grafana Alternatives in 2026](https://openobserve.ai/blog/top-10-grafana-alternatives/) for teams evaluating unified alternatives to the multi-component Grafana stack.
#### **Pricing**
| Tier | Cost |
| ----- | ----- |
| Self-hosted (OSS) | Free (infra costs apply) |
| Grafana Cloud Free | 50GB logs, 10K metrics, 50GB traces |
| Grafana Cloud Pro | $8/month \+ usage |
| Enterprise | Custom (includes support, SSO, RBAC) |
#### **Integration Complexity**
**High.** The power comes with complexity each component must be deployed, configured, scaled, and maintained separately. Teams new to the stack face a steep learning curve across multiple query languages and operational patterns.
## **Distributed Tracing**
### **4\. Jaeger**
**Website:** jaegertracing.io **License:** Apache 2.0 (Open Source) **CNCF Status:** Graduated project
#### **What It Does**
Jaeger is the leading open-source distributed tracing system, originally built by Uber and donated to the CNCF. It collects, stores, and visualizes distributed traces allowing SRE teams to follow a request as it travels across multiple microservices and identify exactly where latency or failures originate.
Key capabilities:
* **End-to-end distributed tracing** across polyglot microservices
* **Service dependency graphs** auto-generated topology maps
* **Root cause analysis** flamegraphs and Gantt-chart trace views
* **OpenTelemetry native** accepts OTLP, Zipkin, and Jaeger formats
* **Multiple storage backends** Elasticsearch, Cassandra, Kafka, Badger
#### **Who It's For**
* Teams running microservices architectures who need deep request tracing
* Organizations adopting OpenTelemetry as their instrumentation standard
* DevOps/SRE teams troubleshooting latency in distributed systems
#### **Pricing**
Free and open source. You pay only for the infrastructure (storage backend) you run it on.
#### **Integration Complexity**
**Medium.** Deploying Jaeger itself is straightforward (Helm chart available). The real work is instrumenting your services with OpenTelemetry SDKs and choosing \+ managing a storage backend. Jaeger integrates natively with OpenObserve as a trace receiver.
### **5\. Grafana Tempo**
**Website:** grafana.com/oss/tempo **License:** AGPL-3.0
#### **What It Does**
Grafana Tempo is a high-volume, cost-efficient distributed tracing backend that stores traces in object storage (S3, GCS) rather than in an indexed database. The key differentiator: Tempo stores **100% of traces** without sampling, at dramatically lower cost than indexed solutions like Elasticsearch-backed Jaeger.
Key capabilities:
* **No-index trace storage** object storage backend, not Elasticsearch
* **100% trace retention** store every span without sampling decisions
* **TraceQL** purpose-built trace query language
* **Service graph metrics** auto-generated RED metrics from trace data
* **Native Grafana integration** jump from metrics to traces with trace exemplars
#### **Who It's For**
* Teams already invested in the Grafana ecosystem
* High-volume tracing workloads where Elasticsearch costs are prohibitive
* SREs who want to correlate traces directly from Grafana dashboards
#### **Pricing**
Free and open source. Grafana Cloud includes Tempo with managed hosting at scale.
#### **Integration Complexity**
**Medium.** Tempo requires a separate storage backend (S3/GCS) and integrates best when paired with Grafana, Loki, and Prometheus. Standalone use cases are less common.
### **6\. OpenTelemetry Collector**
**Website:** opentelemetry.io **License:** Apache 2.0 **CNCF Status:** Graduated project
#### **What It Does**
OpenTelemetry (OTel) is not a single tool but the **industry-standard observability framework** a vendor-neutral set of APIs, SDKs, and the Collector for instrumenting, generating, collecting, and exporting telemetry data (metrics, logs, and traces).
The **OTel Collector** acts as a telemetry pipeline: it receives data from your applications, processes and transforms it, and exports it to any backend Datadog, Jaeger, Tempo, OpenObserve, Prometheus, and more.
Key capabilities:
* **Vendor-agnostic** instrument once, send anywhere
* **Receivers** for virtually every telemetry format (Jaeger, Zipkin, Prometheus, StatsD, etc.)
* **Processors** for filtering, sampling, batching, and enriching telemetry
* **Exporters** to 30+ backends via the Contrib distribution
* **Auto-instrumentation** zero-code SDKs for Java, Python, Node.js, Go, .NET, Ruby
#### **Who It's For**
Every modern SRE team. OpenTelemetry has become the de facto standard for telemetry instrumentation. Adopting OTel now means you can switch backends without re-instrumenting your services permanently avoiding vendor lock-in.
#### **Pricing**
Completely free. The Collector runs as a sidecar or standalone agent.
#### **Integration Complexity**
**Low to Medium.** Getting basic metrics, logs, and traces flowing takes hours. Advanced processor pipelines with tail sampling, batch processing, and enrichment take more configuration. The [Contrib distribution](https://openobserve.ai/blog/opentelemetry-collector-contrib/) includes 100+ receivers, processors, and exporters.
## **Log Management**
### **7\. Elasticsearch / OpenSearch**
**Elasticsearch:** elastic.co | **OpenSearch:** opensearch.org **License:** Elastic License 2.0 (ES) | Apache 2.0 (OpenSearch)
#### **What It Does**
Elasticsearch (and its open-source fork, OpenSearch) is the foundation of the **ELK Stack** (Elasticsearch, Logstash, Kibana) the most widely deployed log management architecture in the world. It provides a distributed, RESTful search and analytics engine capable of ingesting and searching massive volumes of structured and unstructured data.
Key capabilities:
* **Full-text search** blazing-fast log search across billions of events
* **Aggregations** powerful analytics on log data in real time
* **Index lifecycle management** automated hot/warm/cold data tiering
* **Kibana** visualization and dashboarding layer
* **Security** RBAC, audit logging, field-level security (Enterprise)
* **OpenSearch** the AWS-maintained fork with identical core APIs
#### **Who It's For**
* Teams with large log volumes needing powerful search and analytics
* Organizations with existing ELK investments
* Compliance-heavy industries needing long-term log retention and auditability
**The Catch:** Running Elasticsearch at scale is operationally intensive. Storage costs are high because data is indexed by default. High-cardinality fields cause heap pressure and cluster instability. OpenSearch alleviates some licensing concerns but not the operational burden.
**Alternatives:** [Best Elasticsearch Alternatives in 2026](https://openobserve.ai/blog/elasticsearch-alternatives/) comparing cost-efficient alternatives for log analytics.
#### **Pricing**
| Tier | Cost |
| ----- | ----- |
| Self-hosted (OSS) | Free (infra costs apply) |
| Elastic Cloud | From $95/month (small cluster) |
| Enterprise | Custom |
#### **Integration Complexity**
**High.** Deploying and operating an Elasticsearch cluster at scale requires dedicated expertise in index management, shard allocation, JVM tuning, and snapshot/restore. The ELK pipeline (Logstash → ES → Kibana) involves multiple components to maintain.
### **8\. Grafana Loki**
**Website:** grafana.com/oss/loki **License:** AGPL-3.0
#### **What It Does**
Loki is Grafana Labs' horizontally scalable, highly available log aggregation system. Unlike Elasticsearch, Loki does **not index the contents of logs** it only indexes metadata labels (similar to how Prometheus handles metrics). Log content is stored compressed in object storage and queried via LogQL.
This design philosophy dramatically reduces storage costs compared to full-text indexed solutions, making Loki a popular choice for Kubernetes environments where log volumes are high.
Key capabilities:
* **Label-based indexing** low-cost storage via object backends
* **LogQL** query language inspired by PromQL for log filtering and aggregation
* **Native Grafana integration** correlate logs directly from Grafana dashboards
* **Kubernetes-native** seamless Promtail-based collection from pods and nodes
* **LogQL metric queries** generate metrics directly from log data
#### **Who It's For**
* Teams running the Grafana/Prometheus stack wanting a cost-efficient log backend
* Kubernetes-heavy organizations with high log volumes
* SREs who need to correlate logs with Prometheus metrics in Grafana
**The Catch:** Loki's label-based indexing is a double-edged sword. High-cardinality labels (e.g., user IDs in labels) cause serious performance degradation. Full-text search is slower than Elasticsearch. Complex log analytics require advanced LogQL knowledge.
#### **Pricing**
Free and open source. Grafana Cloud includes Loki in managed tiers.
#### **Integration Complexity**
**Medium.** Loki integrates well within the Grafana ecosystem but requires operational expertise for scaling. Works best as part of the full Grafana stack, less compelling as a standalone tool.
## **Alerting & On-Call**
### **9\. PagerDuty**
**Website:** pagerduty.com **License:** Proprietary SaaS
#### **What It Does**
PagerDuty is the industry-standard incident response and on-call management platform. It receives alerts from any monitoring tool, applies intelligent routing via escalation policies, and notifies the right person via phone, SMS, push notification, or Slack at the right time.
Key capabilities:
* **On-call scheduling** rotations, overrides, and coverage management
* **Escalation policies** automatic escalation when alerts go unacknowledged
* **Alert deduplication** noise reduction via intelligent grouping
* **AIOps** ML-based alert correlation and noise suppression
* **Postmortem tooling** incident timeline reconstruction and documentation
* **Bi-directional integrations** 700+ integrations including all major monitoring tools
* **Status pages** public and internal service status communication
#### **Who It's For**
* Any engineering team with on-call responsibilities and SLAs
* Organizations needing structured incident workflows and escalation management
* Enterprise teams requiring audit trails, compliance reporting, and executive visibility
**Integration guide:** [How to Configure PagerDuty with OpenObserve Alerts](https://openobserve.ai/blog/configure-pagerduty-with-openobserve-alerts/) step-by-step webhook setup for OpenObserve → PagerDuty incident creation.
#### **Pricing**
| Tier | Cost |
| ----- | ----- |
| Free | 5 users, basic features |
| Professional | $21/user/month |
| Business | $41/user/month |
| Enterprise | Custom |
#### **Integration Complexity**
**Low.** PagerDuty connects to any alerting source via webhook. Setting up OpenObserve, Datadog, Prometheus, or Grafana to send alerts to PagerDuty takes under 30 minutes.
### **10\. Prometheus Alertmanager**
**Website:** prometheus.io/docs/alerting/latest/alertmanager **License:** Apache 2.0
#### **What It Does**
Prometheus Alertmanager is the official alerting component of the Prometheus ecosystem. It handles alerts sent by Prometheus server, deduplicates them, groups them, silences them during maintenance, and routes them to the correct receiver Slack, PagerDuty, email, OpsGenie, or any webhook endpoint.
Key capabilities:
* **Alert grouping** combine related alerts into single notifications
* **Inhibition rules** suppress downstream alerts when a root cause alert fires
* **Silencing** mute alerts during planned maintenance windows
* **HA-ready** cluster-mode support with Gossip protocol for redundancy
* **Flexible routing trees** route by label matchers to different teams/channels
#### **Who It's For**
* Teams already running Prometheus for metrics collection
* Open-source-first organizations building self-hosted alerting pipelines
* SREs who want fine-grained control over alert routing logic
**The Catch:** Alertmanager is purely a routing layer it has no UI for managing on-call schedules, no mobile app, no escalation logic, and no postmortem tooling. Most production teams pair it with PagerDuty or incident.io for the on-call management layer.
**Simplify Alertmanager:** [Simplify Prometheus Alertmanager setups with OpenObserve](https://openobserve.ai/blog/alerting-101-from-concept-to-demo/) unified alerts for metrics, logs, and traces without YAML complexity.
#### **Pricing**
Completely free and open source.
#### **Integration Complexity**
**Medium.** Alertmanager is powerful but configuration-heavy. Routing trees, inhibition rules, and receiver configuration are all done in YAML. Templating alert messages requires Go templating knowledge.
## **Incident Management**
### **11\. incident.io**
**Website:** incident.io **License:** Proprietary SaaS
#### **What It Does**
incident.io is a modern incident management platform built natively for Slack-first engineering teams. It transforms incident response from a chaotic, manual process into a structured, automated workflow all without leaving Slack.
Key capabilities:
* **Slack-native incident workflow** declare, manage, and resolve incidents entirely in Slack
* **Automated roles** auto-assign incident commander, comms lead, and responders
* **Incident status pages** public-facing and internal status communication
* **Timeline automation** automatic incident timeline construction from Slack messages
* **Post-incident analysis** structured postmortem templates and follow-up tracking
* **Workflows** trigger automated actions based on incident type, severity, or service
* **Catalog** service ownership registry for routing to correct responders
#### **Who It's For**
* Slack-centric engineering organizations wanting to eliminate context switching during incidents
* Teams building a blameless postmortem culture with structured follow-ups
* Growing engineering orgs who've outgrown ad-hoc incident Slack channels
#### **Pricing**
| Tier | Cost |
| ----- | ----- |
| Free | Up to 5 incidents/month |
| Starter | $19/user/month |
| Pro | $39/user/month |
| Enterprise | Custom |
#### **Integration Complexity**
**Low.** incident.io installs as a Slack app in minutes and connects to PagerDuty, Datadog, GitHub, Jira, and more via pre-built integrations. No infrastructure to manage.
### **12\. FireHydrant**
**Website:** firehydrant.com **License:** Proprietary SaaS
#### **What It Does**
FireHydrant is an end-to-end incident management platform built around **runbooks, retrospectives, and service catalog intelligence**. It goes deeper than incident.io on process automation enabling teams to define multi-step runbooks that execute automatically when specific incident conditions are detected.
Key capabilities:
* **Runbook automation** trigger multi-step response procedures automatically
* **Service catalog** map services to owners, dependencies, and SLAs
* **Signals** built-in alert routing and on-call management (reducing PagerDuty dependency)
* **Retrospectives** structured blameless postmortem generation with AI assistance
* **Analytics** incident metrics, MTTR trends, and reliability reporting
* **Integrations** PagerDuty, Datadog, GitHub, Jira, Slack, and 30+ more
#### **Who It's For**
* Platform engineering teams building standardized incident workflows across multiple product teams
* Organizations wanting to reduce tool sprawl by consolidating on-call \+ runbooks \+ retrospectives
* Engineering leaders who need reliability metrics and MTTR reporting for executive stakeholders
#### **Pricing**
| Tier | Cost |
| ----- | ----- |
| Free | Limited features, small teams |
| Teams | $18/user/month |
| Enterprise | Custom |
#### **Integration Complexity**
**Medium.** FireHydrant's depth means more configuration up front service catalog population, runbook design, and signal routing take investment. Pays dividends at scale.
## **SLO Tracking**
### **13\. Nobl9**
**Website:** nobl9.com **License:** Proprietary SaaS
#### **What It Does**
Nobl9 is a dedicated **SLO management platform** purpose-built to define, track, and alert on Service Level Objectives across any data source. Rather than bolting SLO tracking onto a general observability platform, Nobl9 treats SLOs as first-class objects with error budgets, burn rate alerts, and executive reporting built in.
Key capabilities:
* **SLO as code** define SLOs in YAML, managed via GitOps workflows
* **Multi-source SLIs** pull metrics from Datadog, Prometheus, [Dynatrace](/dynatrace-alternative/), [New Relic](/newrelic-alternative/), Splunk, and 20+ more
* **Error budget tracking** real-time remaining error budget visualization
* **Burn rate alerting** alert when error budget is depleting faster than acceptable
* **Composite SLOs** combine multiple indicators into a single service reliability score
* **Reliability reports** shareable SLO status reports for leadership
#### **Who It's For**
* Engineering organizations with formal SLO programs and reliability mandates
* Platform teams standardizing SLO definitions across many service teams
* SRE teams that need SLO reporting without changing their existing metrics backends
**Build SLOs in OpenObserve:** [SLO-Based Alerting in OpenObserve](https://openobserve.ai/blog/slo-based-alerting/) how to define, monitor, and alert on SLOs using SQL queries and OpenObserve dashboards (no dedicated SLO tool required).
**SLO alerting strategy:** [SLO-Driven Monitoring: Build Better Alerts with OpenObserve](https://openobserve.ai/blog/slo-based-alerting/) framing reliability goals around user experience rather than infrastructure thresholds.
#### **Pricing**
| Tier | Cost |
| ----- | ----- |
| Free | 10 SLOs, 1 user |
| Team | $500/month (50 SLOs) |
| Business | $1,500/month (150 SLOs) |
| Enterprise | Custom |
#### **Integration Complexity**
**Medium.** Nobl9 connects to your existing metrics sources via API no agent to deploy. SLO definition requires understanding SLI/SLO concepts and YAML configuration. Strong documentation and a well-designed UI ease the learning curve.
## **Chaos Engineering**
### **14\. Chaos Monkey / Chaos Toolkit**
**Chaos Monkey:** github.com/Netflix/chaosmonkey **Chaos Toolkit:** chaostoolkit.org **License:** Apache 2.0 (both)
#### **What It Does**
**Chaos Monkey**, created by Netflix, is the tool that started the chaos engineering movement. It randomly terminates virtual machine instances in production during business hours forcing teams to build resilience into every service. It's the origin of the broader "Simian Army" philosophy: if you build for failure, you won't be surprised by it.
**Chaos Toolkit** is a more flexible, modern alternative a framework-agnostic, declarative chaos engineering tool that lets teams define experiments as JSON/YAML files and execute them against any infrastructure.
Chaos Monkey capabilities:
* **Random instance termination** in AWS Auto Scaling Groups
* **Configurable scheduling** when, how often, and at what blast radius
* **Spinnaker integration** chaos runs as part of CD pipelines
Chaos Toolkit capabilities:
* **Declarative experiments** define steady state, method, and rollback in YAML/JSON
* **Extension ecosystem** Kubernetes, AWS, GCP, Azure, Prometheus, Slack extensions
* **CI/CD integration** run chaos experiments as pipeline stages
* **Hypothesis validation** verify system returns to steady state after fault injection
#### **Who It's For**
* **Chaos Monkey:** Netflix-influenced orgs running on AWS with Auto Scaling Groups
* **Chaos Toolkit:** Teams wanting a framework-agnostic, customizable chaos platform
* Any team practicing reliability engineering who wants to validate their failure assumptions
#### **Pricing**
Both are fully free and open source.
#### **Integration Complexity**
**Medium (Chaos Monkey) / Low-Medium (Chaos Toolkit).** Chaos Monkey requires Spinnaker and AWS. Chaos Toolkit runs anywhere and has a lower barrier to entry for custom experiments.
### **15\. LitmusChaos**
**Website:** litmuschaos.io **GitHub:** github.com/litmuschaos/litmus **License:** Apache 2.0 **CNCF Status:** Incubating project
#### **What It Does**
LitmusChaos is the leading **Kubernetes-native chaos engineering platform**. It provides a complete chaos engineering framework with a ChaosHub (library of pre-built experiments), a workflow engine for multi-step chaos scenarios, and a dedicated portal for managing and analyzing experiments.
Key capabilities:
* **ChaosHub** 50+ pre-built chaos experiments (pod delete, node drain, network chaos, disk fill, CPU hog, etc.)
* **Chaos workflows** sequence multiple experiments with probes and rollback
* **Chaos probes** define steady-state hypothesis checks (HTTP, command, Prometheus, k8s)
* **Resilience scoring** quantify how resilient each service is after chaos experiments
* **GitOps support** manage chaos experiments via Git repositories
* **Multi-tenant portal** team-based access control for chaos experiments
#### **Who It's For**
* Kubernetes platform teams building reliability engineering practices
* SRE teams who want a production-safe, controllable way to inject failures
* Organizations adopting chaos engineering for the first time LitmusChaos's pre-built experiments reduce time-to-first-chaos dramatically
#### **Pricing**
| Tier | Cost |
| ----- | ----- |
| Community (OSS) | Free |
| ChaosNative Enterprise | Custom pricing |
#### **Integration Complexity**
**Low to Medium.** LitmusChaos installs via Helm chart into any Kubernetes cluster. Pre-built experiments work immediately. Custom chaos experiments require writing ChaosEngine CRDs and understanding Kubernetes operators. Integrates with Prometheus for metric-based steady-state probes.
## **SRE Tool Comparison Matrix**
| Tool | Category | Open Source | Pricing Model | Integration Complexity | Best For |
| ----- | ----- | ----- | ----- | ----- | ----- |
| **OpenObserve** | Unified Observability | ✅ Yes | $0.50/GB (Cloud) / Free (OSS) | Low–Medium | All-in-one replacement for Grafana stack |
| **Datadog** | Unified Observability | ❌ No | Per host \+ per GB | Low (setup) / High (cost mgmt) | Enterprise, full-managed |
| **Grafana Stack** | Observability \+ Viz | ✅ Yes | Free OSS / Cloud pricing | High | Flexibility-first teams |
| **Jaeger** | Distributed Tracing | ✅ Yes | Free (infra costs) | Medium | OTel-native tracing |
| **Grafana Tempo** | Distributed Tracing | ✅ Yes | Free OSS | Medium | 100% trace retention at low cost |
| **OpenTelemetry** | Instrumentation | ✅ Yes | Free | Low–Medium | Vendor-agnostic instrumentation |
| **Elasticsearch** | Log Management | ✅ (partial) | Free OSS / Cloud from $95/mo | High | Full-text search at scale |
| **Loki** | Log Management | ✅ Yes | Free OSS | Medium | K8s log aggregation, Grafana users |
| **PagerDuty** | On-Call / Alerting | ❌ No | From $21/user/month | Low | On-call scheduling \+ escalation |
| **Alertmanager** | Alerting | ✅ Yes | Free | Medium | Prometheus-native routing |
| **incident.io** | Incident Management | ❌ No | From $19/user/month | Low | Slack-native incident workflows |
| **FireHydrant** | Incident Management | ❌ No | From $18/user/month | Medium | Runbook automation \+ retrospectives |
| **Nobl9** | SLO Tracking | ❌ No | From $500/month | Medium | Dedicated SLO management |
| **Chaos Monkey/Toolkit** | Chaos Engineering | ✅ Yes | Free | Medium | AWS \+ custom chaos experiments |
| **LitmusChaos** | Chaos Engineering | ✅ Yes | Free (OSS) | Low–Medium | Kubernetes-native chaos |
## **Build Your SRE Stack: Decision Guide**
Use this flowchart-style guide to assemble the right toolchain for your organization's size, constraints, and maturity.
### **Step 1: Define Your Observability Strategy**
**Question:** Do you want a unified platform or a best-of-breed stack?
**→ Unified Platform (recommended for most teams):**
* Pick **OpenObserve** for logs \+ metrics \+ traces \+ RUM in one place
* Add **PagerDuty** for on-call \+ escalation
* Add **incident.io** or **FireHydrant** for structured incident workflows
* Instrument with **OpenTelemetry** (always)
**→ Best-of-Breed Stack:**
* Metrics: **Prometheus \+ Grafana**
* Logs: **Loki** (K8s) or **Elasticsearch** (complex search)
* Traces: **Jaeger** or **Tempo**
* Alerting: **Alertmanager → PagerDuty**
* Accept: higher operational complexity, multiple query languages, increased tooling cost
### **Step 2: Assess Your Scale and Budget**
| Organization Size | Recommended Observability Approach |
| ----- | ----- |
| **Startup (\< 20 engineers)** | OpenObserve Cloud low cost, zero ops overhead, unified from day one |
| **Growing team (20–100 engineers)** | OpenObserve \+ PagerDuty \+ incident.io |
| **Enterprise (100+ engineers)** | OpenObserve (self-host) or Datadog \+ FireHydrant \+ Nobl9 |
| **Budget-constrained** | OpenObserve OSS \+ Alertmanager \+ Chaos Toolkit (all free) |
### **Step 3: Choose Your Tracing Approach**
* **Already using Grafana?** → Use **Tempo** (native integration, cost-efficient)
* **Need vendor-neutral, standalone tracing?** → Use **Jaeger**
* **Using OpenObserve?** → Built-in trace support no additional tracing tool needed
* **Not yet instrumented?** → Start with **OpenTelemetry** SDKs and decide on the backend later
### **Step 4: Establish SLO Practice**
**Beginner:**
1. Define 2–3 SLOs per critical service (error rate, latency, availability)
2. Build SLO dashboards in **OpenObserve** or **Grafana**
3. Set burn rate alerts using your existing observability platform
[SLO-Based Alerting in OpenObserve](https://openobserve.ai/blog/slo-based-alerting/) a practical walkthrough for defining and alerting on SLOs without a dedicated SLO tool.
**Advanced:**
1. Adopt **Nobl9** for multi-source SLO management and formal error budget tracking
2. Gate deployments using error budget policies in CI/CD
3. Use SLO status in incident severity classification (connect to FireHydrant or incident.io)
### **Step 5: Add Chaos Engineering**
**Just starting?** → Begin with **LitmusChaos** on Kubernetes. Run `pod-delete` experiments on non-critical services first. Use Prometheus probes to validate steady state.
**More mature?** → Add **Chaos Toolkit** for cross-cloud, custom experiments. Integrate into CI/CD pipelines as a "chaos gate" before production deployments.
**Netflix-scale?** → **Chaos Monkey** for autonomous, continuous production resilience testing at the instance level.
## **Final Thoughts**
The SRE toolchain in 2026 is not a solved problem it's a strategic decision that directly affects your team's reliability, velocity, and observability costs. The overarching trend is consolidation: teams that once ran eight separate tools are realizing that cross-signal correlation, unified alerting, and a single query language dramatically reduce MTTR and operational burden.
**OpenObserve** represents this consolidation philosophy most directly replacing the Prometheus \+ Loki \+ Tempo \+ Grafana complexity with a single, cost-efficient platform that handles every signal without sampling or storage compromise.
Regardless of which tools you choose, the fundamentals remain constant:
1. **Instrument with OpenTelemetry** it's the insurance policy against vendor lock-in
2. **Define SLOs before building dashboards** reliability goals should drive what you measure
3. **Automate incident workflows** every manual step during an outage is an avoidable delay
4. **Practice chaos** resilience you haven't tested is resilience you can't count on
**Start here:** [Enterprise Observability Strategy: Efficient Logging at Scale](https://openobserve.ai/blog/enterprise-observability-strategy-insights/) building an observability strategy around critical principles like cost control, standardized collection, and unified insights.
**AI-powered SRE:** [Top 10 AIOps Platforms 2026](https://openobserve.ai/blog/top-10-aiops-platforms/) how AI is changing incident response and root cause analysis in 2026\.
---
**Related guides:**
- [Top 10 Observability Tools in 2026](https://openobserve.ai/blog/top-10-observability-tools/)
- [Top 10 Observability Platforms in 2026](https://openobserve.ai/blog/top-10-observability-platforms/)
- [Best Distributed Tracing Tools in 2026](https://openobserve.ai/blog/distributed-tracing-tool/)
- [Top 10 Microservices Monitoring Tools in 2026](https://openobserve.ai/blog/microservices-monitoring-tools/)
- [Top 10 Datadog Competitors in 2026](https://openobserve.ai/blog/datadog-competitors/)