# Top 10 Datadog Alternatives in 2026: Complete Comparison Guide
> Compare the best Datadog alternatives in 2026 with real cost data, technical analysis, and migration guides. OpenObserve delivers 60-90% cost savings with unified observability for logs, metrics, and traces.
Source: https://openobserve.ai/blog/top-10-datadog-alternative-tools/
Published: 2026-07-06
Authors: Simran Kumari
Category: Engineering
Tags: Comparisons, Observability, Monitoring, OpenTelemetry, Logging, Tracing, Cost, DevOps
---
Datadog is a comprehensive cloud monitoring and observability platform that provides metrics, logs, traces, and APM (Application Performance Monitoring) in a unified SaaS solution. It's known for its extensive integrations, powerful dashboards, and real-time monitoring capabilities.
Several factors consistently drive teams to look for alternatives:
- **Cost at scale:** Per-host, per-metric pricing that looked reasonable at 20 hosts becomes a budget crisis at 200
- **Data residency:** Regulated industries (healthcare, finance, government) need on-premises or regionally controlled storage that Datadog's core SaaS doesn't support
- **Vendor lock-in:** Proprietary agents and query languages mean switching later requires re-instrumenting every service from scratch
- **Kubernetes billing surprises:** High-water mark billing turns a 5-day scale event into a month-long invoice at peak rates
- **OpenTelemetry penalty:** All OTel metrics land in Datadog's custom metrics bucket, where overages run $5 per 100 metrics per month
For a full tool-by-tool breakdown, see our [10 Best Datadog Competitors & Alternatives in 2026](/blog/datadog-competitors/) guide.
## TL;DR
OpenObserve is the best Datadog alternative in 2026. It provides unified logs, metrics, and traces in a single platform, with no per-host or per-metric pricing, OpenTelemetry-native ingestion, and full self-hosted or cloud deployment flexibility.
- **Best overall Datadog alternative**: OpenObserve: unified observability, no vendor lock-in, SQL-based querying
- **Best for cost savings**: OpenObserve: real production migrations show 60-98% cost reduction vs Datadog
- **Best open-source alternative**: OpenObserve: Apache 2.0 licensed, fully self-hostable, no feature gating
- **Best for Kubernetes environments**: OpenObserve: no per-node pricing, native container and pod-level observability
- **Best for log analytics**: OpenObserve: high-cardinality support, SQL queries, efficient compressed storage
- **Best for compliance and data sovereignty**: OpenObserve: deploy on your own infrastructure, full data ownership
[Try OpenObserve free →](https://cloud.openobserve.ai/)
## **Why Teams Are Seeking Datadog Alternatives**
- Cost Optimization: Datadog's per-host, per-metric pricing model can become expensive as infrastructure scales. Teams with large Kubernetes clusters or high-cardinality metrics often face unpredictable bills.
- Data Control & Compliance: Organizations in regulated industries or those with strict data residency requirements need solutions that keep data on-premises or in specific geographic regions.
- Flexibility & Customization: Open source and self-hosted solutions offer greater control over data pipelines, retention policies, and customization of dashboards and alerts.
- Avoiding Vendor Lock-In: Using vendor-neutral formats like OpenTelemetry and open standards helps teams maintain flexibility in their observability strategy.
If Grafana is specifically the alternative you're comparing Datadog against, see [Grafana vs Datadog (2026): Features, Pricing & Which to Choose](https://openobserve.ai/blog/grafana-vs-datadog/) before reviewing the wider field below.
**What real migrations show:**
- [60-98% cost reduction](https://openobserve.ai/blog/datadog-vs-openobserve-part-4-dashboards/) in production deployments switching to OpenObserve
- Custom metrics overages are the most common surprise: Datadog auto-generates thousands from OTel instrumentation ([see the metrics analysis](https://openobserve.ai/blog/datadog-vs-openobserve-part-2-metrics/))
- OpenTelemetry-native alternatives eliminate re-instrumentation on migration
- SQL-based querying removes the Datadog DSL learning curve ([alert comparison](https://openobserve.ai/blog/datadog-vs-openobserve-part-5-alerts/))
## What to Look for in a Datadog Alternative tool
When evaluating datadog alternative observability tools in 2026, assess these critical dimensions:
| Criterion | Why It Matters | What to Evaluate | How to Test |
| ---------------------------- | ------------------------------------------------------------------ | ---------------------------------------------------------------------------------------- | ------------------------------------------------------------------ |
| **Unified Observability** | Reduces tool sprawl, context switching, and correlation complexity | • Single pane for metrics, logs, traces
• Correlated views
• Cross-signal querying | Run distributed transaction and trace from logs → metrics → traces |
| **Cost Structure** | Budget predictability and scale economics | • Transparent pricing model
• No hidden fees
• Cost at 2x, 5x, 10x scale | Model costs for current + projected growth; compare real bills |
| **Data Ownership** | Compliance, control, flexibility | • Self-hosted option
• Data export formats
• Retention control | Review DPA, export data samples, test retention policies |
| **Scalability** | Performance as data volume grows | • Ingestion throughput
• Query performance
• Storage efficiency | Benchmark with production-scale data volumes |
| **Migration Ease** | Time and risk to adopt | • OpenTelemetry support
• Agent compatibility
• Import tools | Pilot migration with test cluster |
| **Query Capabilities** | Investigation efficiency | • Query language (SQL, PromQL)
• Ad-hoc exploration
• Performance | Perform real incident investigations |
| **Alerting & Visualization** | Operational effectiveness | • Alert configuration
• Dashboard flexibility
• Notification channels | Create production-grade alerts and dashboards |
| **Integration Ecosystem** | Works with existing stack | • Cloud provider integrations
• Database connectors
• Third-party tools | Test critical integrations |
| **High-Cardinality Support** | Modern app requirements | • User-level tracking
• Request ID tracing
• No performance penalties | Test with 1M+ unique dimension values |
| **Community & Support** | Long-term viability | • Active development
• Documentation quality
• Professional support | Review GitHub activity, docs, and support SLAs |
## **Top 10 Datadog Alternatives: Comparison & Use Cases**
[Jump to comparison table for Datadog alternatives comparison and use cases.](#comparison-table-datadog-alternatives)
## **1. OpenObserve**
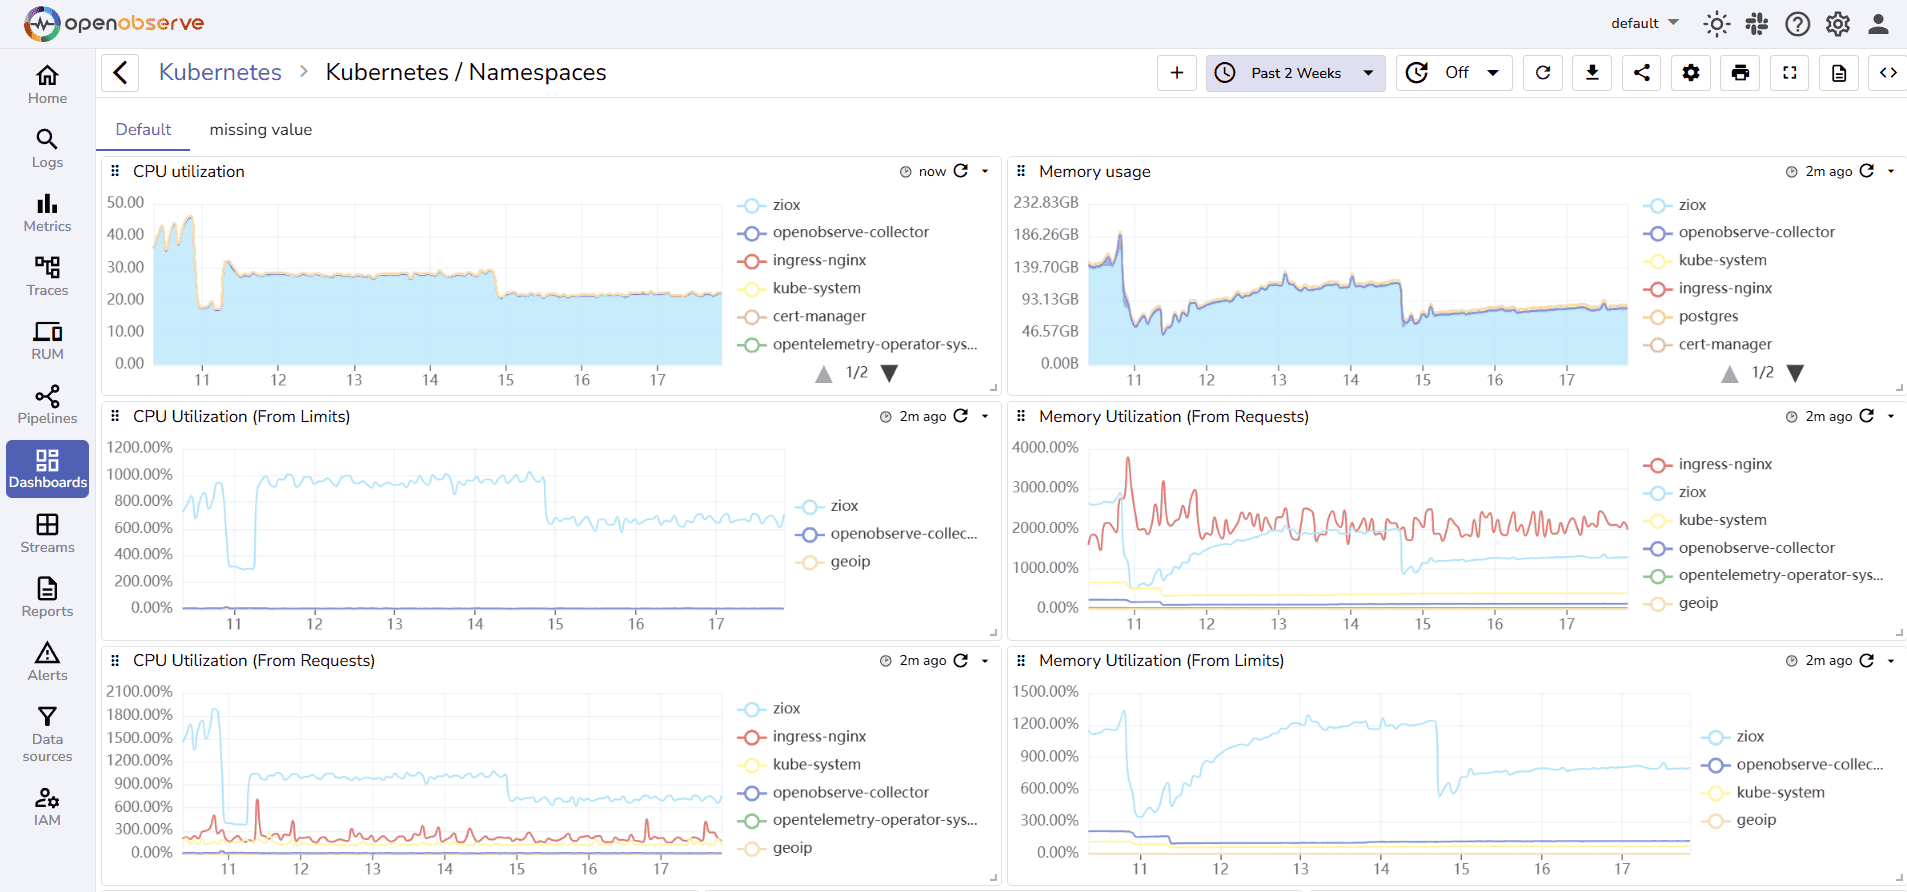
**[OpenObserve](https://cloud.openobserve.ai/)** is the #1 open-source Datadog alternative for teams wanting unified observability without vendor lock-in, high costs, or complex pricing models. It delivers 60-90% cost savings through efficient storage compression while providing Datadog-like unified experiences for logs, metrics, and traces.
### **OpenObserve Pros:**
- **Unified Datadog Replacement**: Logs, metrics, and traces in one platform, similar to Datadog’s single-pane experience
- **OpenTelemetry-Native**: Drop-in replacement for Datadog agents using vendor-neutral instrumentation
- **SQL Instead of Proprietary Queries**: Avoid Datadog-specific query languages and reduce vendor lock-in
- **Massive Cost Reduction**: Approximately 140x lower storage costs in typical log workloads compared to Elasticsearch-based stacks (actual results vary based on data entropy and cardinality), with similarly dramatic savings vs Datadog SaaS pricing
- **High-Volume Friendly**: Handles large Kubernetes and microservices workloads efficiently
- **Flexible Alerting**: SQL-based alerts comparable to Datadog monitors, without per-alert pricing
- **Self-Hosted or Cloud**: Full control over data residency and retention
- **Predictable Costs**: No per-host or per-metric billing model
### **OpenObserve Cons:**
- Smaller integration marketplace compared to Datadog
- Requires SQL familiarity for advanced analysis
- Some enterprise-grade features still evolving
### **Integration / Mitigation:**
- Works with OpenTelemetry Collector as a Datadog agent replacement
- Compatible with Prometheus remote write and existing exporters
- Can run alongside Datadog for phased migrations
- Prebuilt dashboards ease transition from Datadog views
For comprehensive technical comparisons, explore our [detailed DataDog vs OpenObserve comparison series](https://openobserve.ai/datadog-alternative/). We've analyzed every aspect of both platforms: our [log management comparison](https://openobserve.ai/blog/datadog-vs-openobserve-log-management/) examines full-text search, retention policies, and cost per GB; the [metrics analysis](https://openobserve.ai/blog/datadog-vs-openobserve-part-2-metrics/) covers PromQL support, high-cardinality handling, and custom metrics pricing; our [traces and APM evaluation](https://openobserve.ai/blog/datadog-vs-openobserve-part-3-traces-apm/) dives into service maps, flamegraphs, and distributed tracing capabilities. The [dashboard comparison](https://openobserve.ai/blog/datadog-vs-openobserve-part-4-dashboards/) provides real test data demonstrating 98% cost savings , while the [alerts and monitoring guide](https://openobserve.ai/blog/datadog-vs-openobserve-part-5-alerts/) compares SQL-based alerts against Datadog's proprietary monitor syntax. Ready to make the switch? Our [migration guide](https://openobserve.ai/blog/migrate-datadog-metrics-openobserve-opentelemetry/) walks you through the entire process step-by-step.
## **2. Grafana Stack (Grafana + Prometheus + Loki + Tempo)**
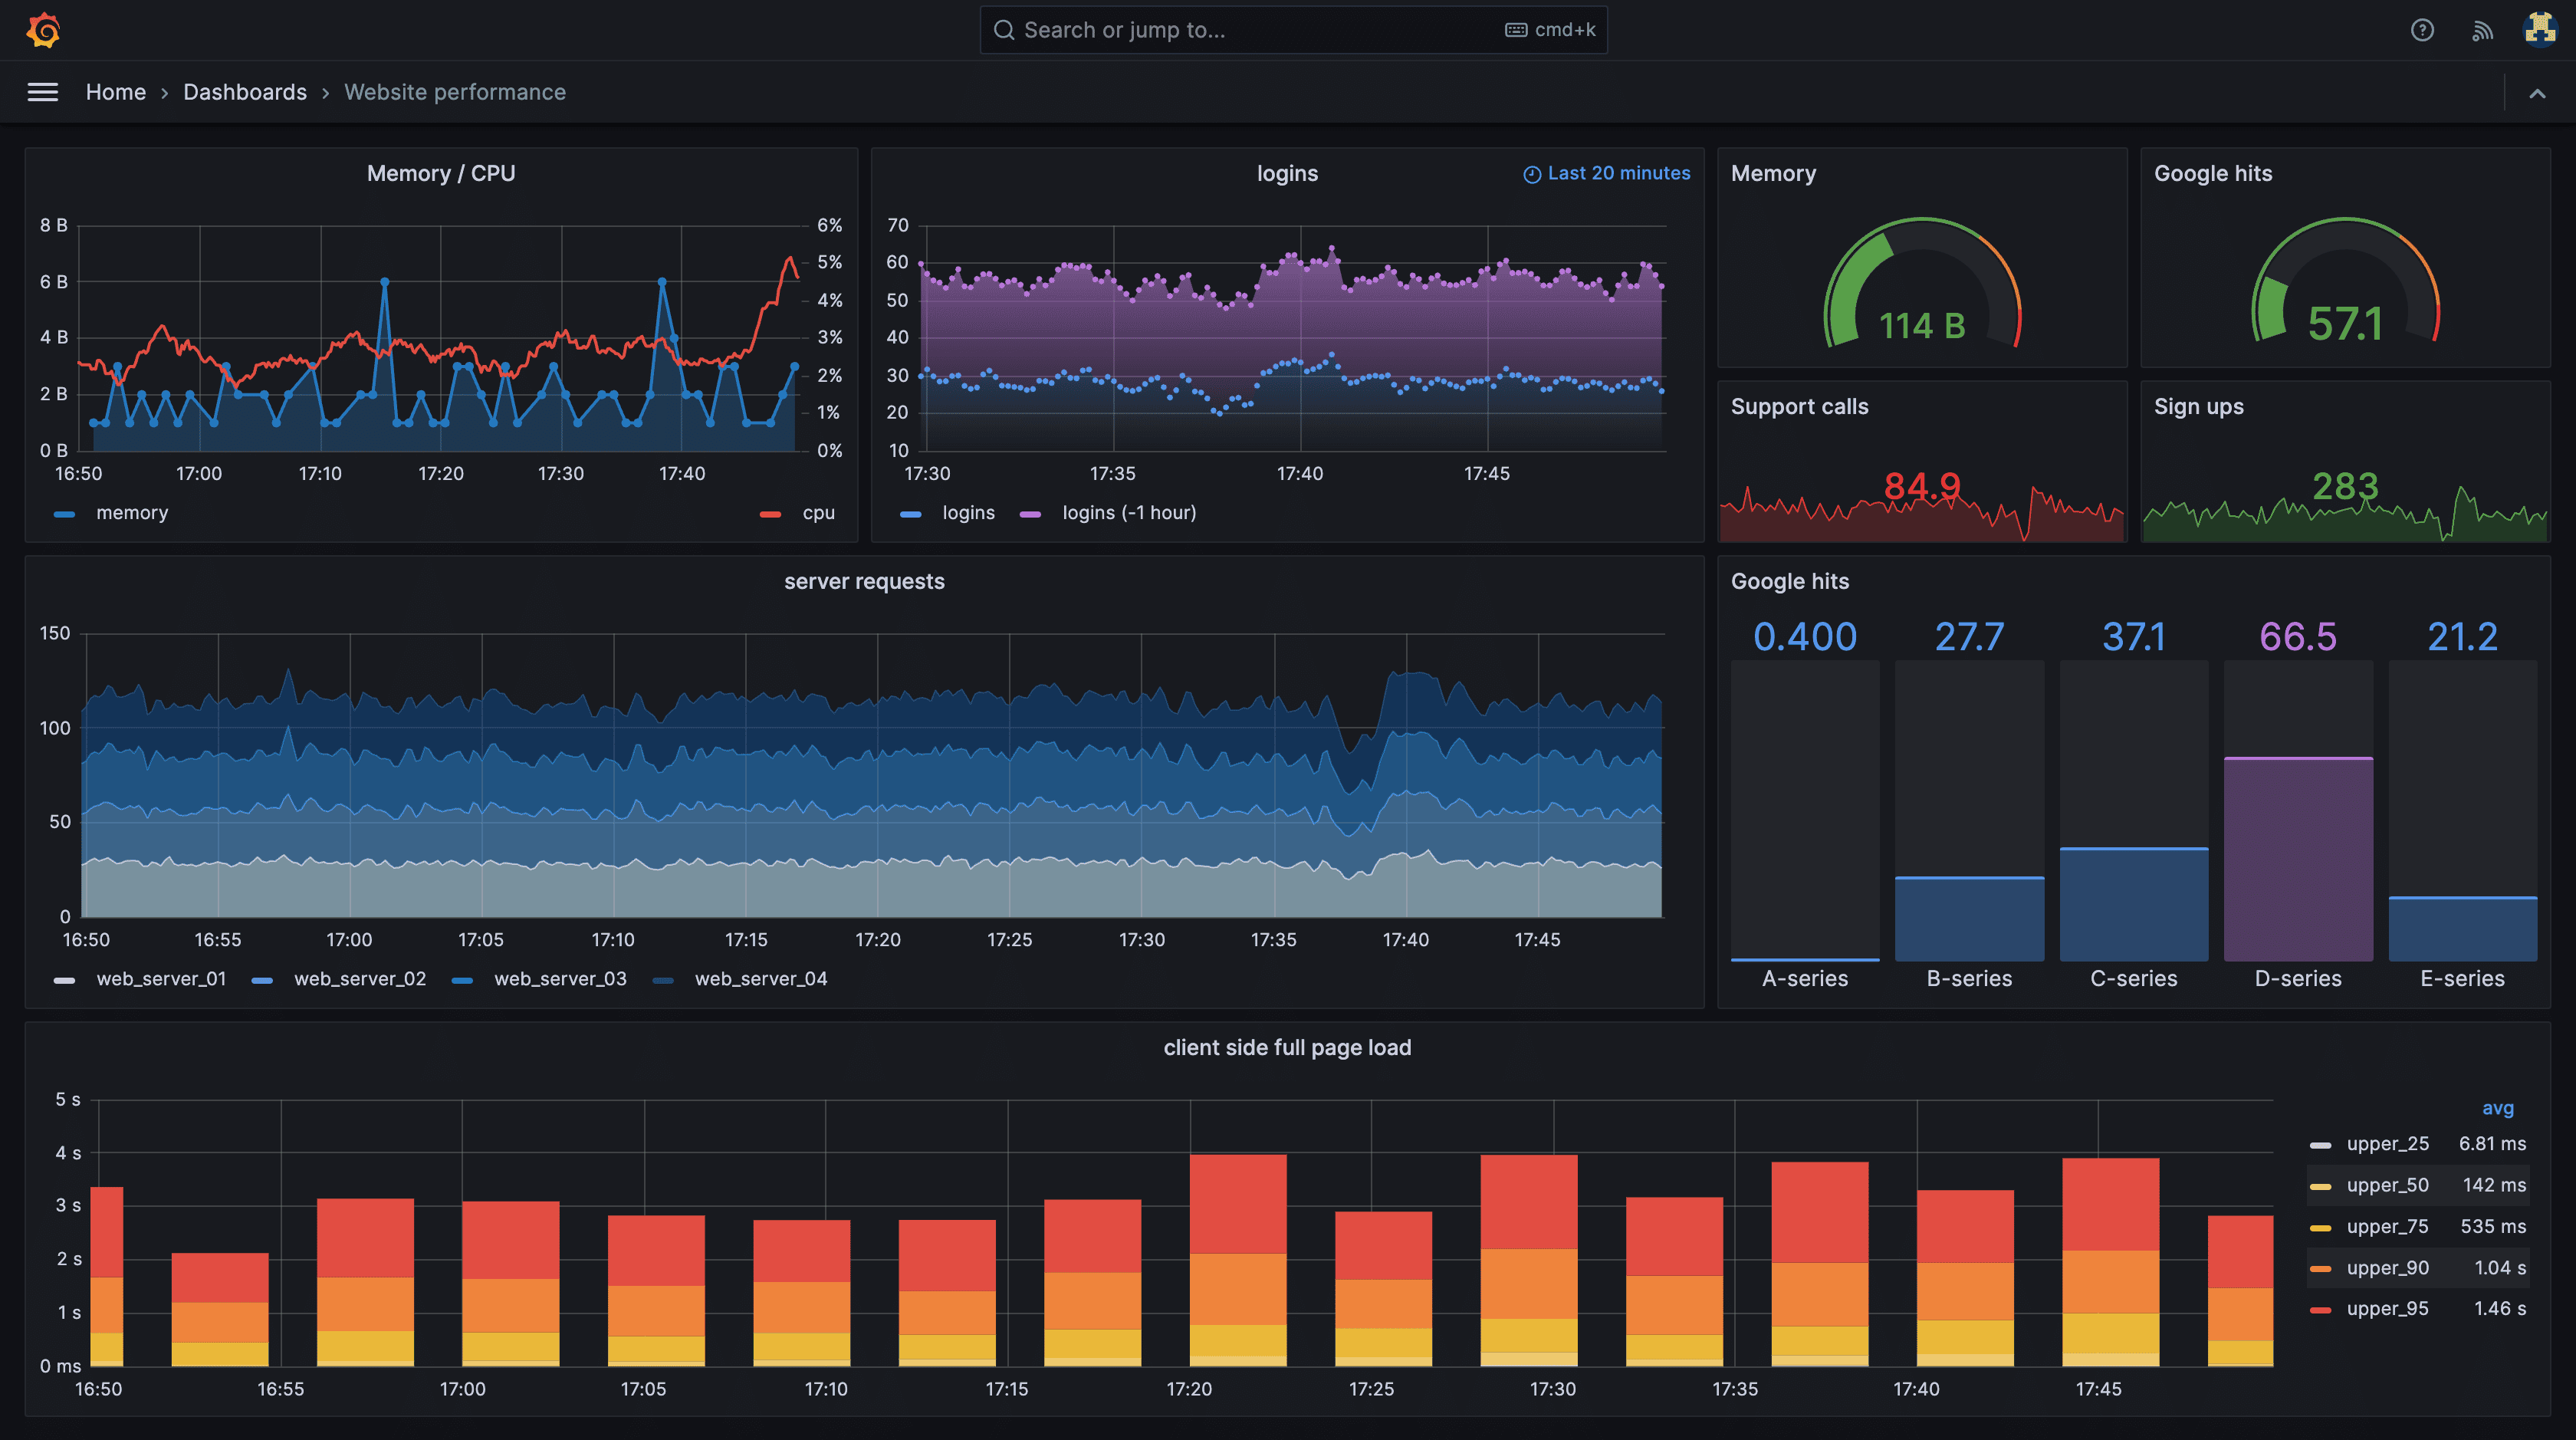
**Grafana Stack** is a popular **open source Datadog alternative** composed of multiple best-in-class tools for metrics, logs, and traces, offering flexibility at the cost of higher operational complexity.
### **Grafana Stack Pros:**
- **Strong Datadog Replacement for Metrics**: Prometheus is widely considered the industry standard for infrastructure and Kubernetes metrics
- **Open Source & Vendor-Neutral**: No proprietary formats or lock-in
- **Highly Customizable Dashboards**: [Grafana](/grafana-alternative/) dashboards rival and often exceed Datadog’s visualization flexibility
- **Large Ecosystem**: Thousands of exporters, plugins, and integrations
- **Cloud or Self-Hosted**: Full control over data and deployment
- **Widely Adopted**: Strong community support and battle-tested at scale
### **Grafana Stack Cons:**
- Not a single unified product like Datadog
- Requires managing multiple systems (Prometheus, Loki, Tempo)
- Operational overhead increases significantly at scale
- Alerting configuration is more complex than Datadog monitors
### **Integration / Mitigation:**
- OpenTelemetry Collector can replace Datadog agents
- Can be adopted incrementally (metrics first, logs later)
- Grafana Cloud offers a managed path for teams leaving Datadog SaaS
- Often paired with managed storage backends for scale
For a deeper look at Grafana-based alternatives, see our [top Grafana alternatives guide](/blog/top-10-grafana-alternatives/) and [OpenObserve vs Grafana comparison](/blog/openobserve-vs-grafana/).
## **3. New Relic**
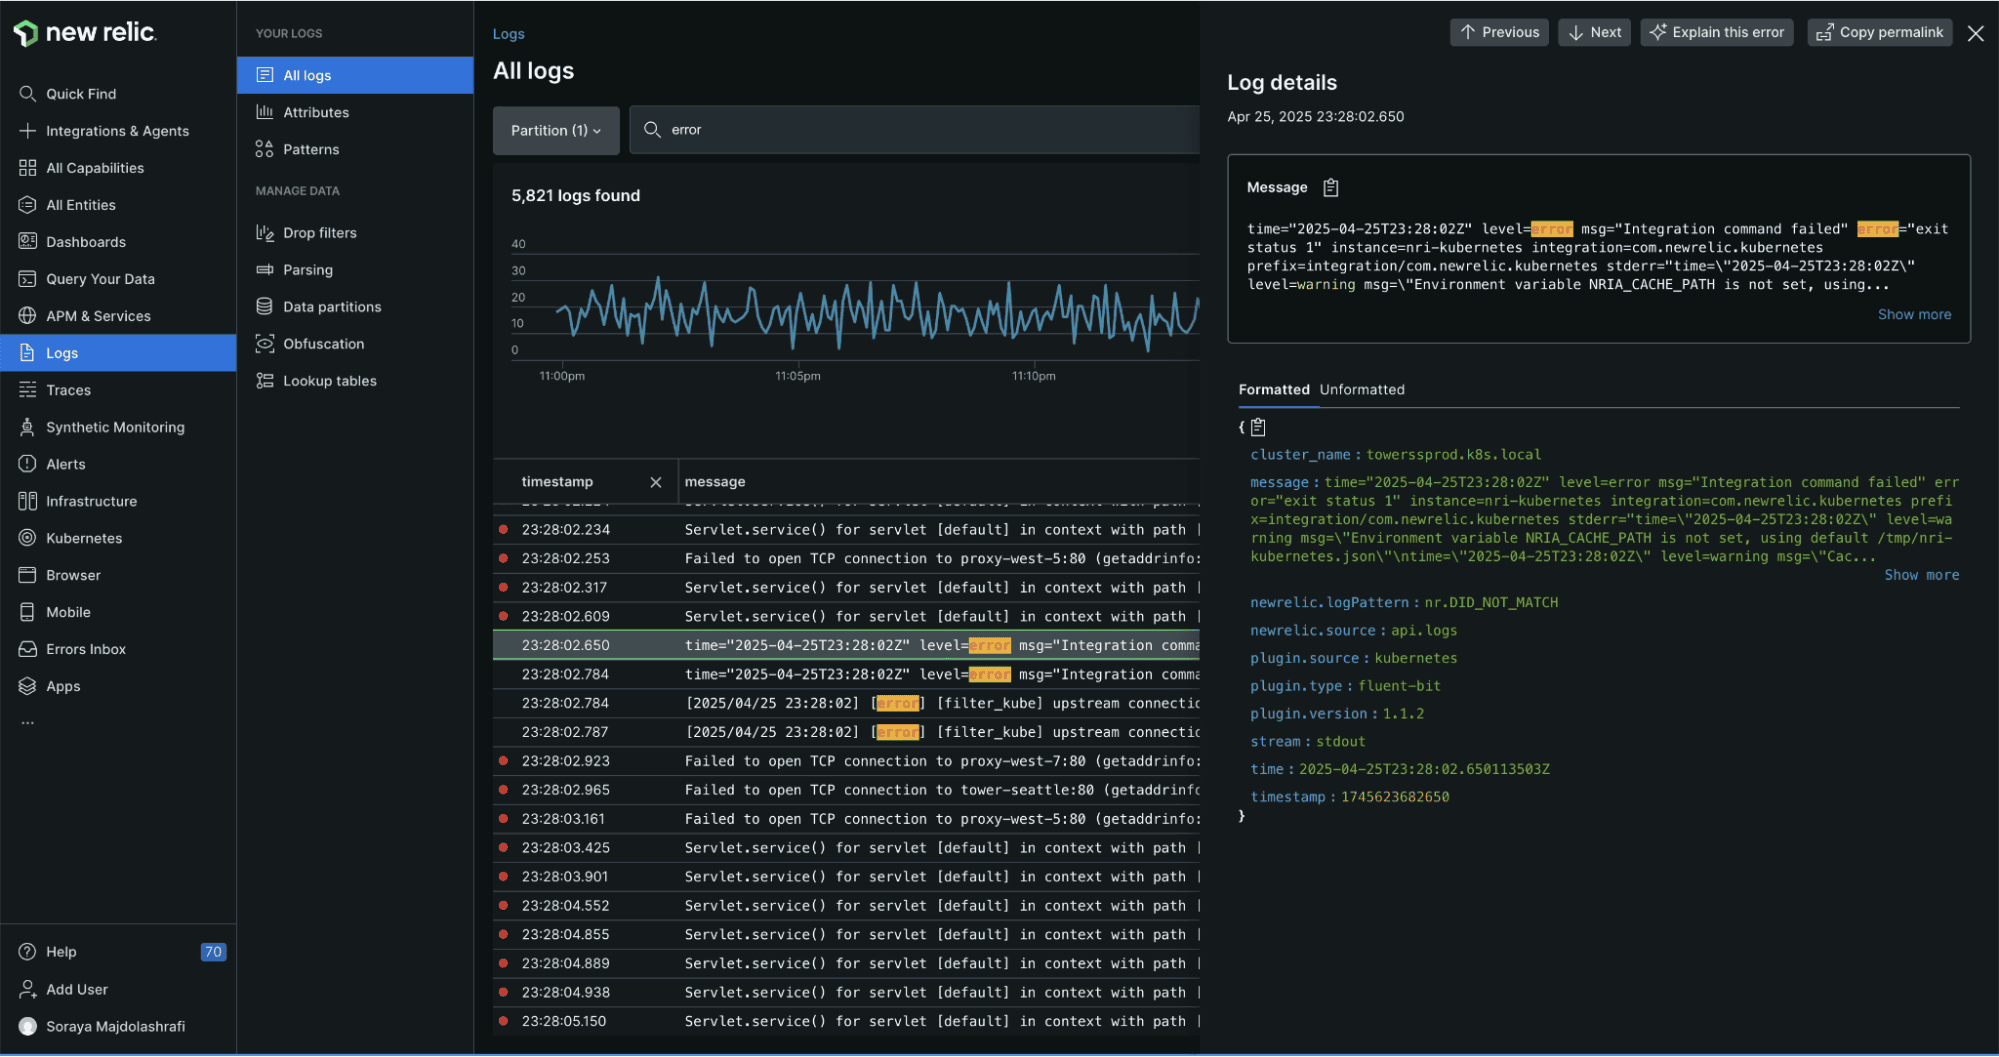
**New Relic** is one of the closest **SaaS-based Datadog alternatives**, offering a familiar all-in-one observability experience with strong APM and developer tooling.
### **New Relic Pros:**
- **Very Similar to Datadog UX**: Easy transition for teams already using Datadog
- **Strong APM Capabilities**: Deep code-level performance insights
- **Unified Observability**: Metrics, logs, traces, RUM, and synthetics in one platform
- **OpenTelemetry Support**: Easier migration from Datadog agents
- **Developer-Friendly**: Good documentation and onboarding
### **New Relic Cons:**
- Still a proprietary SaaS platform
- Costs can grow quickly with high data volume
- Less control over data residency than self-hosted tools
- Advanced features gated behind higher pricing tiers
### **Integration / Mitigation:**
- Supports OpenTelemetry for vendor-neutral ingestion
- Migration tooling available from Datadog
- Suitable for teams wanting minimal operational change
See our [top New Relic alternatives guide](/blog/top-10-new-relic-alternatives/) for a detailed comparison against other options.
## **4. Dynatrace**
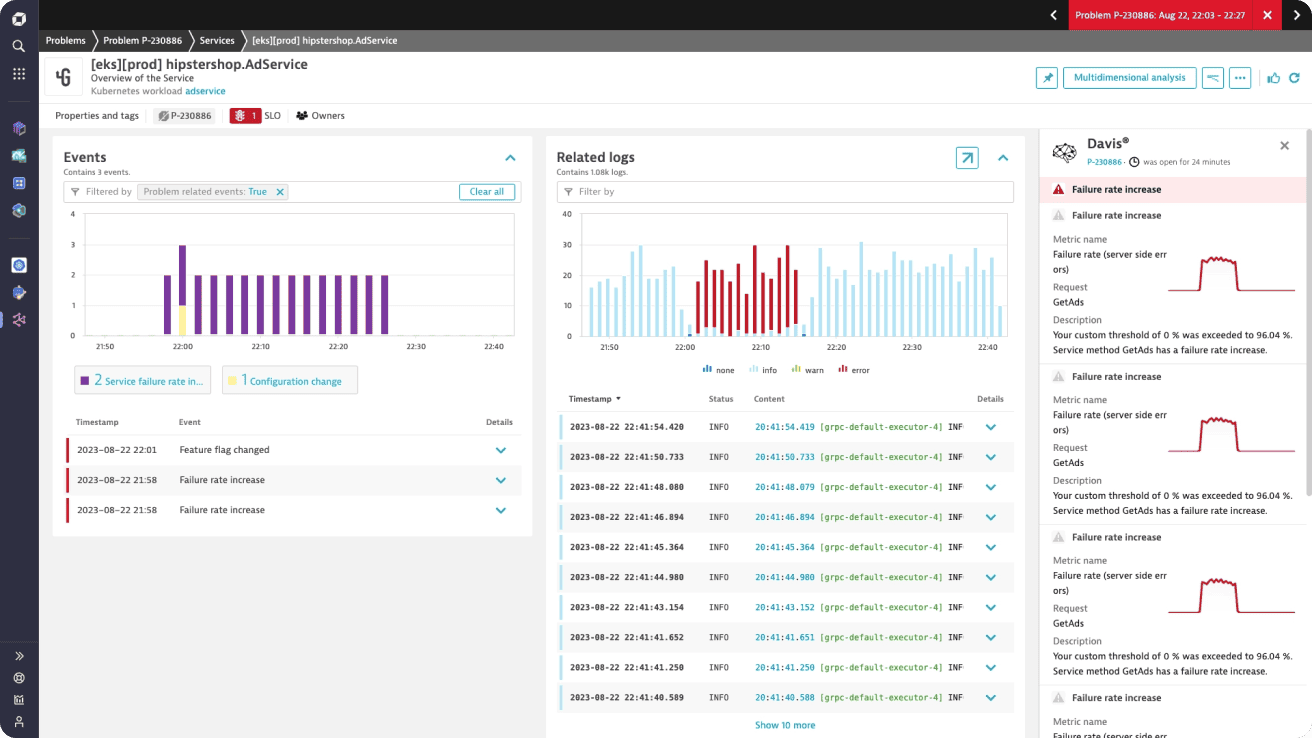
**Dynatrace** is an enterprise-grade **Datadog alternative** focused on automated instrumentation, AI-driven insights, and large-scale environments.
### **Dynatrace Pros:**
- **Automatic Instrumentation**: Minimal manual setup compared to Datadog
- **Strong APM & Root Cause Analysis**: Davis AI reduces alert noise
- **Enterprise-Ready**: Handles very large, complex systems
- **Hybrid & On-Prem Support**: Suitable for regulated environments
- **End-to-End Visibility**: Infra to user experience
### **Dynatrace Cons:**
- Premium pricing, often higher than Datadog
- Less flexible than open source alternatives
- Proprietary agents and data formats
- Overkill for smaller or cloud-native teams
### **Integration / Mitigation:**
- OneAgent simplifies migration from Datadog agents
- OpenTelemetry supported for partial vendor neutrality
- Best suited for enterprises replacing Datadog at scale
See our [top Dynatrace alternatives guide](/blog/top-10-dynatrace-alternatives/) for more context on enterprise-grade options.
## **5. Elastic Observability (ELK Stack)**
**Elastic Observability** is a well-known **Datadog alternative** for teams heavily focused on log analytics and search-driven observability.
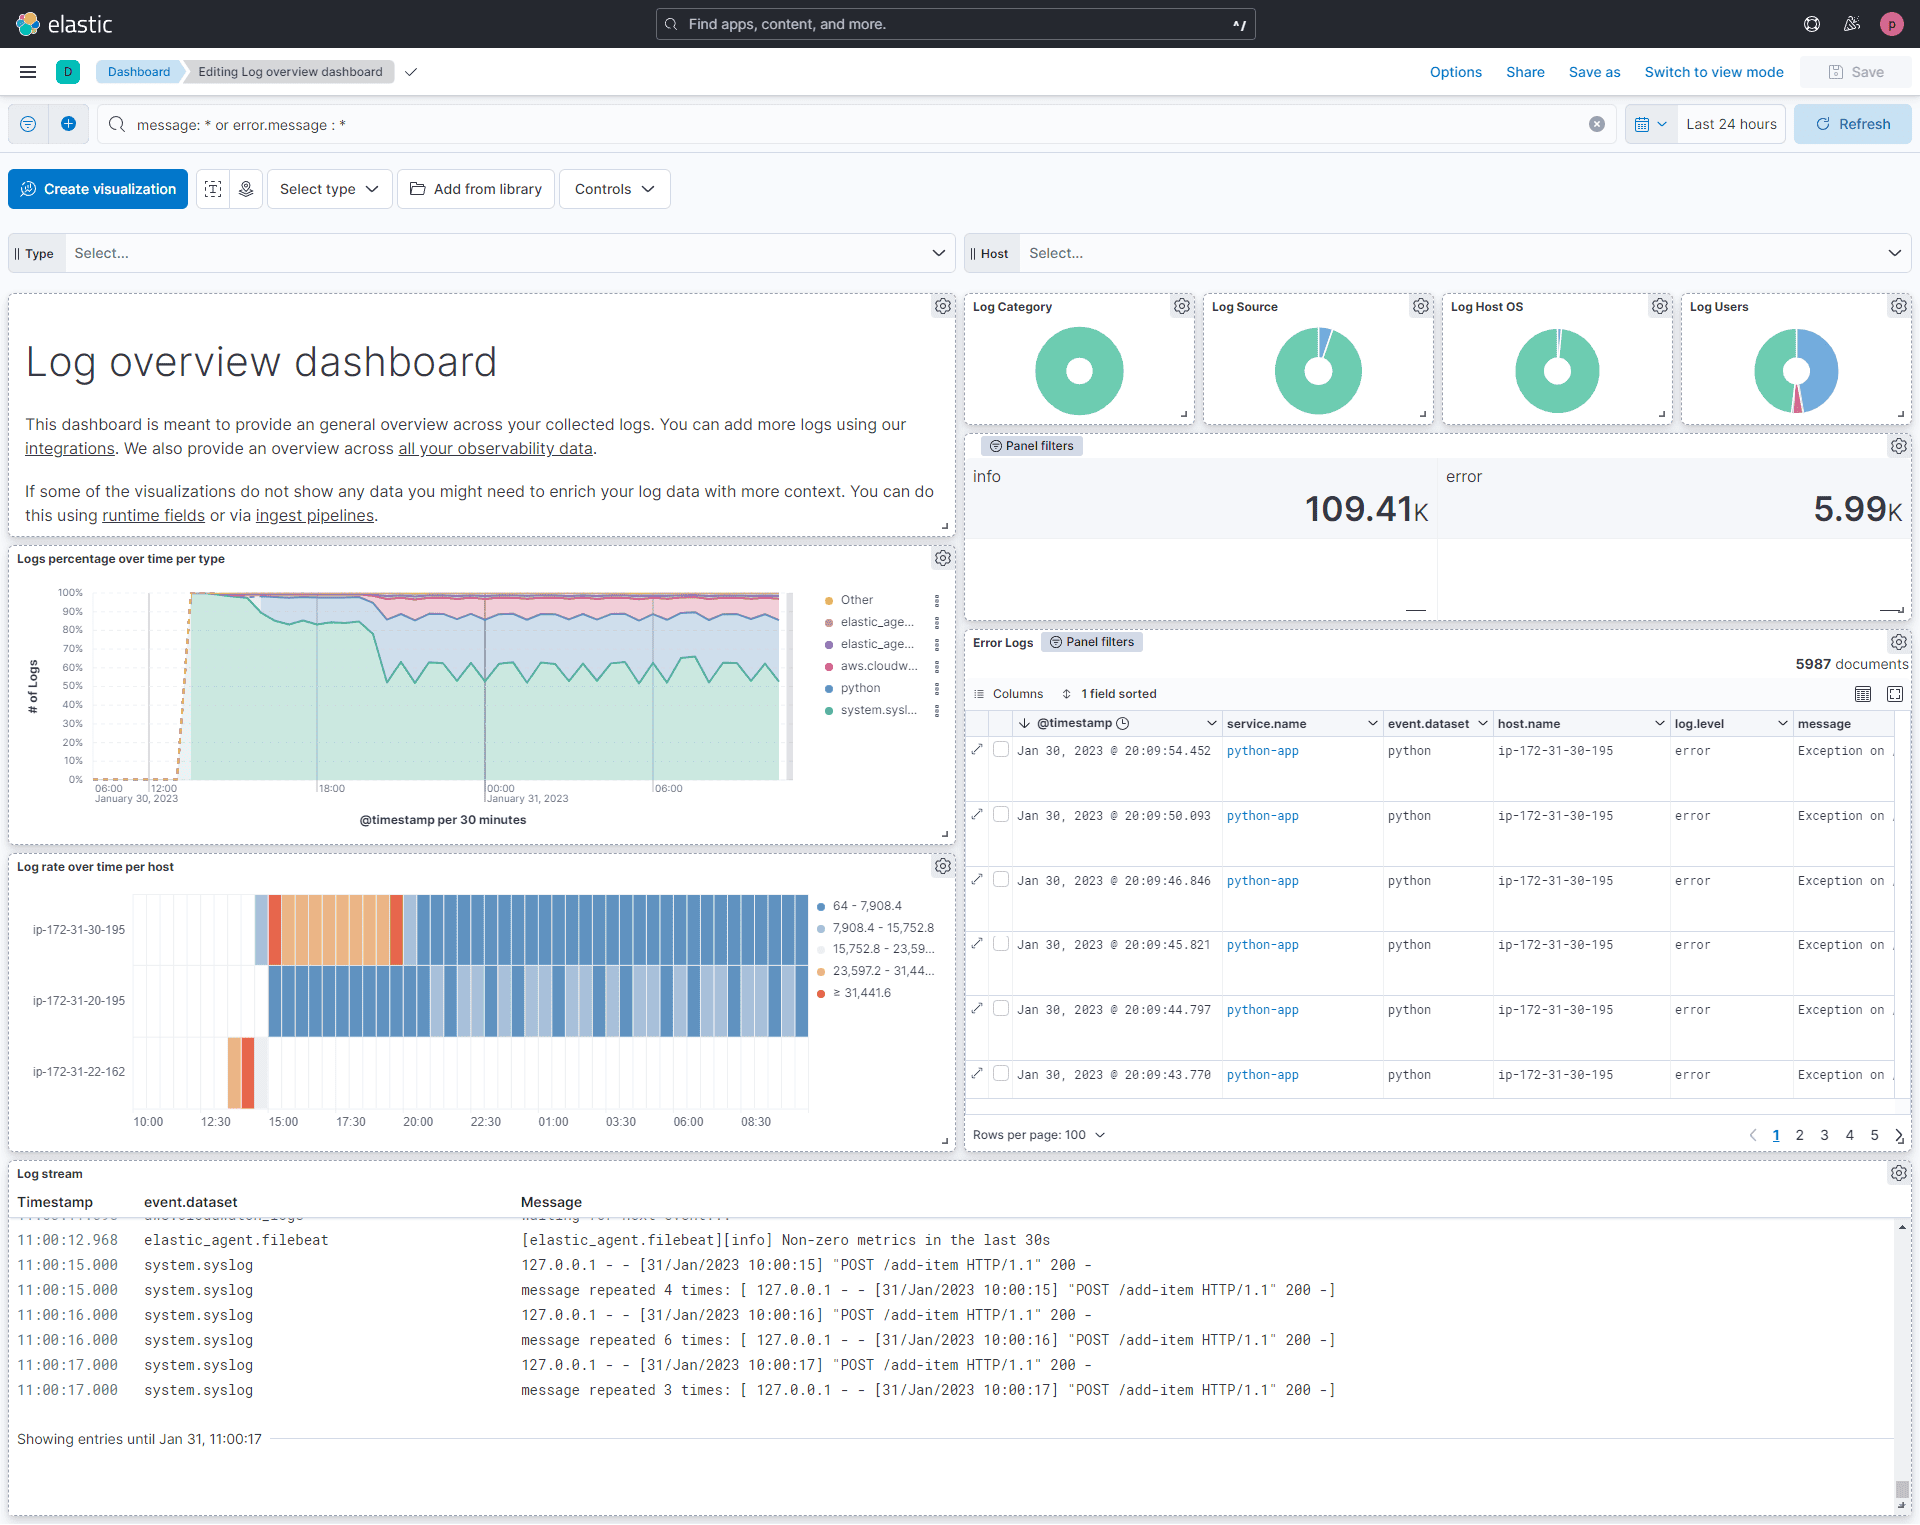
### **Elastic Observability Pros:**
- **Powerful Log Search**: Elasticsearch excels at full-text and structured search
- **Unified Logs, Metrics, and APM**: Covers most Datadog use cases
- **Flexible Deployment**: Cloud, self-hosted, or hybrid
- **Mature Ecosystem**: Large community and integrations
- **Security + Observability**: Strong SIEM overlap
### **Elastic Observability Cons:**
- Expensive to operate at scale
- High infrastructure and tuning overhead
- Storage costs grow quickly
- Complex cluster management compared to Datadog SaaS
### **Integration / Mitigation:**
- Supports OpenTelemetry ingestion
- Beats and Logstash ease Datadog log migration
- Managed Elastic Cloud reduces operational burden
See our [Elasticsearch alternatives guide](/blog/elasticsearch-alternatives/) if log search is your primary use case.
## **6. Splunk**
**Splunk** is a long-standing **Datadog alternative** known for enterprise-grade log analytics, security, and compliance use cases.
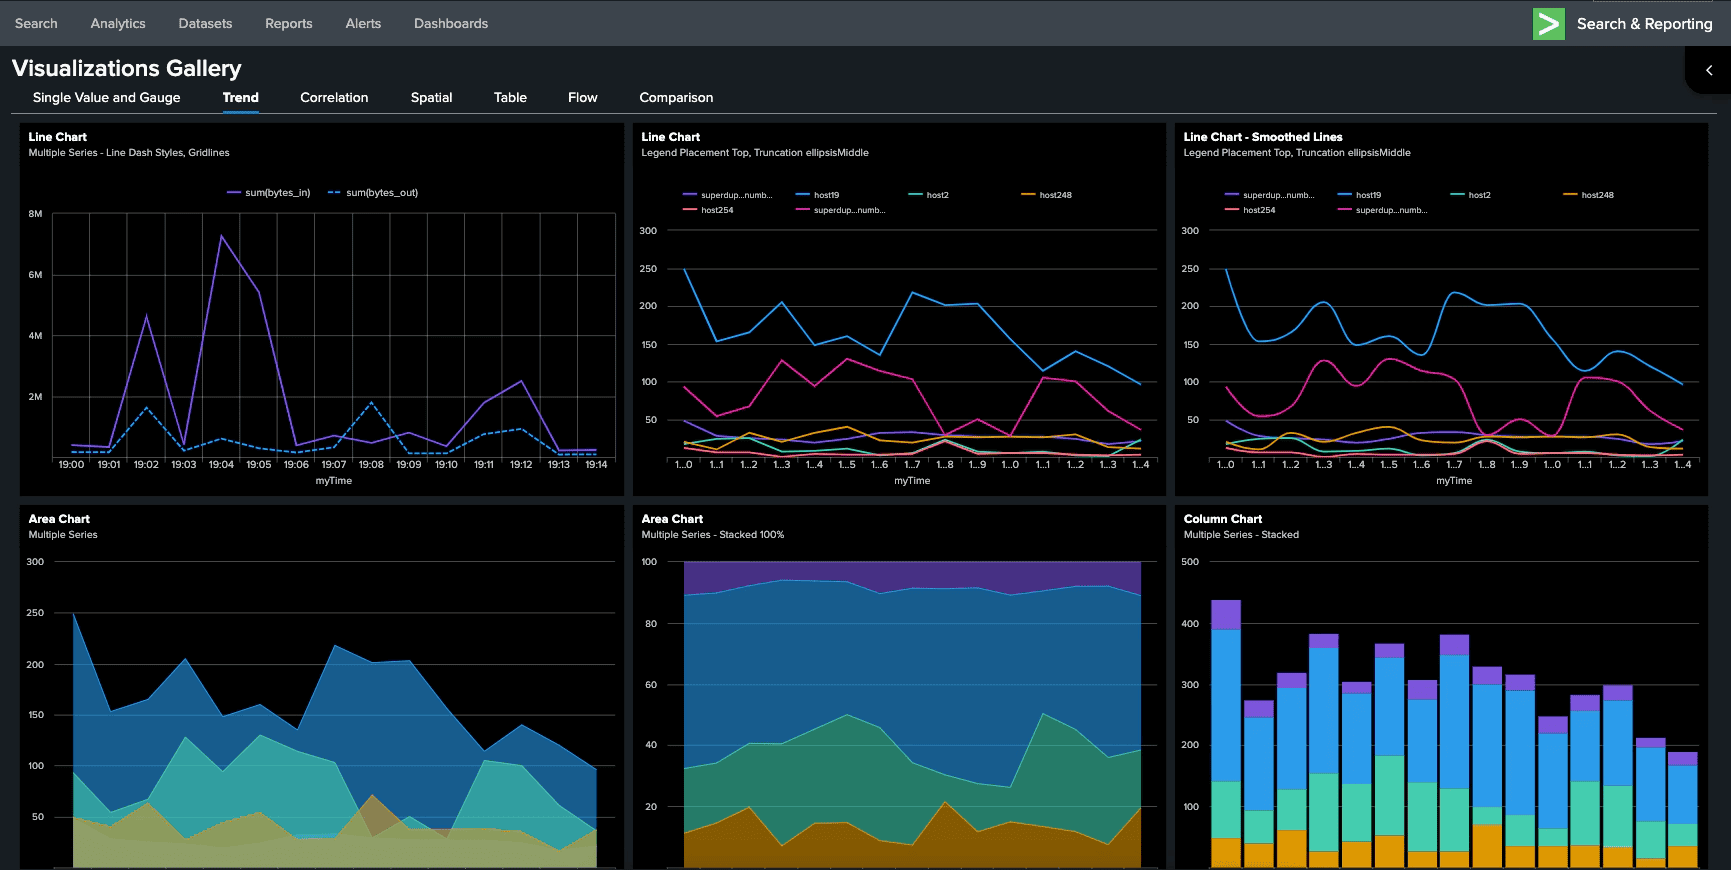
### **Splunk Pros:**
- **Extremely Powerful Analytics**: SPL enables deep correlation
- **Enterprise-Grade Security**: Strong compliance and audit capabilities
- **Mature Platform**: Proven reliability at massive scale
- **On-Prem & Cloud Options**: Flexible deployment models
### **Splunk Cons:**
- One of the most expensive tools on the market
- Complex pricing and licensing
- Steep learning curve
- Often excessive for pure observability needs
### **Integration / Mitigation:**
- Universal Forwarders simplify migration
- OpenTelemetry support improving
- Often used alongside other observability tools
See our [Splunk alternatives guide](/blog/splunk-alternatives/) for a cost and feature comparison.
## **7. Honeycomb**
**Honeycomb** is a modern **Datadog alternative** focused on high-cardinality observability and debugging distributed systems.
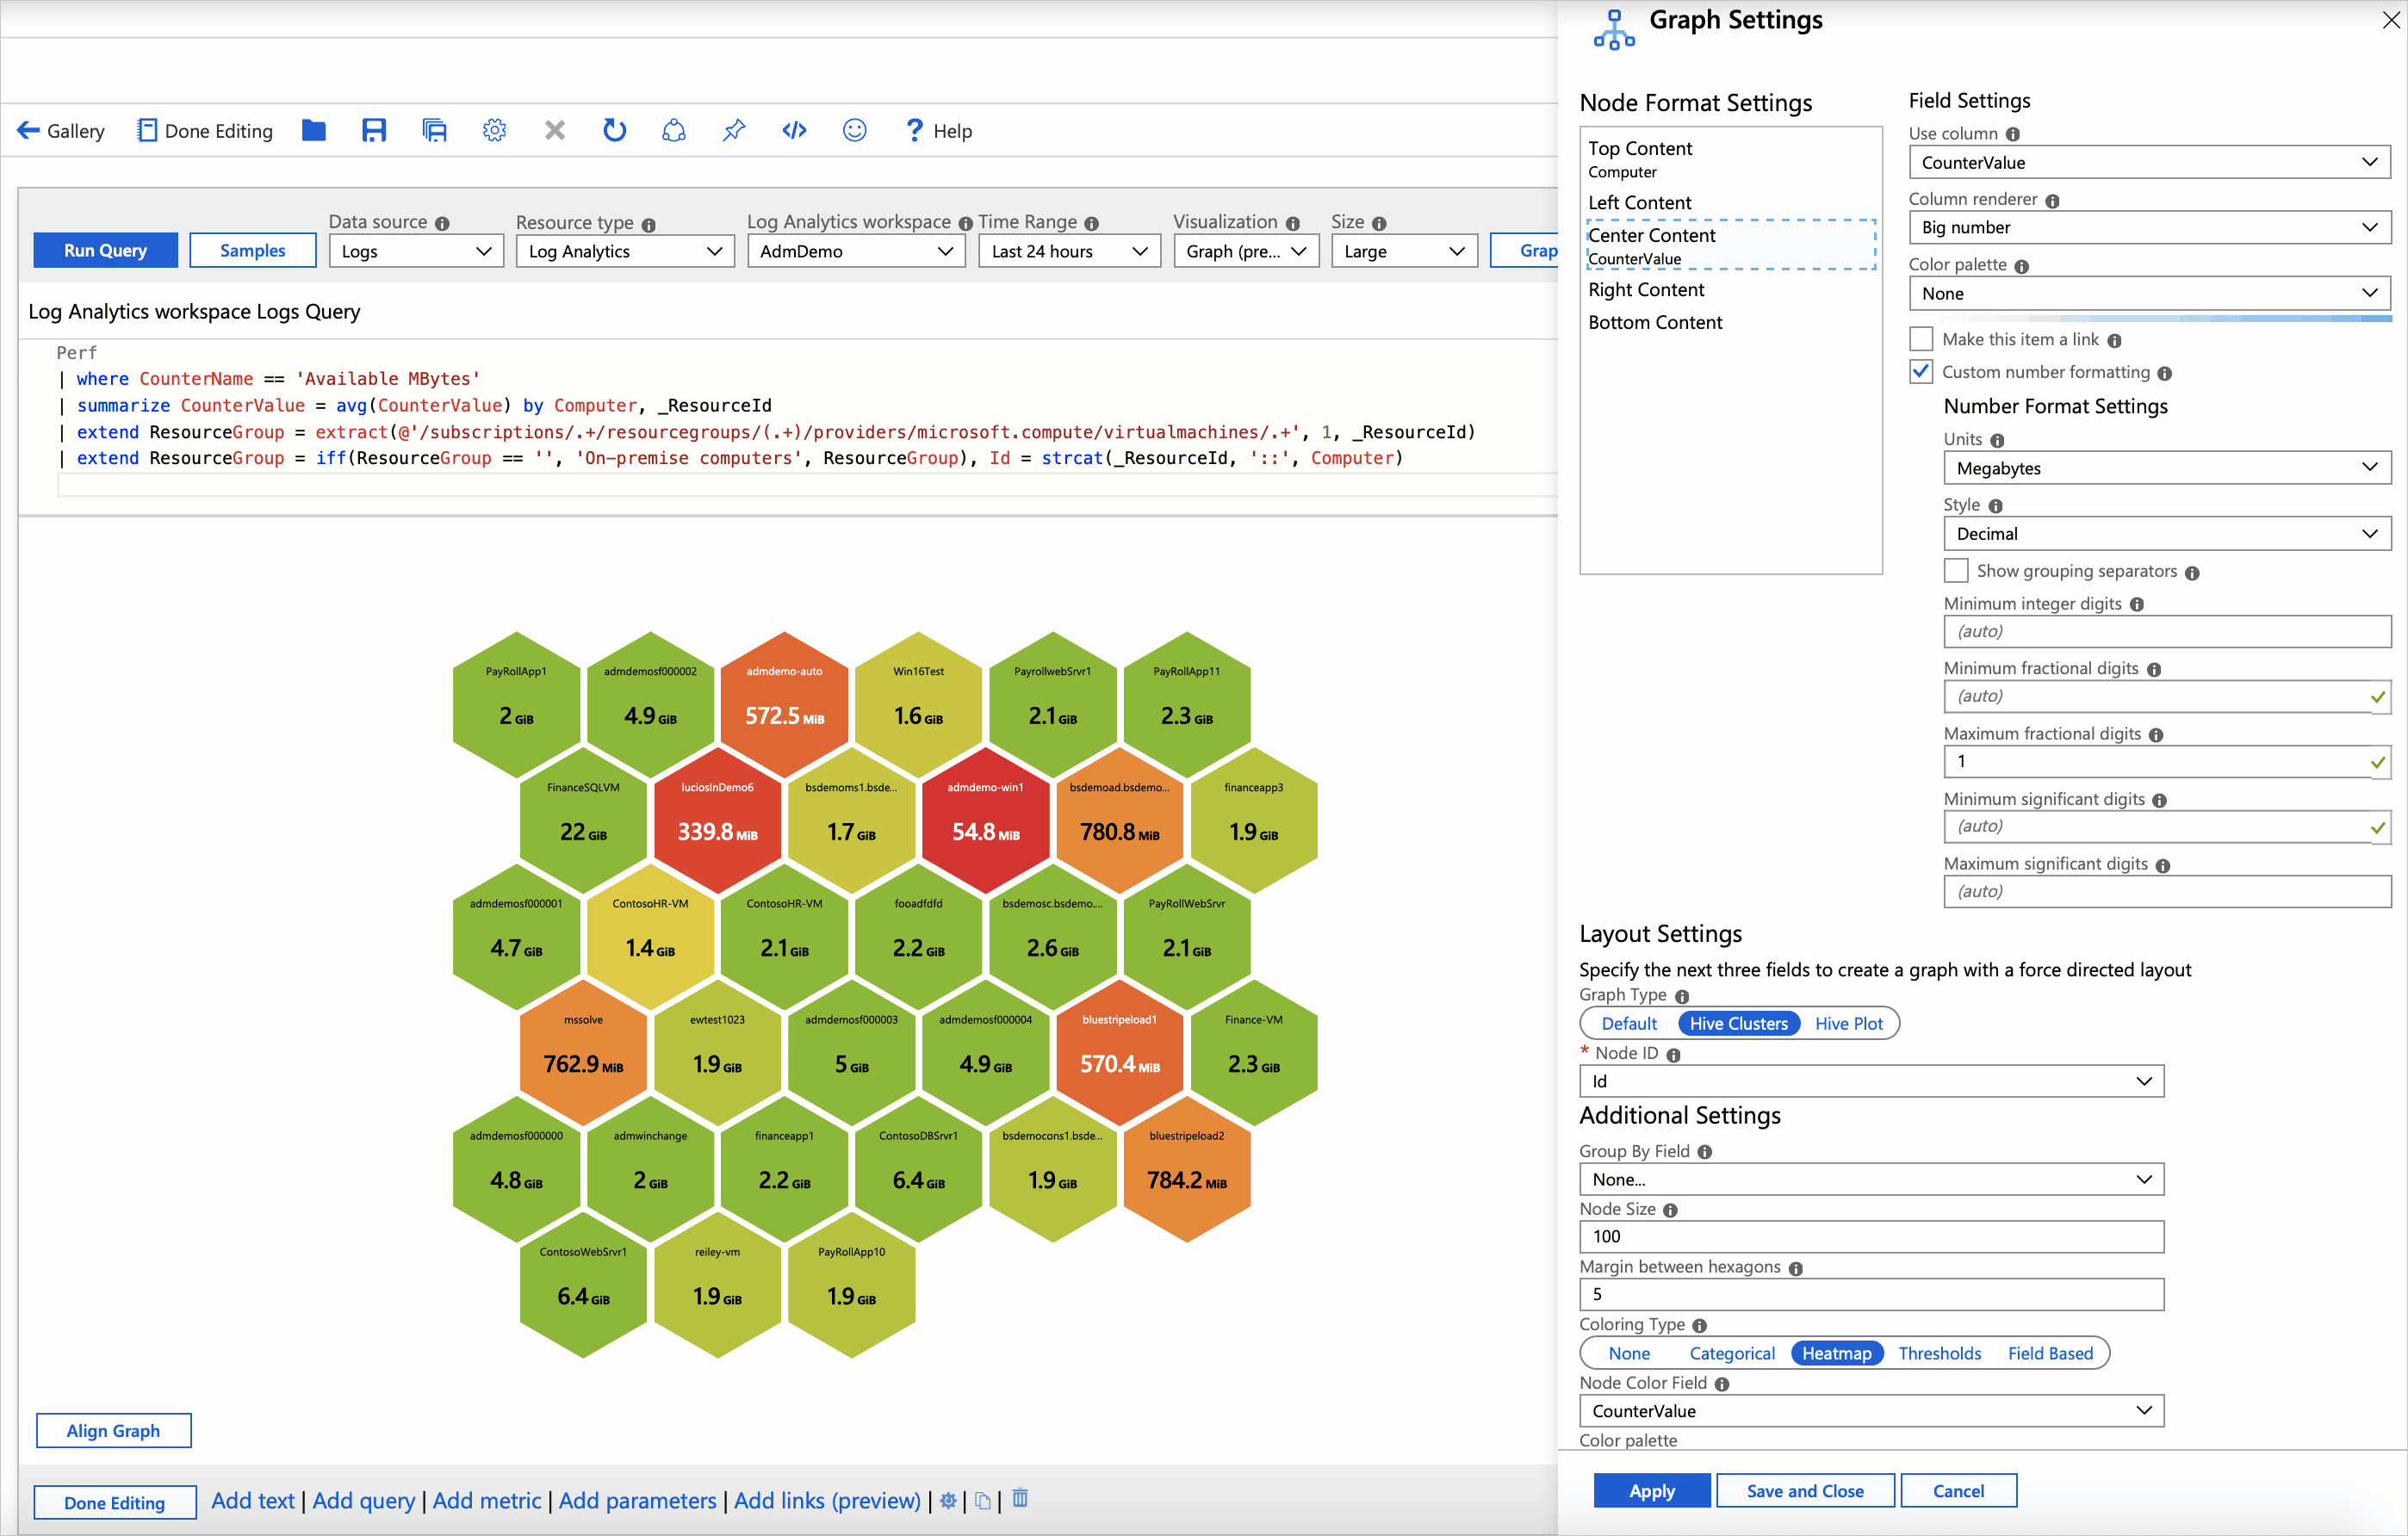
### **Honeycomb Pros:**
- **Excellent for Microservices Debugging:** Purpose-built for tracing and understanding complex request flows across distributed microservices.
- **High-Cardinality Friendly:** Handles high-cardinality dimensions (like user IDs and request IDs) without performance or cost blowups.
- **Fast Exploratory Queries:** Enables rapid, ad-hoc querying to investigate unknown issues in production.
- **Strong SLO & Burn Rate Workflows:** Provides first-class SLOs, error budgets, and burn-rate alerts tied to real request data.
- **Developer-Centric Experience:** Designed around developer and SRE workflows rather than infrastructure-only monitoring.
### **Honeycomb Cons:**
- SaaS-only (no self-hosted option)
- Less focus on traditional dashboards
- Pricing scales with event volume
- Different mental model than Datadog
### **Integration / Mitigation:**
- OpenTelemetry-native ingestion
- Can replace Datadog APM selectively
- Often used alongside infra monitoring tools
## **8. AppDynamics (Cisco)**
**AppDynamics** is an enterprise APM-focused **Datadog alternative**, particularly strong for business transaction monitoring.
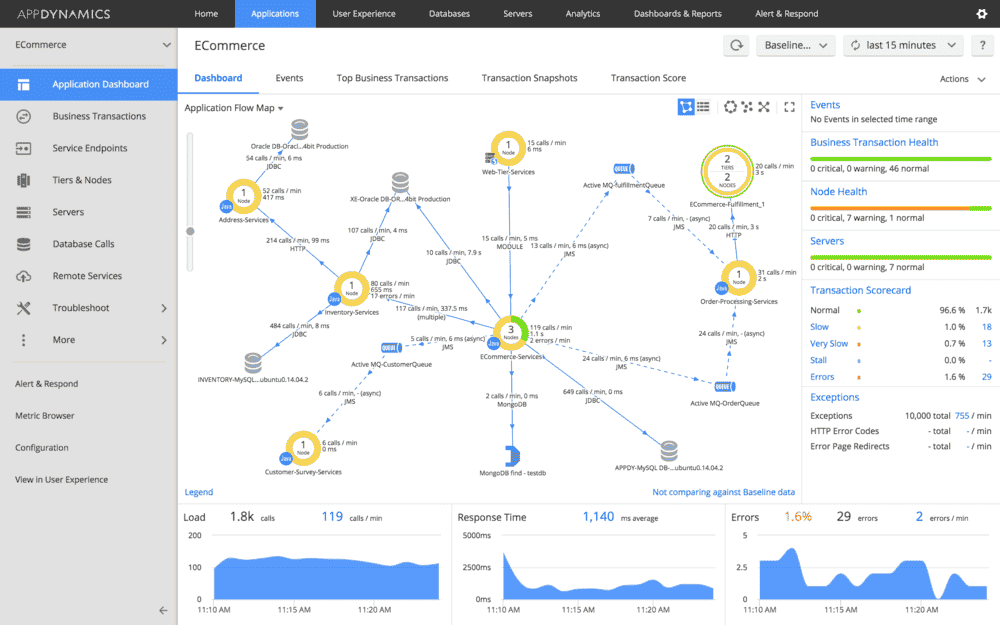
### **AppDynamics Pros:**
- **Deep Application Performance Monitoring:** Provides detailed code-level visibility into application performance and dependencies.
- **Business Transaction Visibility:** Maps technical performance directly to business transactions and user impact.
- **Tight Cisco Ecosystem Integration:** Seamlessly integrates with Cisco networking, security, and enterprise tooling.
- **Hybrid & Legacy System Friendly:** Works well across on-prem, hybrid, and legacy enterprise environments.
- **AI-Powered Root Cause Analysis:** Uses the Cognition Engine to automatically correlate anomalies and identify probable root causes.
### **AppDynamics Cons:**
- Expensive enterprise pricing
- Heavy agent-based approach
- Less cloud-native than Datadog
### **Integration / Mitigation:**
- Agent-based migration from Datadog APM
- OpenTelemetry support improving
- Best for enterprises prioritizing APM over infra metrics
## **9. Zabbix**
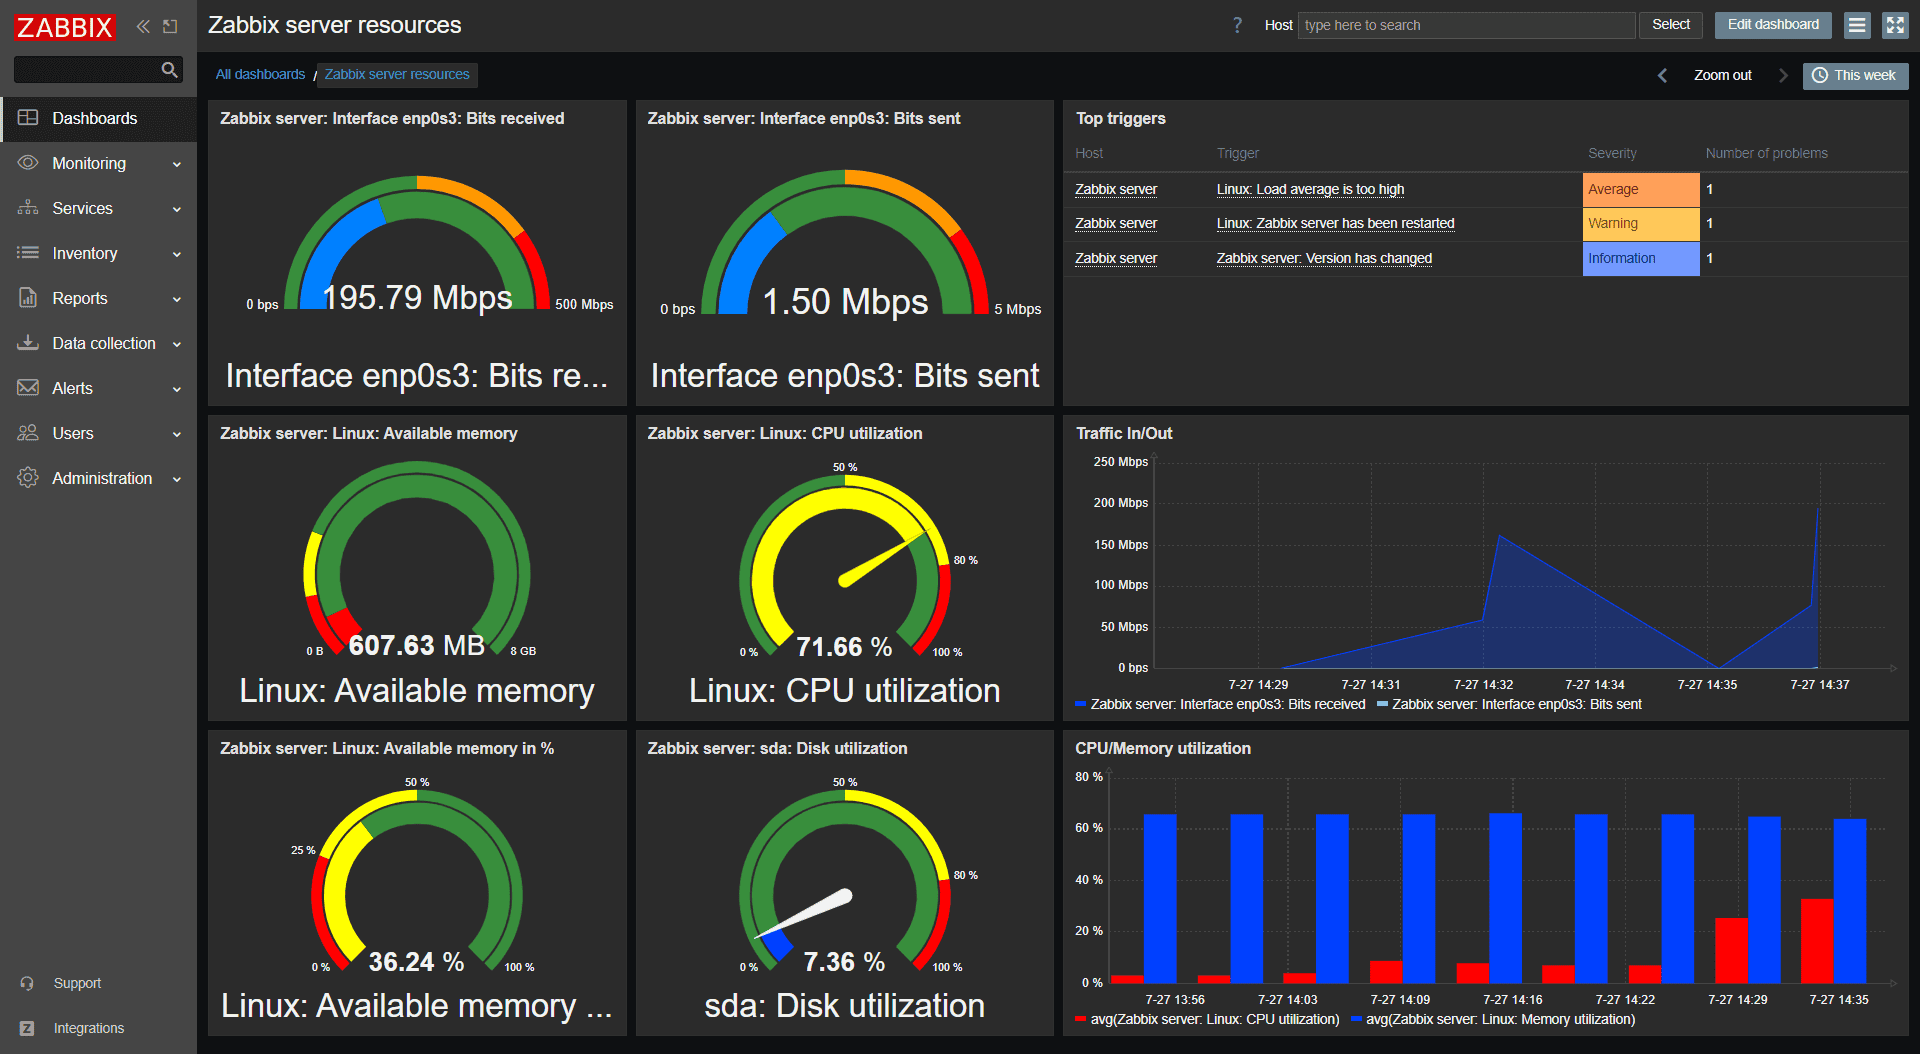
**Zabbix** is an open-source **Datadog alternative for infrastructure monitoring**, particularly popular in on-prem and hybrid environments.
### **Zabbix Pros:**
- **Completely Free & Open Source:** Fully open-source with no licensing costs or feature gating.
- **Excellent Host & Network Monitoring:** Strong at monitoring servers, networks, and traditional infrastructure.
- **Strong Alerting and Escalations:** Offers robust alerting rules with flexible escalation policies.
- **Predictable Costs:** Self-hosted model ensures stable and predictable operational costs.
- **Very Stable and Mature:** Battle-tested platform with years of production use in enterprise environments.
### **Zabbix Cons:**
- Not a full Datadog replacement for APM or tracing
- Limited native log analytics
- UI feels dated
- Not OpenTelemetry-native
### **Integration / Mitigation:**
- Often paired with Grafana for dashboards
- Can coexist with OpenTelemetry-based tools
- Best used as infra monitoring layer
## **10. Uptrace**
**Uptrace** is an OpenTelemetry-native **Datadog alternative** focused on tracing and lightweight APM.
### **Uptrace Pros:**
- **Built for OpenTelemetry from Day One:** Native OpenTelemetry support for traces, metrics, and logs without adapters.
- **Excellent Tracing Performance:** Fast trace ingestion and querying optimized for distributed systems.
- **Cost-Effective ClickHouse Backend:** Uses ClickHouse for efficient storage and high-performance analytics at lower cost.
- **Self-Hosted or Cloud:** Flexible deployment options to run it yourself or use managed Uptrace Cloud.
- **Simple and Clean UI:** Minimal, intuitive interface focused on tracing and debugging workflows.
### **Uptrace Cons:**
- Smaller ecosystem
- Less mature alerting than Datadog
- Limited enterprise features
- Narrower scope than full observability platforms
### **Integration / Mitigation:**
- Seamless Datadog APM replacement via OpenTelemetry
- Docker and Kubernetes friendly
- Often paired with separate metrics/log tools
## **Comparison Table: Datadog Alternatives**
| Tool | Deployment | Metrics | Logs | Traces | Pricing Model | Why Teams Choose It Over Datadog | Migration Ease |
| ------------------------------------------------ | ------------------- | ------- | ---- | ------ | ---------------------------- | ----------------------------------------------------------------------------- | ------------------------------- |
| **[OpenObserve](https://cloud.openobserve.ai/)** | Self-hosted / Cloud | ✅ | ✅ | ✅ | Open Source + Low-cost Cloud | Datadog-like unified observability **without usage-based pricing or lock-in** | ⭐⭐⭐⭐⭐ (OTel-native) |
| **Grafana Stack** | Self-hosted / Cloud | ✅ | ✅ | ✅ | OSS + Managed | Replace Datadog with **modular, open tooling** | ⭐⭐⭐⭐ (Multiple components) |
| **[New Relic](/newrelic-alternative/)** | SaaS | ✅ | ✅ | ✅ | Usage-based SaaS | Familiar APM UX, easier switch for Datadog users | ⭐⭐⭐⭐⭐ (Similar model) |
| **[Dynatrace](/dynatrace-alternative/)** | SaaS / Hybrid | ✅ | ✅ | ✅ | Host / Unit-based | Enterprise-grade automation Datadog lacks | ⭐⭐⭐⭐ (Auto-instrumentation) |
| **Elastic Observability** | Self-hosted / Cloud | ✅ | ✅ | ✅ | Data / Host-based | Strong search-first alternative to Datadog logs | ⭐⭐⭐ (More ops work) |
| **Splunk Observability** | SaaS / On-prem | ✅ | ✅ | ✅ | Data-volume based | Compliance-heavy, security-focused environments | ⭐⭐⭐ (Different data model) |
| **Honeycomb** | SaaS | ⚠️ | ⚠️ | ✅ | Event-based | Better **high-cardinality tracing** than Datadog | ⭐⭐⭐⭐⭐ (OTel-native) |
| **AppDynamics** | SaaS / On-prem | ✅ | ✅ | ✅ | Unit-based | Legacy enterprise Datadog replacement | ⭐⭐⭐ (Agent-heavy) |
| **Uptrace** | Self-hosted / Cloud | ✅ | ✅ | ✅ | Open Source + Cloud | Lightweight Datadog-style APM at lower cost | ⭐⭐⭐⭐⭐ (OTel-native) |
## **How to Choose the Right Datadog Alternative Tool**
Selecting the right Datadog alternatives depends on several factors:
### **1. Budget Constraints**
- **Tight budget?** Consider open source: OpenObserve, Grafana Stack
- **Moderate budget?** New Relic or managed Grafana Cloud
- **Enterprise budget?** Dynatrace, AppDynamics, or Splunk
### **2. Deployment Preference**
- **Self-hosted required?** OpenObserve, Grafana Stack, Elastic
- **SaaS preferred?** New Relic, Honeycomb, Dynatrace
- **Hybrid needed?** Dynatrace, Elastic, AppDynamics
### **3. Technical Expertise**
- **Strong ops team?** Open source options offer maximum flexibility
- **Limited resources?** Managed SaaS solutions reduce operational burden
- **Developer-focused?** Honeycomb, OpenObserve
### **4. Primary Use Case**
- **General observability:** OpenObserve, New Relic, Grafana Stack
- **APM-focused:** Dynatrace, AppDynamics, New Relic
- **Log analytics:** Elastic, Splunk, OpenObserve
- **Distributed tracing:** Honeycomb, Uptrace, OpenObserve
- **Security + observability:** Splunk, Elastic
### **5. Migration Strategy**
- **Quick migration:** Choose OpenTelemetry-native tools (OpenObserve, Honeycomb)
- **Gradual transition:** Start with one signal type (logs or metrics)
- **Parallel running:** Run new tool alongside Datadog during evaluation
### **6. Scale Requirements**
- **Small to medium:** Most options will work; prioritize ease of use
- **Large scale:** Consider OpenObserve, Grafana Stack, or enterprise platforms
- **High cardinality:** Honeycomb, OpenObserve, or ClickHouse-based solutions
## Migrating from Datadog to OpenObserve
Migrating from Datadog to OpenObserve can be done incrementally using OpenTelemetry, without rewriting your existing instrumentation. By routing Datadog metrics through the OpenTelemetry Collector, teams can standardize on OTLP while gaining full control over data, costs, and storage. This approach allows you to run Datadog and OpenObserve side by side during migration, validate metrics parity, and gradually transition dashboards and alerts, all while avoiding vendor lock-in.
Read the full walkthrough here: [Migrating from Datadog to OpenObserve](https://openobserve.ai/blog/migrate-datadog-metrics-openobserve-opentelemetry/)
## Datadog Alternatives: What the Numbers Show
- **60-98% cost reduction** is achievable in real production deployments when moving from Datadog's per-host model to an ingestion-based platform like OpenObserve
- **OpenTelemetry is the migration unlock:** teams that instrumented with OTel first switched backends as a config change, not an engineering project
- **Self-hosted is production-viable:** OpenObserve, Grafana Stack, Elastic, and Uptrace all run at production scale on your own infrastructure with zero per-host licensing
- **New Relic is the fastest SaaS-to-SaaS switch** for teams that can't absorb the operational overhead of self-hosting
- **Pilot on non-critical services first:** dual-ship telemetry to both Datadog and your new tool for 2-4 weeks before cutting over dashboards and alerts
For specific use cases, see our [top 10 Kubernetes monitoring tools guide](/blog/top-10-k8s-monitoring-tools/) and [top 10 APM tools comparison](/blog/top-10-apm-tools/).
## **Take the Next Step**
Ready to explore the best Datadog alternative tool?
**Try OpenObserve**: Start with the[ open source version](https://openobserve.ai/downloads/) or sign up for[ OpenObserve Cloud](https://cloud.openobserve.ai/)