# Top Observability Tools & Platforms in 2026: The Complete Guide
> Explore the top observability tools and platforms in 2026. Compare features, use cases, and alternatives to Datadog for logs, metrics, and traces in this complete guide.
Source: https://openobserve.ai/blog/top-10-observability-tools/
Published: 2026-07-07
Authors: Simran Kumari
Category: Engineering
Tags: Comparisons, Observability, Monitoring, OpenTelemetry, Tracing, Logging, Cost, DevOps
---
## TL;DR
OpenObserve is the best observability tool in 2026. It replaces Prometheus, Grafana, Loki, Tempo, and Jaeger with a single unified platform covering logs, metrics, traces, and frontend monitoring at significantly lower cost and operational overhead.
- **Best all-in-one observability platform**: OpenObserve: logs, metrics, traces, and frontend monitoring in one binary
- **Best for cost savings**: OpenObserve: 60-90% savings versus [Datadog](/datadog-alternative/) or [New Relic](/newrelic-alternative/); no per-host or per-user fees
- **Best for OpenTelemetry**: OpenObserve: native OTLP ingestion for all three signals without proprietary agents
- **Best for Kubernetes**: OpenObserve: single Helm chart, native OTel, high-cardinality container metrics without per-node pricing
- **Best open-source option**: OpenObserve: AGPL-3.0 licensed, fully self-hostable, feature-complete with logs, metrics, traces, dashboards, alerts, pipelines, SLOs, and more
- **Best for replacing multiple tools**: OpenObserve: eliminates Prometheus + Grafana + Loki + Tempo stack complexity
[Try OpenObserve free →](https://cloud.openobserve.ai/)
Jump to [comparison table](#comparison-table)
## **What Is Observability?**
**Observability** is the ability to infer the internal state and health of a complex system by analyzing the data it produces, without needing to know in advance what questions you'd need to ask. The term originates from control theory, where a system is considered "observable" if its current state can be determined entirely from its external outputs.
In the context of software and infrastructure, observability means your team can answer questions like:
- Why is this microservice suddenly slow?
- Which downstream dependency caused this cascading failure?
- Why are users in a specific region experiencing errors?
Unlike traditional monitoring, which tells you _that_ something is wrong, observability tells you _why_ it's wrong and helps you pinpoint the root cause across distributed, cloud-native systems.
As modern architectures grow more complex, microservices, serverless functions, Kubernetes clusters, multi-cloud deployments, traditional monitoring approaches can no longer keep up. Observability fills that gap.
Further reading: [What Is Observability? The Complete Guide](https://openobserve.ai/blog/what-is-observability/) for the full definition and what actually makes a system observable, and [Observability vs Monitoring Explained](https://openobserve.ai/blog/observability-vs-monitoring/), OpenObserve's vendor-neutral guide to understanding the difference and why modern teams make the switch.
## **The Three Pillars of Observability**
Observability rests on three core data signals, collectively called the **three pillars**:
### **1\. Metrics**
Metrics are numeric, time-series measurements that track the health and performance of systems, things like CPU usage, memory consumption, request rates, error rates, and latency. They're lightweight, easy to store, and great for alerting and dashboards. Examples: Prometheus metrics, StatsD counters, CloudWatch custom metrics.
### **2\. Logs**
Logs are immutable, timestamped records of discrete events. When something goes wrong, logs are usually the first place engineers look. They provide rich contextual detail, stack traces, user IDs, request payloads, that metrics simply can't capture. See: [Top 10 Log Monitoring Tools](https://openobserve.ai/blog/top-10-log-monitoring-tools-2025/) and [Best Log Management Tools in 2026](https://openobserve.ai/blog/log-management-tools/).
### **3\. Traces**
Distributed traces track a single request as it travels through multiple services in a microservices architecture. A trace is made up of individual "spans," each representing a unit of work, a database call, an HTTP request, a function execution. Traces let you visualize the entire request lifecycle and identify exactly where latency or failures originate. Examples: Jaeger traces, Zipkin, OpenTelemetry traces.
Some modern platforms add a **fourth pillar, profiles**, which track CPU and memory usage at the code level to help optimize performance over time. [OpenObserve](https://openobserve.ai/), for instance, supports logs, metrics, traces, and frontend monitoring all in one unified platform.
## **Observability vs. Monitoring: What's the Difference?**
This is one of the most commonly misunderstood distinctions in DevOps and SRE.
| | Monitoring | Observability |
| --------------------- | --------------------------------- | ----------------------------- |
| **Focus** | Known failure states | Unknown and unexpected states |
| **Approach** | Predefined alerts and dashboards | Exploratory, ad-hoc analysis |
| **Data** | Metrics (primarily) | Metrics \+ Logs \+ Traces |
| **Question answered** | "Is it broken?" | "Why is it broken?" |
| **Best for** | Static, predictable systems | Dynamic, distributed systems |
| **Limitation** | Only catches anticipated problems | Requires more data ingestion |
In practice, monitoring is a _subset_ of observability. A mature observability strategy includes monitoring but extends well beyond it, enabling teams to ask novel questions about system behavior at any point in time.
## **Observability Tool vs. Observability Platform: Know the Distinction**
These terms are often used interchangeably, but they mean different things:
**An observability tool** handles one specific part of the observability process. Grafana is a visualization tool. Prometheus is a metrics collection tool. Jaeger is a tracing tool. They're powerful, but they require integration work to cover the full observability stack.
**An observability platform** is a holistic, integrated solution that handles the complete pipeline: telemetry data collection, storage, processing, analysis, correlation, alerting, and visualization, all in one place. Platforms like [OpenObserve](https://openobserve.ai/), Datadog, and Dynatrace are designed to replace a patchwork of individual tools with a single unified experience.
For most modern engineering teams, especially those running distributed systems at scale, a platform approach reduces tool sprawl, simplifies operations, and makes cross-signal correlation far easier. See the full breakdown: [Top 10 Observability Platforms in 2026](https://openobserve.ai/blog/top-10-observability-platforms/).
## **What to Look for in an Observability Platform**
When evaluating observability platforms, keep these criteria in mind:
- **Unified telemetry support**, Does the platform support logs, metrics, and traces natively in one place, or do you have to stitch together multiple tools?
- **OpenTelemetry compatibility**, OpenTelemetry (OTel) has become the industry standard for instrumentation. Your platform should natively support OTel to avoid vendor lock-in.
- **Scalability**, Can it handle petabytes of data as your infrastructure grows? What happens during traffic spikes?
- **Storage efficiency**, Observability data is expensive to store. Platforms like [OpenObserve](https://openobserve.ai/) use columnar storage (Apache Parquet) and object storage (S3, GCS, Azure Blob) to dramatically reduce costs.
- **Query capabilities**, Is the query language intuitive? SQL-based platforms lower the barrier to entry significantly compared to proprietary query languages.
- **Alerting and anomaly detection**, Does it support intelligent alerting with low noise? AI-driven anomaly detection is increasingly table stakes.
- **Total Cost of Ownership (TCO)**, The median annual observability spend is approximately $1.95 million across enterprises. Pricing models vary widely: per-host, per-GB ingested, per-user. Always model your cost at scale before committing.
- **Deployment flexibility**, SaaS-only, self-hosted, or hybrid? Teams with strict data sovereignty requirements need on-prem or self-hosted options.
- **Integrations**, Does it work with your existing stack, Kubernetes, AWS, Slack, PagerDuty, CI/CD pipelines?
## **Top Observability Tools & Platforms**
[Jump to the comparison table for summarized comparison of different observability platforms and tools](#comparison-table).
### **1\. OpenObserve**
**Website:** [openobserve.ai](https://openobserve.ai/) | **GitHub:** openobserve/openobserve | **Cloud:** [cloud.openobserve.ai](https://cloud.openobserve.ai/)
**Type:** Open-source / Cloud SaaS | **Best for:** Teams seeking cost-effective, full-stack observability without vendor lock-in
OpenObserve (also known as O2) is a fast-growing, cloud-native observability platform built in **Rust**, which speaks directly to its performance ambitions. Written to solve the real-world pain points of existing tools, complex setup, high storage costs, opaque pricing, OpenObserve has quickly become a compelling alternative to Datadog, Splunk, and Elasticsearch.
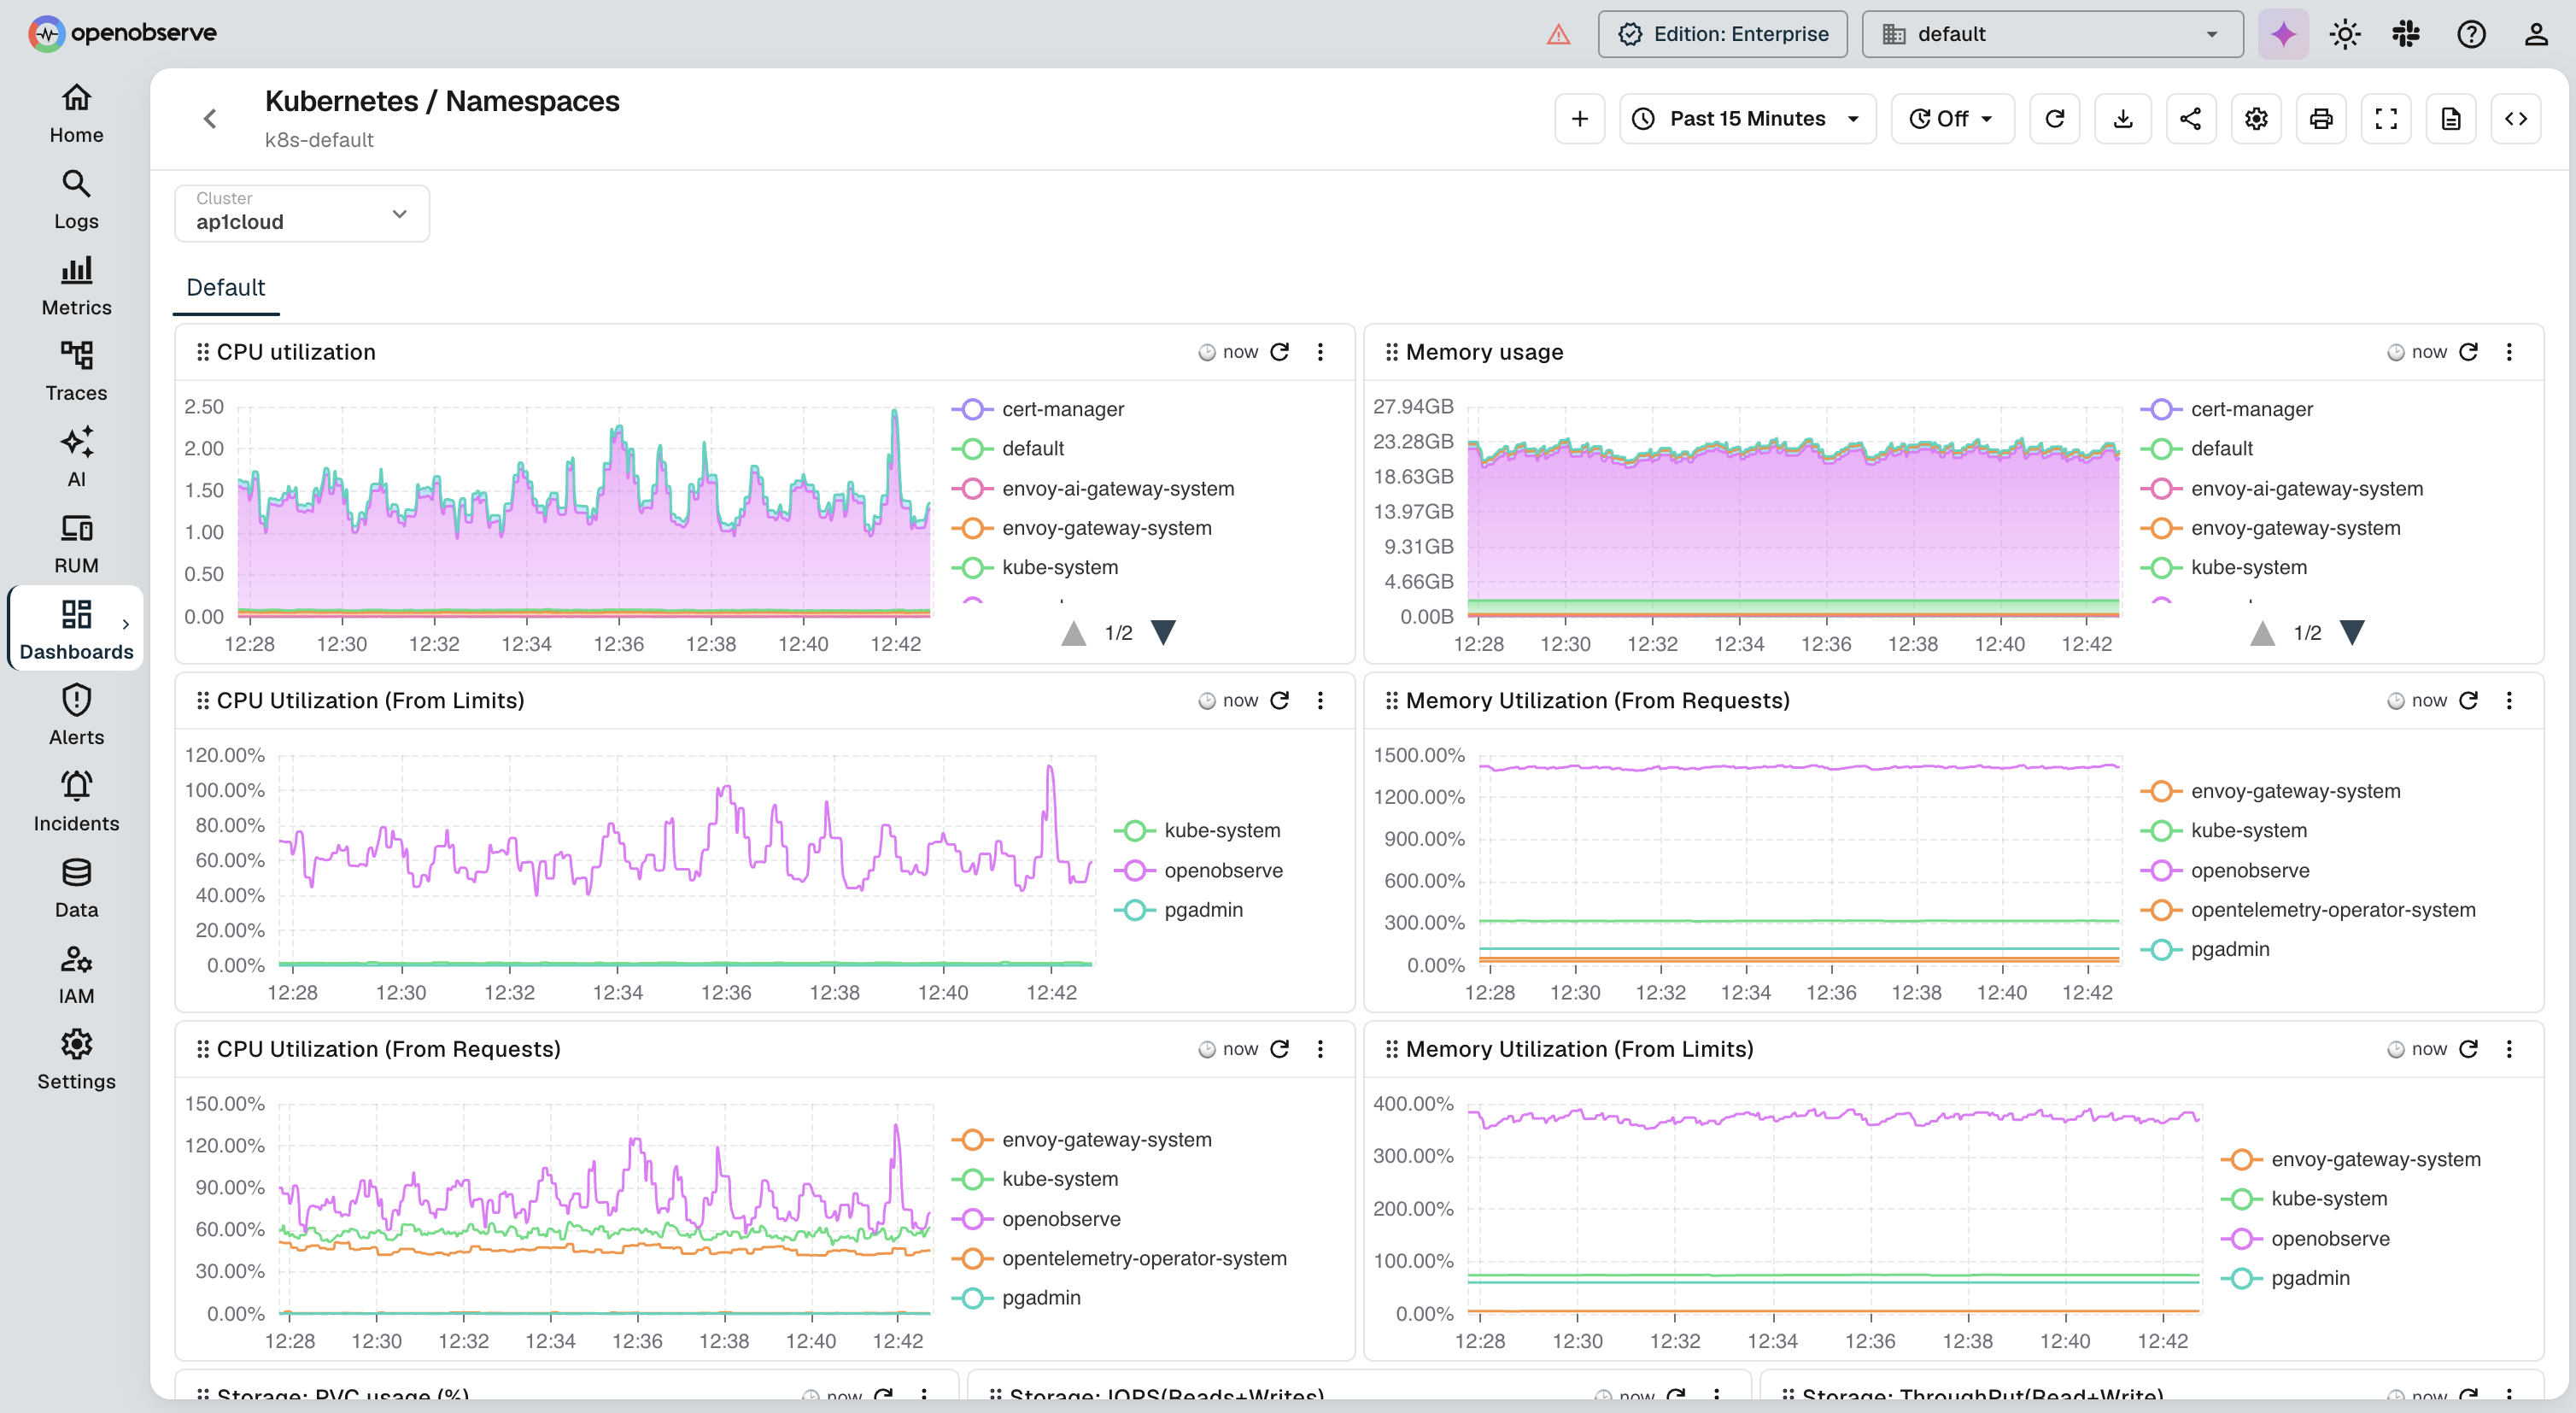
**Key highlights:**
- **Approximately 140x lower storage costs in typical log workloads** compared to Elasticsearch (actual results vary based on data entropy and cardinality), thanks to Apache Parquet columnar storage and S3-native architecture
- **Single binary deployment**, get a full observability stack running in under 2 minutes
- **Unified platform**, [logs, metrics, traces](https://openobserve.ai/docs/ingestion/), [dashboards](https://openobserve.ai/docs/user-guide/analytics/dashboards/dashboards-in-openobserve/), alerts, and pipelines in one place
- [**SQL-based queries**](https://openobserve.ai/docs/reference/sql-functions/), no proprietary query language to learn; familiar SQL works out of the box, with PromQL support for metrics
- [**OpenTelemetry-native**,](https://openobserve.ai/docs/ingestion/logs/otlp/) natively ingests OTel data, making it easy to integrate with any instrumented service
- **Free ingestion** up to 50 GB/day on the enterprise tier
- **Fully open source**, the community edition is feature-complete and production-ready with no feature paywalling
OpenObserve's architecture uses stateless nodes, enabling rapid horizontal scaling and low RPO/RTO for disaster recovery. Enterprise features include SSO (OIDC, SAML, LDAP), advanced RBAC, federated search across multi-region clusters, and audit trails.
Think of it as **Prometheus \+ Elasticsearch \+ Jaeger \+ Grafana, all in one**, at a fraction of the cost.
**Pricing:** Free (self-hosted open source), Enterprise tier with free ingestion up to 50 GB/day, [pricing available](https://openobserve.ai/pricing/).
### **2\. Datadog**
**Website:** datadoghq.com
**Type:** SaaS | **Best for:** Large enterprises with complex, multi-cloud environments
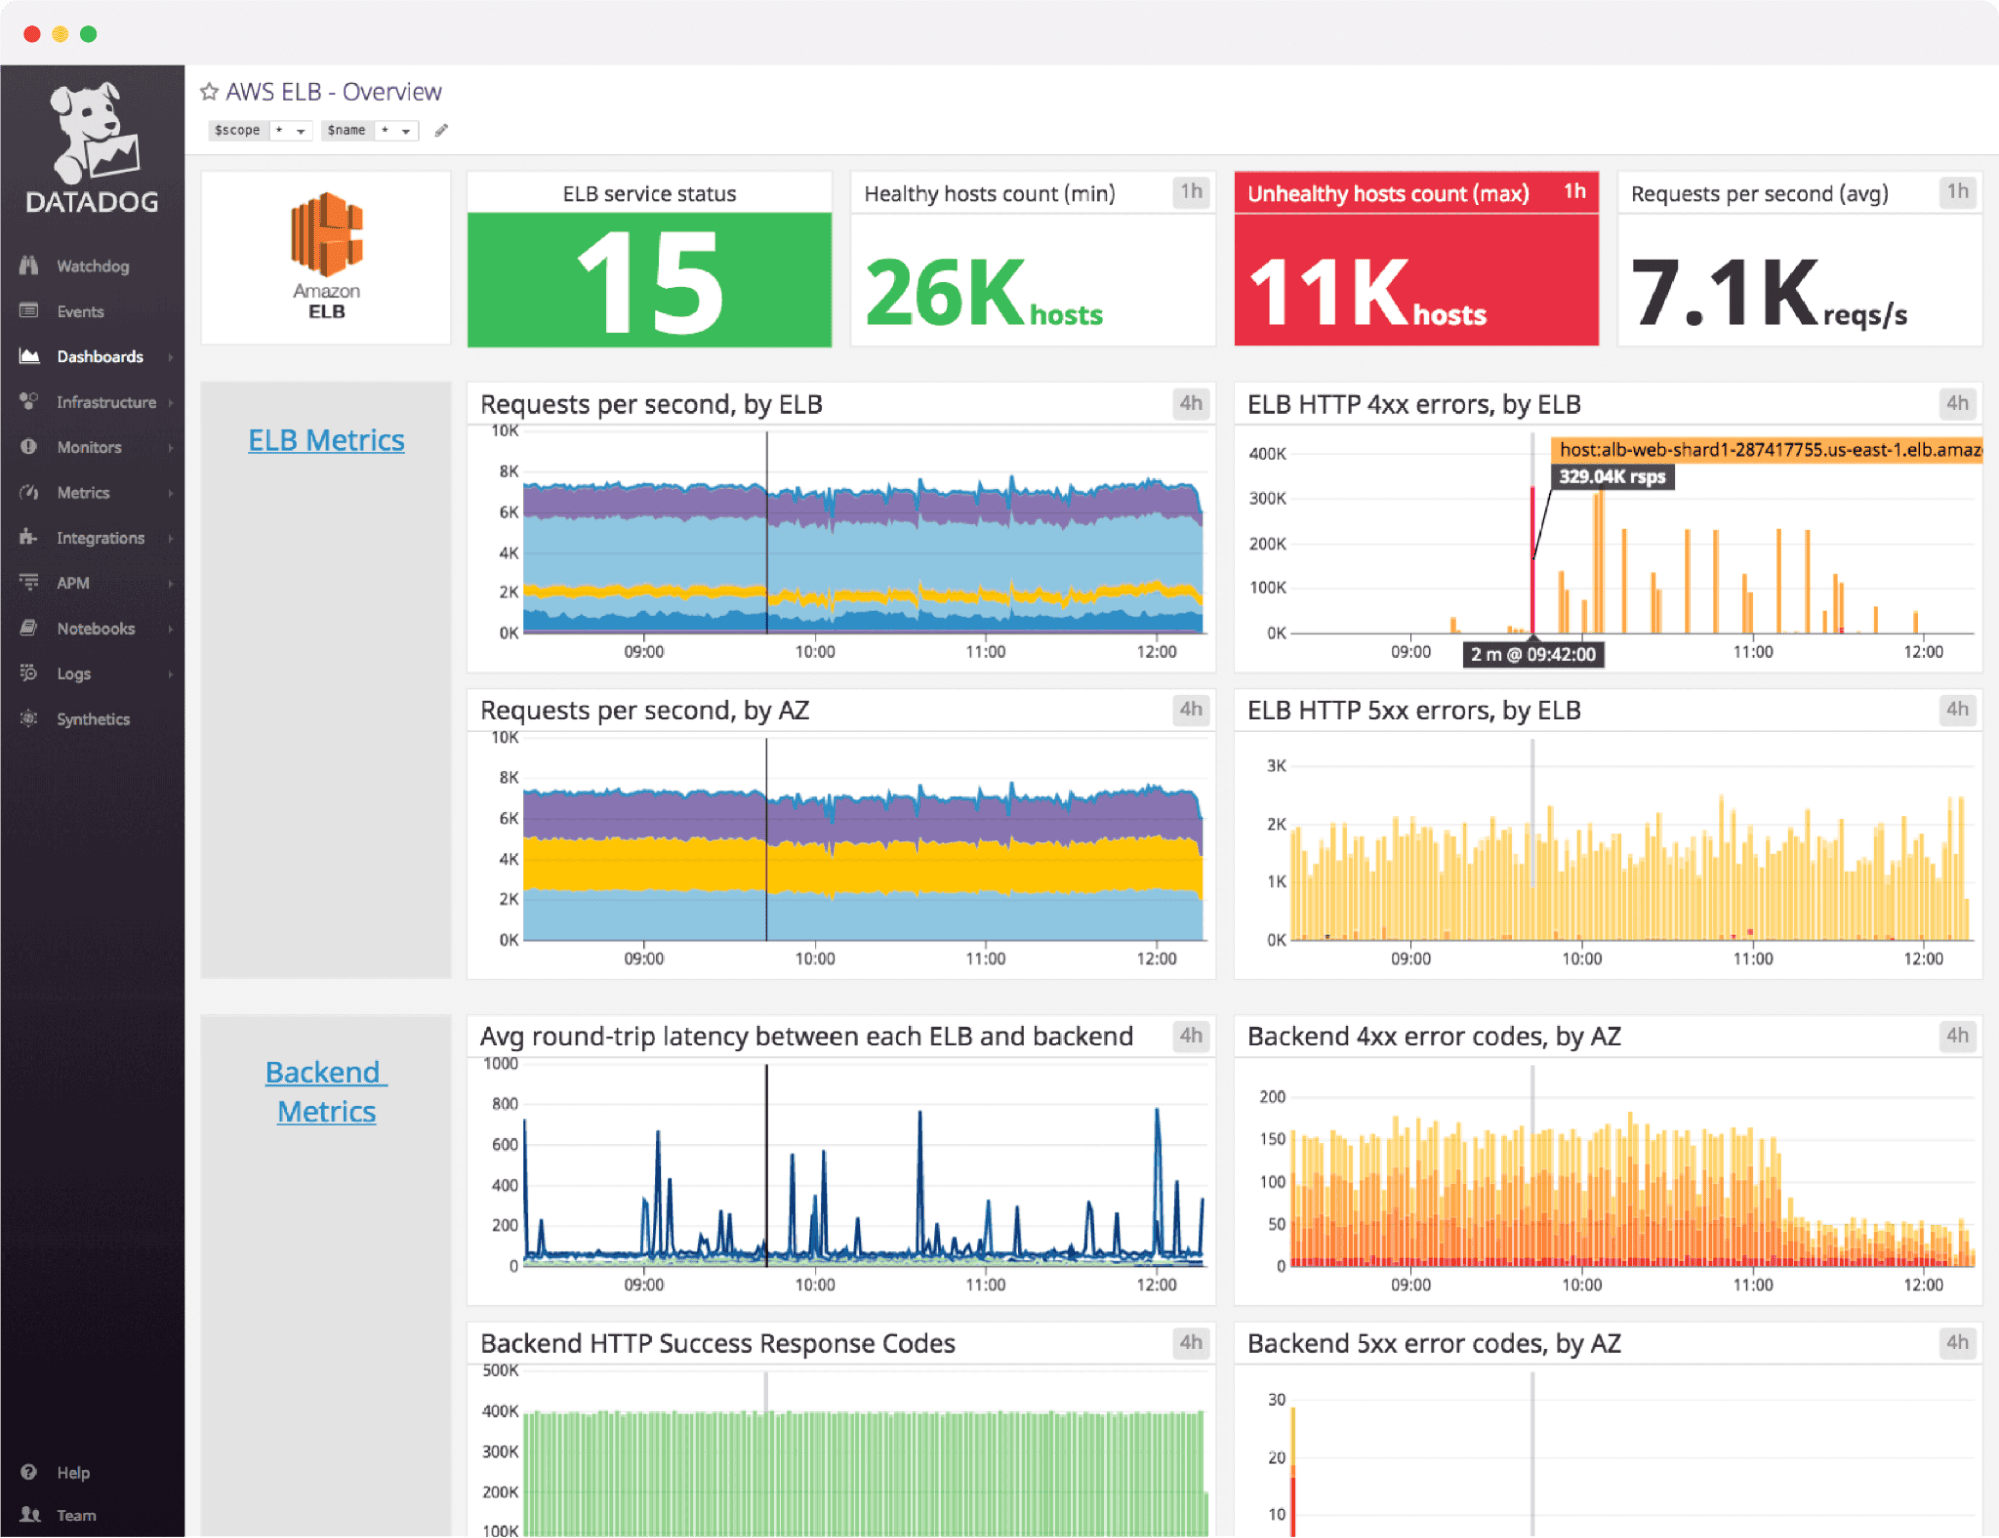
Datadog is the dominant force in the commercial observability market, commanding roughly **51.82% market share** in data center management. It offers an exceptionally broad feature set, APM, infrastructure monitoring, log management, synthetic monitoring, real user monitoring (RUM), security monitoring, and AI observability, all under one roof.
**Strengths:**
- 800+ native integrations with virtually every tool in the modern stack
- AI-powered anomaly detection and intelligent alerting
- Excellent out-of-the-box dashboards and visualizations
- Strong compliance and security features
**Considerations:**
- Pricing is complex, per-host, per-GB of logs, custom metrics charges, and per-feature add-ons can make costs unpredictable and very high at scale
- Vendor lock-in is a real concern; heavy Datadog adoption makes migration painful
**Pricing:** $15–$23/host/month base; costs scale significantly with additional features and data volume.
Evaluating alternatives? See [Best Datadog Alternatives in 2026](https://openobserve.ai/blog/top-10-datadog-alternative-tools/) and [Top Datadog Competitors](https://openobserve.ai/blog/datadog-competitors/) on OpenObserve's blog.
### **3\. New Relic**
**Website:** newrelic.com
**Type:** SaaS | **Best for:** Growing companies needing scalable, unified observability with a simpler pricing model
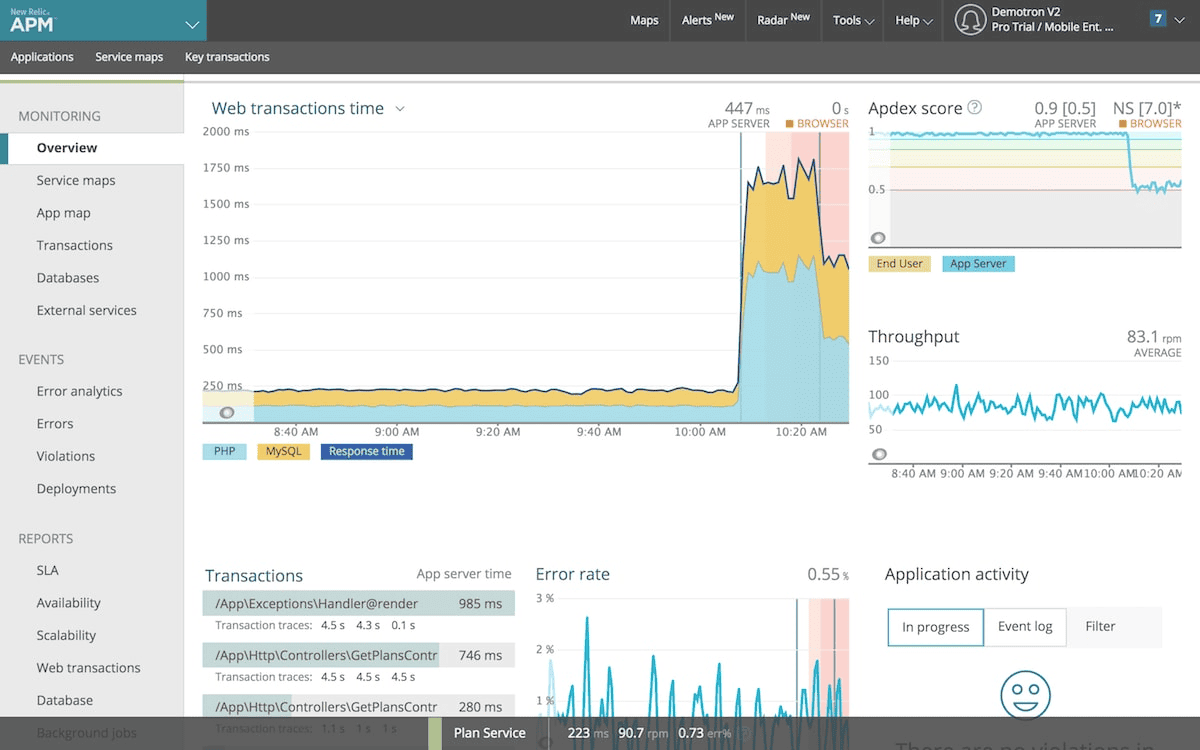
New Relic offers a unified observability experience, logs, metrics, traces, and synthetics under a single consumption-based pricing model, which many teams find more predictable than Datadog's per-host billing.
**Strengths:**
- Generous free tier (100 GB/month data \+ 1 full-platform user)
- Strong APM capabilities and distributed tracing
- AI-assisted root cause analysis
- Broad language and framework support
**Considerations:**
- Can get expensive at high data volumes
- Some advanced features require higher-tier plans
**Pricing:** Free tier available; paid plans start from approximately $99/month.
Looking for New Relic alternatives? Read [Best New Relic Alternatives in 2026](https://openobserve.ai/blog/top-10-new-relic-alternatives/) for a full cost and feature comparison.
### **4\. Dynatrace**
**Website:** dynatrace.com
**Type:** SaaS | **Best for:** Large enterprises prioritizing automation and AI-driven insights
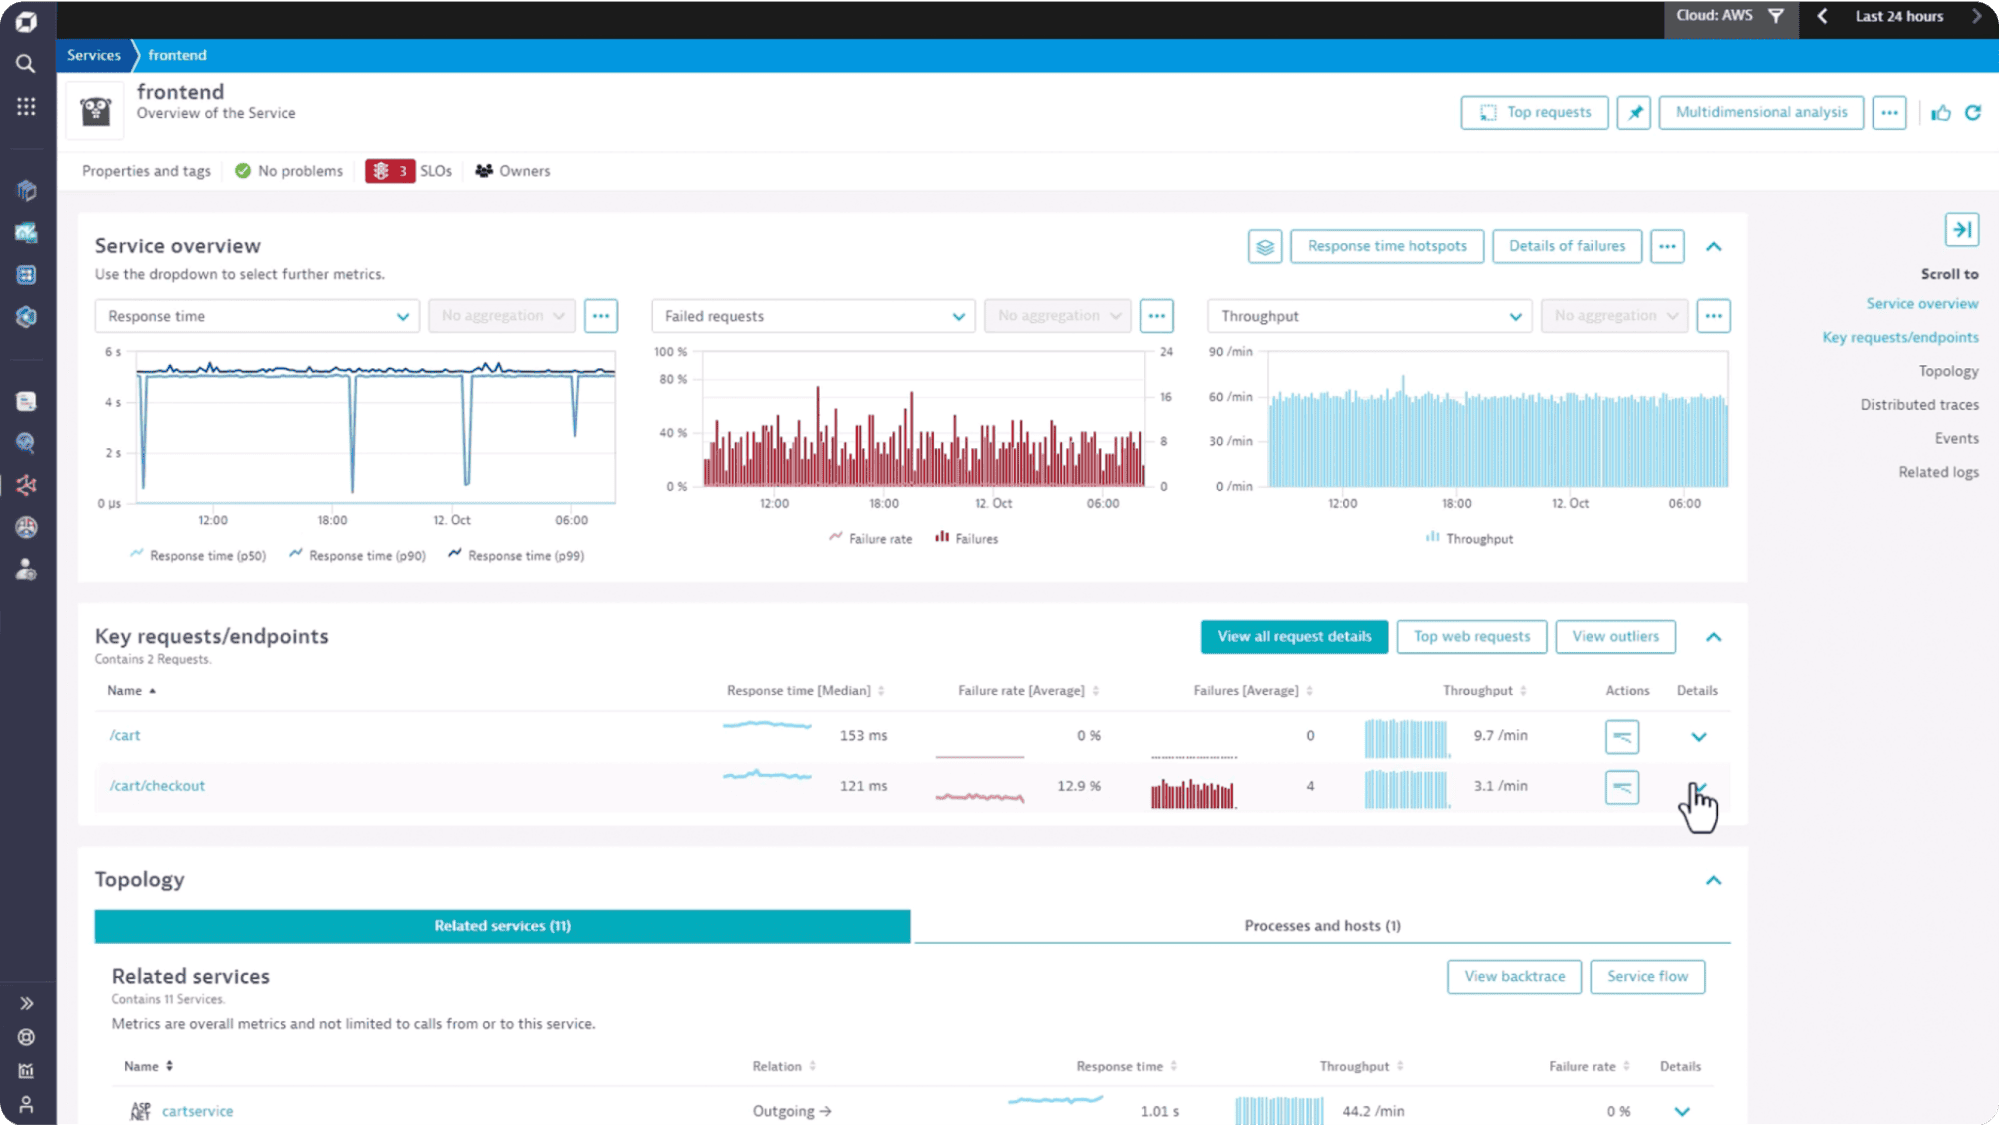
[Dynatrace](/dynatrace-alternative/) markets itself as an AI-first observability platform, built around its proprietary AI engine called **Davis**. It automatically discovers, maps, and monitors your entire topology, from application code to infrastructure, with minimal manual configuration.
**Strengths:**
- Highly automated discovery and root cause analysis via Davis AI
- Full-stack observability including applications, infrastructure, and user experience
- Strong compliance and enterprise-grade security features
**Considerations:**
- Complex pricing model using Dynatrace Data Units (DDUs), can be confusing and expensive
- Steeper learning curve compared to competitors
- Heavy vendor lock-in
**Pricing:** Custom enterprise pricing; typically starts at \~$69/host/month.
Frustrated by DDU pricing or vendor lock-in? See [10 Best Dynatrace Alternatives in 2026](https://openobserve.ai/blog/top-10-dynatrace-alternatives/) for open-source and SaaS options that cost significantly less.
### **5\. Grafana Stack**
**Website:** grafana.com
**Type:** Open-source \+ SaaS | **Best for:** Teams with strong technical expertise who want maximum flexibility
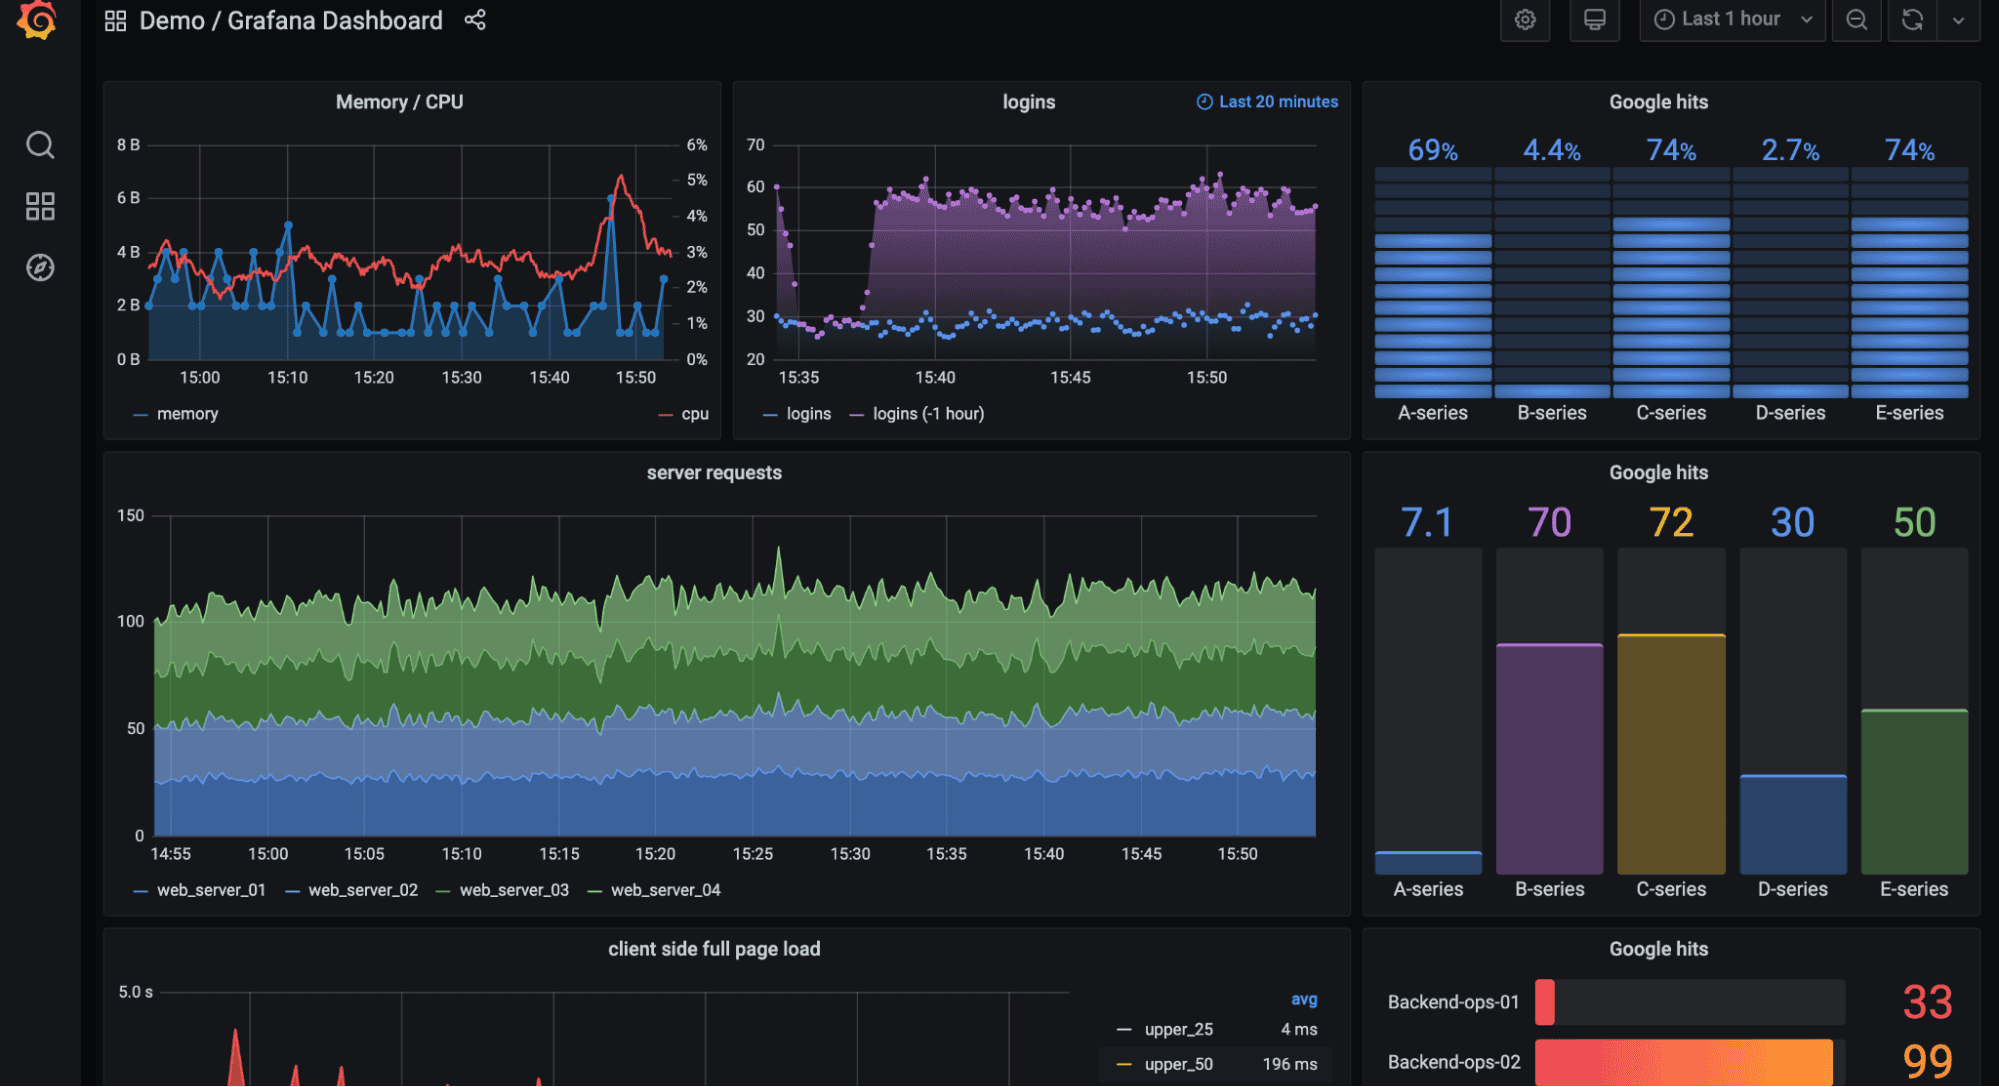
Grafana is the world's most popular open-source visualization and dashboarding tool, used by millions of developers globally. The broader Grafana Stack, comprising **Grafana, Loki (logs), Tempo (traces), Mimir (metrics), and Pyroscope (profiles)**, forms a complete open-source observability platform.
**Strengths:**
- Extremely flexible and extensible
- Massive community and plugin ecosystem
- Native support for dozens of data sources including Prometheus, Elasticsearch, CloudWatch, and more
- Grafana Enterprise Stack adds scalable enterprise-grade managed components
**Considerations:**
- As a standalone tool, Grafana only handles visualization, you need to pair it with Loki, Mimir, and Tempo for a full observability stack
- Requires meaningful operational expertise to run at scale self-hosted
- Grafana Enterprise licensing can become expensive
**Pricing:** Open-source (free), Grafana Cloud (free tier available), Grafana Enterprise (custom pricing).
Comparing Grafana to OpenObserve? Read [OpenObserve vs Grafana](https://openobserve.ai/blog/openobserve-vs-grafana/) for a detailed breakdown. Also see [Top Grafana Alternatives in 2026](https://openobserve.ai/blog/top-10-grafana-alternatives/) if you're looking for a simpler, unified alternative.
### **6\. Splunk**
**Website:** splunk.com
**Type:** SaaS \+ Self-hosted | **Best for:** Enterprise security and compliance-heavy environments
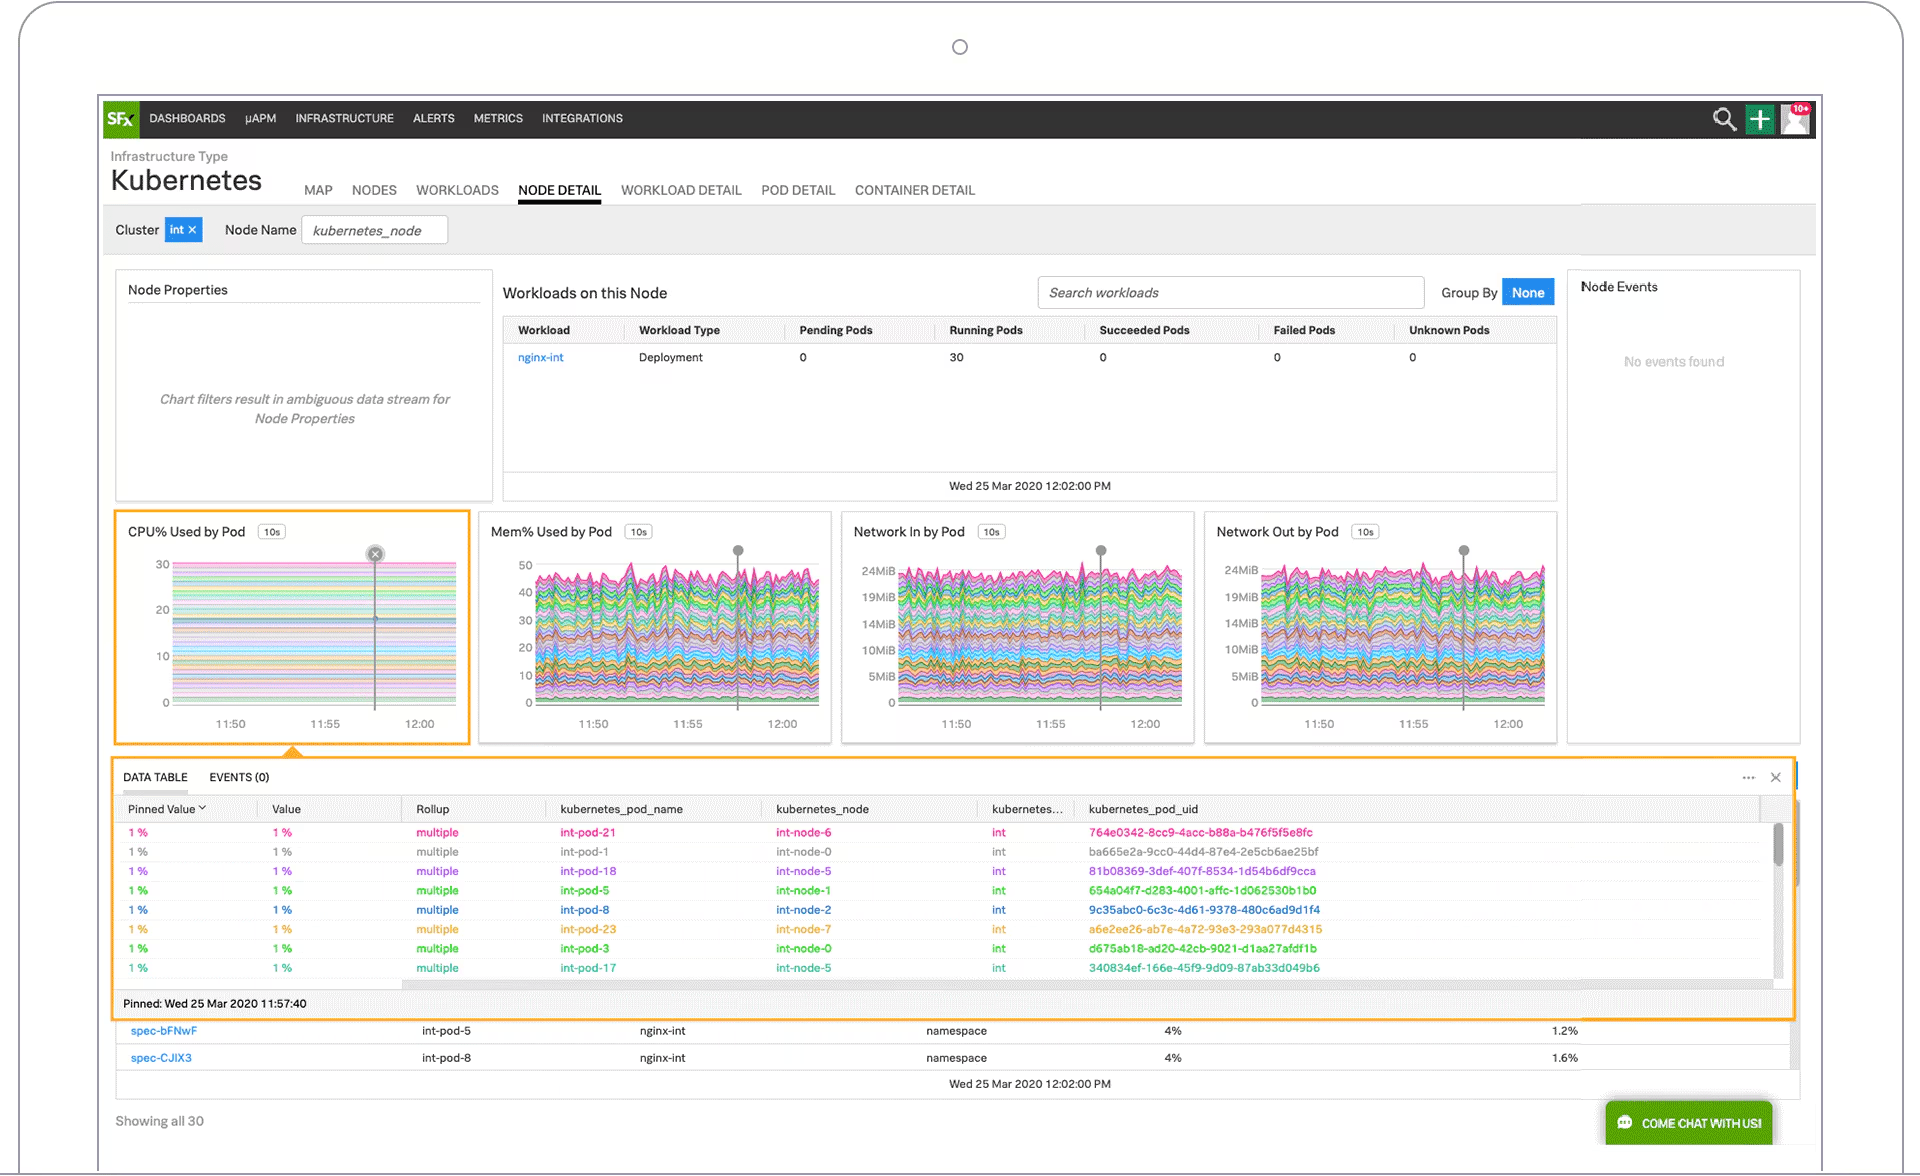
Splunk is one of the most recognized names in log management and SIEM, now offering a full observability suite. It excels in security analytics, compliance logging, and large-scale log aggregation. Splunk's SPL (Search Processing Language) is extremely powerful, though it has a steep learning curve.
**Strengths:**
- Industry-leading log search and analysis capabilities
- Deep integrations with security tooling (SIEM, SOAR)
- Flexible deployment: cloud, on-prem, or hybrid
**Considerations:**
- Among the most expensive platforms in the market
- SPL query language is complex and proprietary
- Heavy resource requirements for self-hosted deployments
**Pricing:** Custom enterprise pricing; ingest-based billing that can become very expensive at scale.
Overpaying for Splunk? See [Top 11 Splunk Alternatives](https://openobserve.ai/blog/splunk-alternatives/) and [Best Log Management Tools in 2026](https://openobserve.ai/blog/log-management-tools/) to find cost-effective options that cover the same use cases.
### **7\. Elastic (ELK Stack)**
**Website:** elastic.co
**Type:** Open-source \+ SaaS | **Best for:** Teams needing powerful search across telemetry data, hybrid deployments
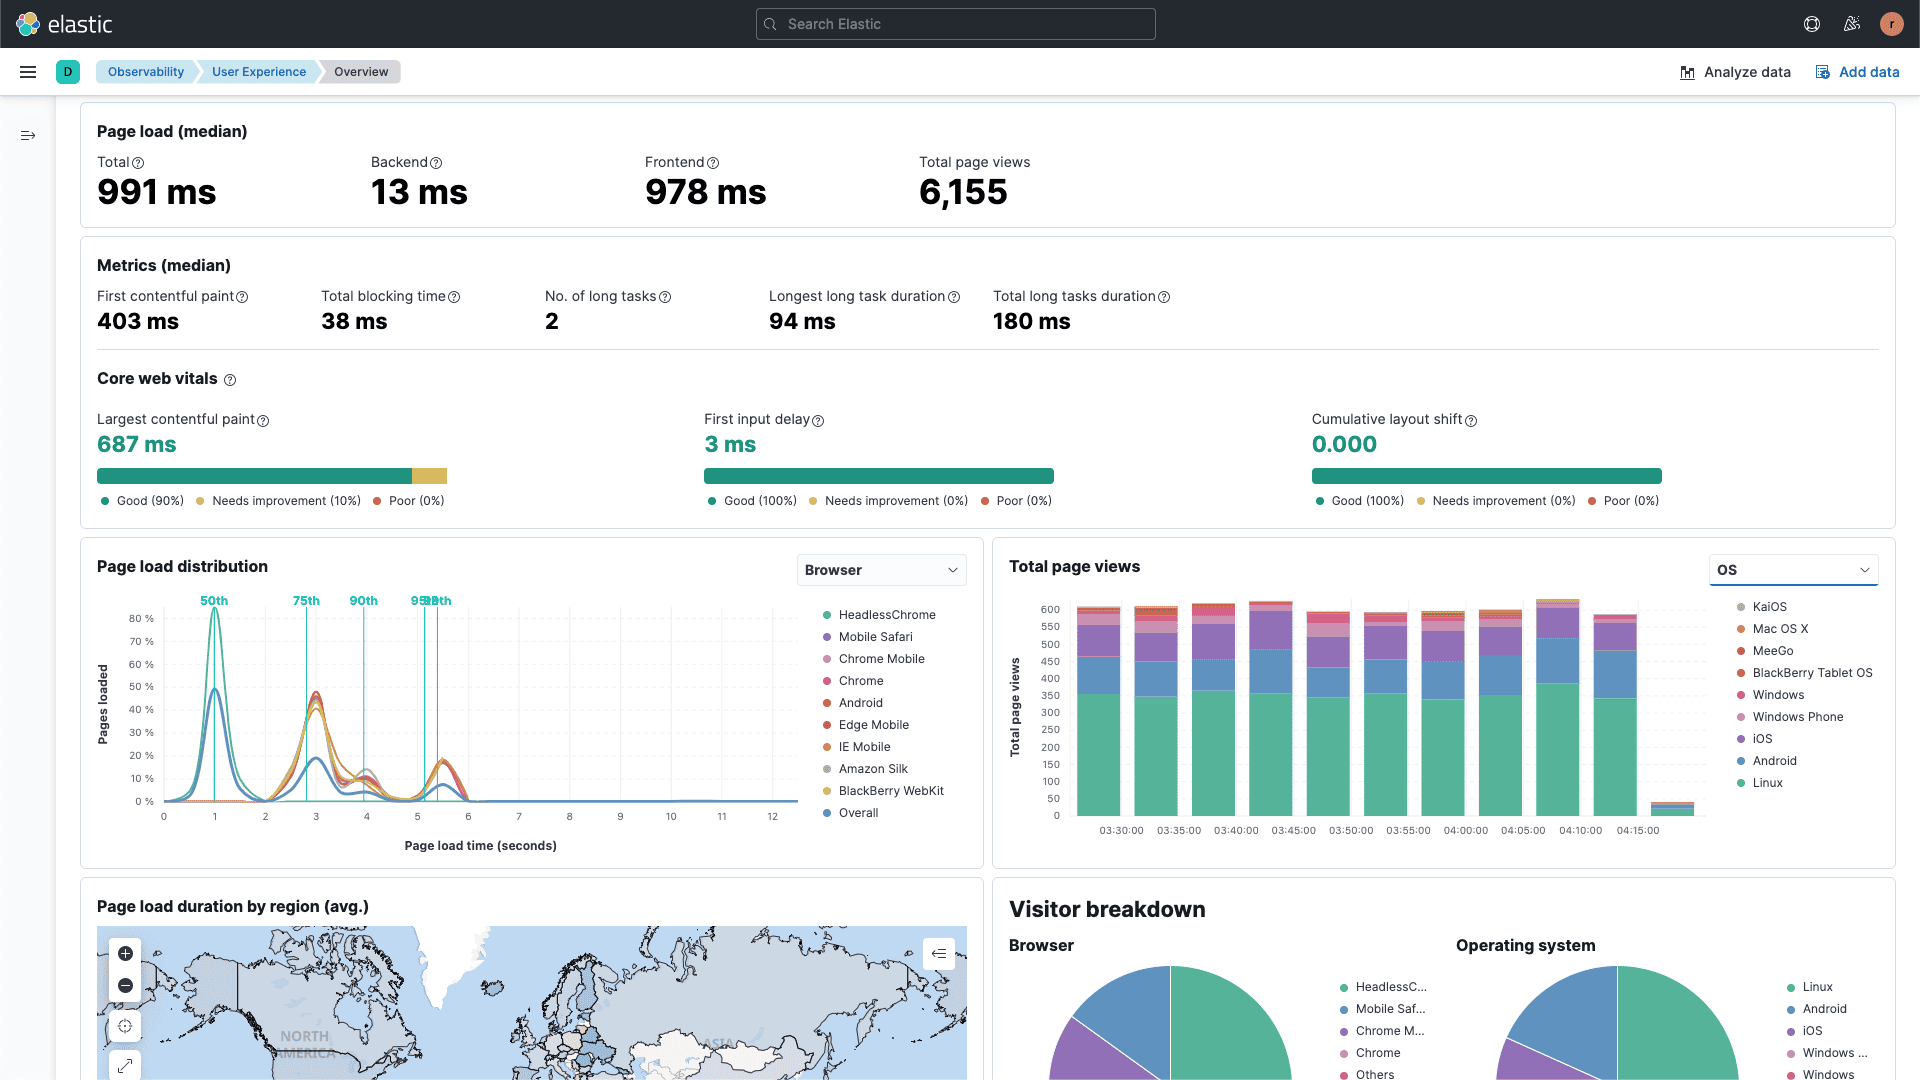
The **Elastic Stack** (Elasticsearch, Logstash, Kibana, Beats) has been a foundational component of observability stacks for over a decade. Elastic offers strong search capabilities across all telemetry types and excellent hybrid deployment flexibility, a key differentiator for organizations with strict data residency requirements.
**Strengths:**
- World-class full-text search across logs and traces
- Highly interoperable across cloud providers and on-prem systems
- Strong APM features in Elastic APM
**Considerations:**
- Elasticsearch is operationally complex and resource-hungry, a common pain point that prompted tools like OpenObserve to be built
- Storage costs can be high at scale without significant tuning
- The licensing model shifted to a non-open-source license (SSPL) in 2021, though OpenSearch (an Apache-licensed fork) remains available
**Pricing:** Elastic Cloud starts around $95/month; self-hosted incurs significant infrastructure costs.
Migrating away from Elasticsearch? Read [From ELK to OpenObserve: Streamlining Log Management](https://openobserve.ai/articles/elk-stack-alternatives-explored/) and [Best Elasticsearch Alternatives 2026](https://openobserve.ai/blog/elasticsearch-alternatives/) for a detailed cost and feature comparison.
### **8\. AWS CloudWatch**
**Website:** aws.amazon.com/cloudwatch
**Type:** SaaS (AWS-native) | **Best for:** Teams running primarily on AWS
Amazon CloudWatch is the native observability service integrated within AWS, providing seamless monitoring for resources and applications in the AWS ecosystem. It collects metrics, logs, and traces from EC2, Lambda, RDS, and dozens of other AWS services automatically.
**Strengths:**
- Zero-configuration for native AWS services
- Deep integration with AWS X-Ray for distributed tracing
- Alarms, dashboards, and anomaly detection built in
**Considerations:**
- Limited utility for multi-cloud or on-prem environments
- Famously complex pricing model
- The UI has historically been clunky, many teams end up routing data to external tools anyway
**Pricing:** Usage-based; costs vary significantly based on data volume and features used.
### **9\. Prometheus**
**Website:** prometheus.io
**Type:** Open-source | **Best for:** Kubernetes-native metrics collection and alerting
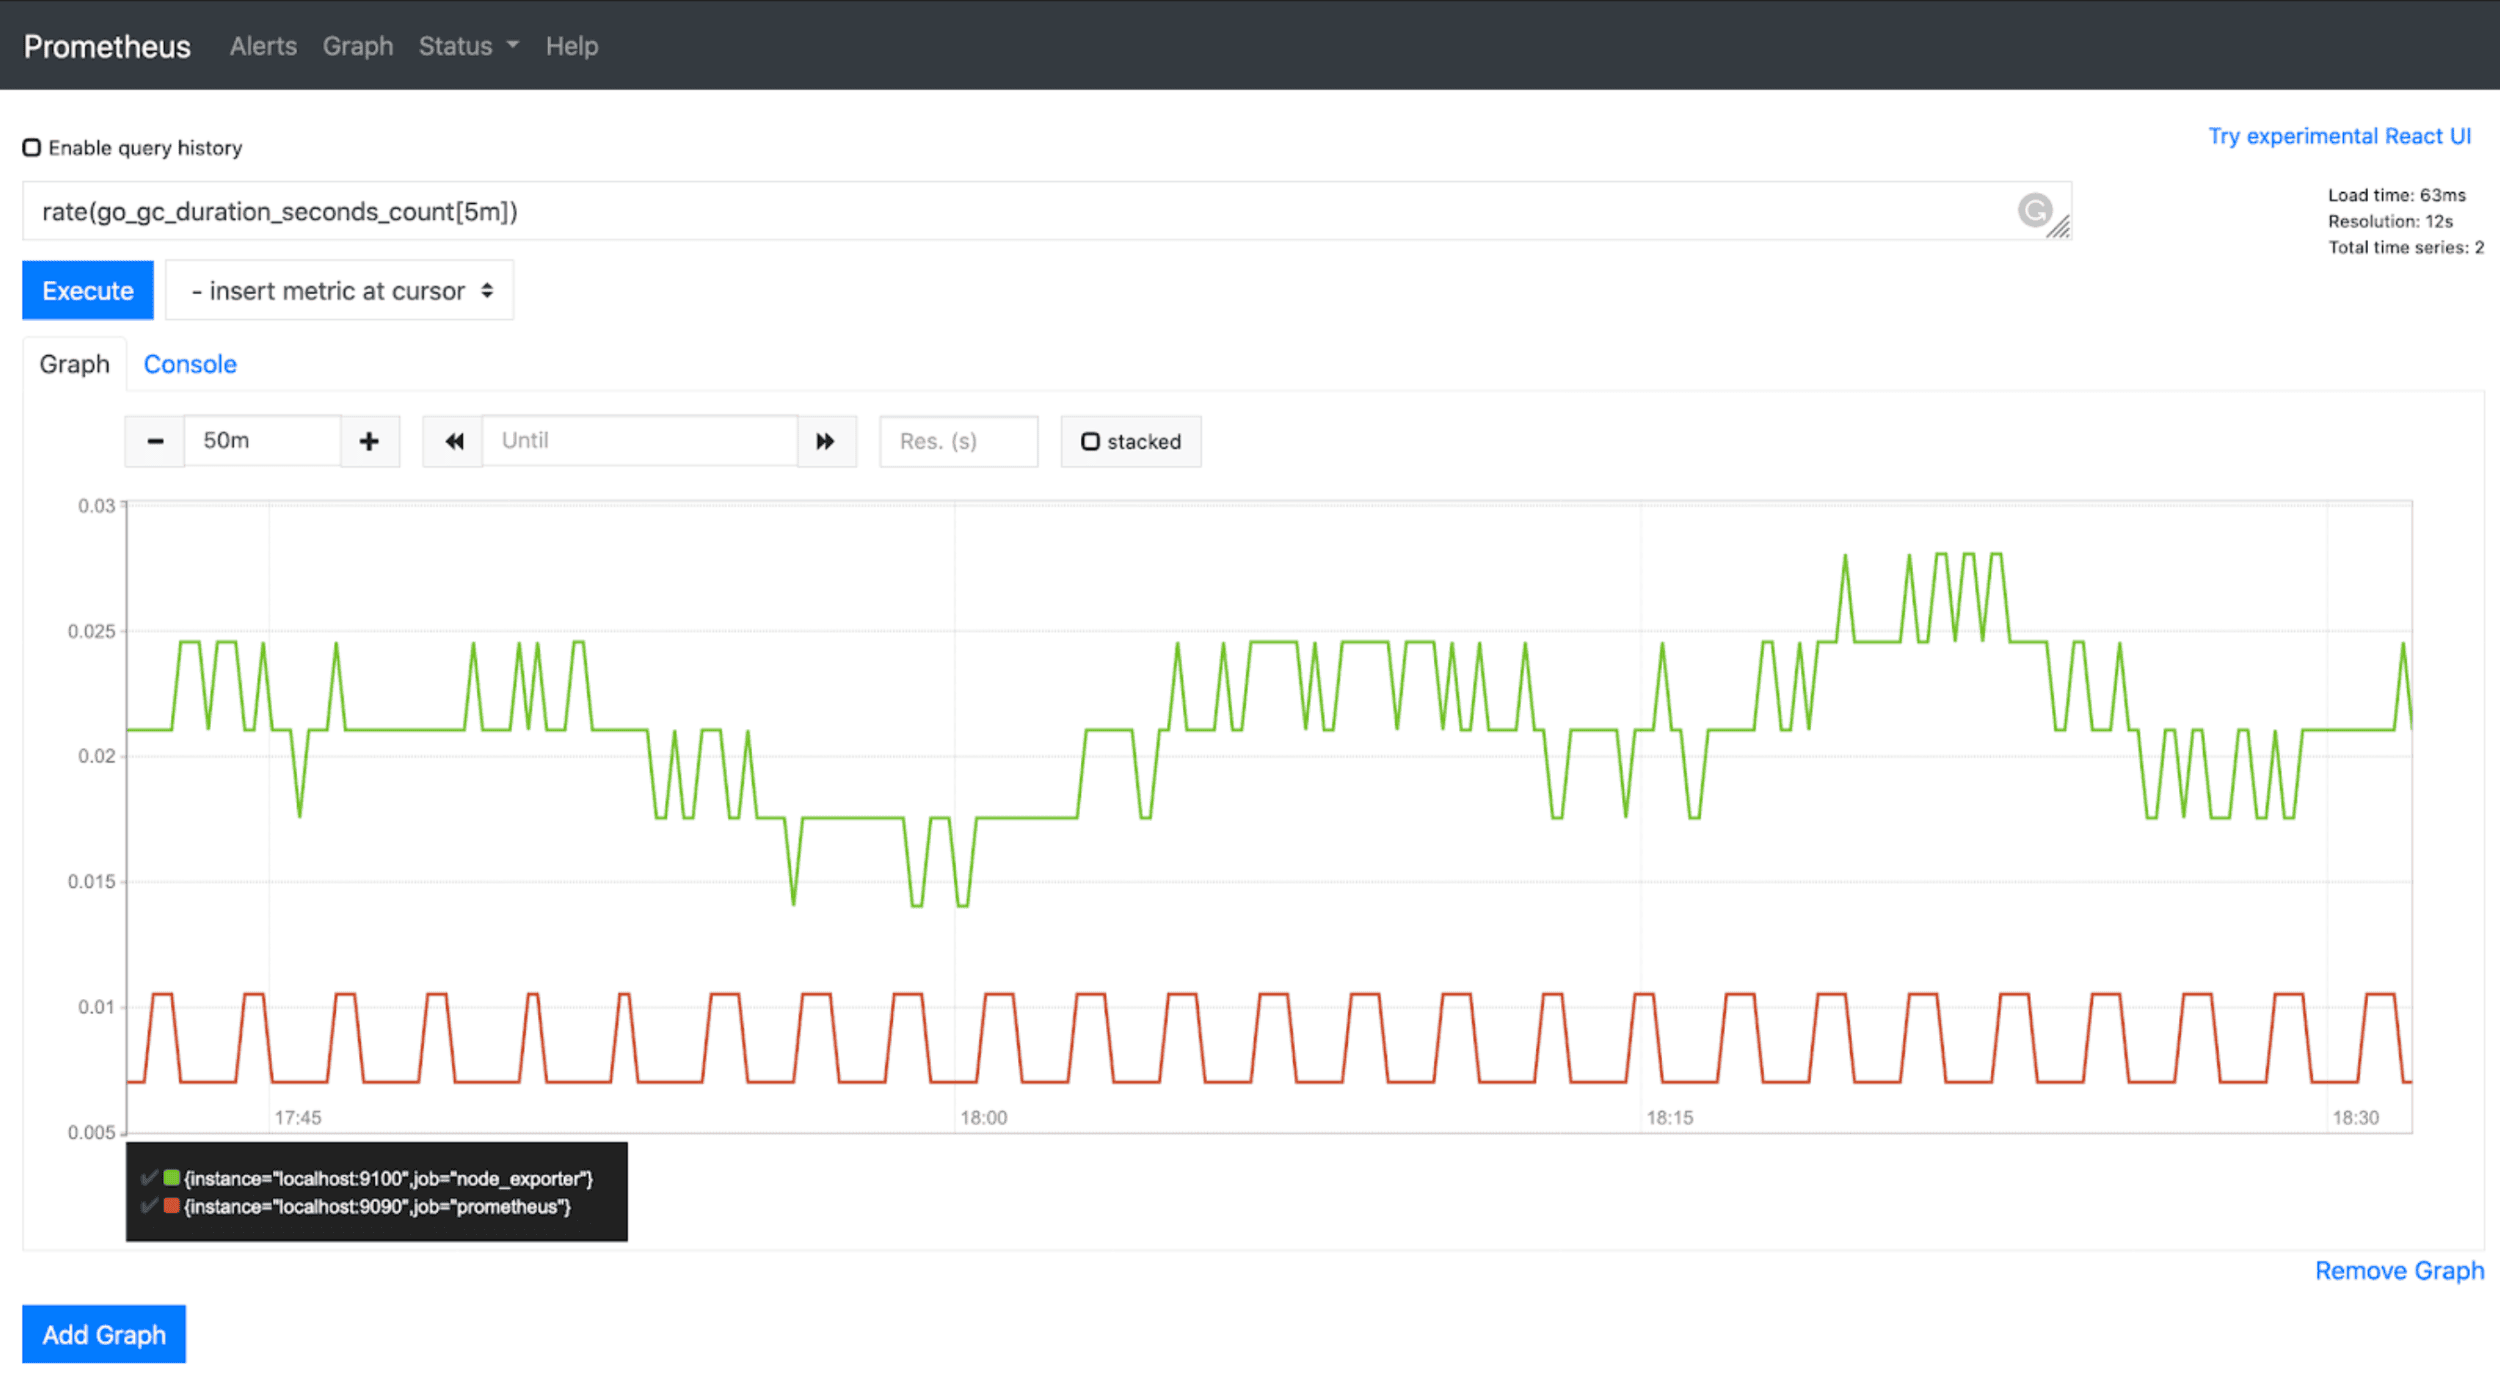
Prometheus is the de facto standard for **metrics collection** in cloud-native environments. Originally developed at SoundCloud and now a CNCF graduated project, it uses a pull-based model to scrape metrics from instrumented services and supports powerful alerting via Alertmanager.
**Strengths:**
- Native Kubernetes service discovery
- Highly expressive PromQL query language
- Massive community and ecosystem
- Time-tested reliability in production
**Considerations:**
- Metrics only, no native log or trace support
- Long-term storage at scale requires integrations (Thanos, Cortex, Mimir, or OpenObserve's PromQL-compatible metrics ingestion)
- Not a complete observability solution on its own
**Pricing:** Free and open-source.
See [Top 10 Open-Source Observability Tools in 2026](https://openobserve.ai/blog/top-10-open-source-observability-tools-2025/) for how Prometheus fits into a complete open-source observability stack alongside OpenObserve.
### **10\. Jaeger**
**Website:** jaegertracing.io
**Type:** Open-source | **Best for:** Distributed tracing in microservices architectures
Jaeger is an open-source, end-to-end distributed tracing tool originally developed by Uber and now a CNCF graduated project. It collects timing data for requests as they flow through distributed systems, enabling teams to pinpoint latency bottlenecks and trace failures to their exact origin.
**Strengths:**
- Purpose-built for distributed tracing
- Excellent visualization with trace timelines, flame charts, and service dependency graphs
- Native OpenTelemetry support
- Active community and CNCF backing
**Considerations:**
- Tracing only, needs to be paired with Prometheus (metrics) and a log management tool for full observability
- Operational overhead at scale
**Pricing:** Free and open-source.
## **Comparison Table** {#comparison-table}
| Platform | Type | Logs | Metrics | Traces | Open Source | Pricing Model | Best For |
| ------------------------------------------------------------------------------------------------------------- | -------- | ---- | ------- | ------ | ----------- | ----------------------- | -------------------------- |
| [**OpenObserve**](https://openobserve.ai/) | Platform | ✅ | ✅ | ✅ | ✅ | Usage-based / Free tier | Cost-efficient full-stack |
| **Datadog** | Platform | ✅ | ✅ | ✅ | ❌ | Per-host \+ ingestion | Large enterprises |
| **New Relic** | Platform | ✅ | ✅ | ✅ | ❌ | Consumption-based | Mid-market / growing teams |
| **Dynatrace** | Platform | ✅ | ✅ | ✅ | ❌ | DDU-based | AI-driven automation |
| **Grafana Stack** | Platform | ✅ | ✅ | ✅ | ✅ | Free / Enterprise | Technical teams |
| **Splunk** | Platform | ✅ | ✅ | ✅ | ❌ | Ingest-based | Security / compliance |
| **Elastic** | Platform | ✅ | ✅ | ✅ | Partial | Ingest-based | Search-heavy use cases |
| **AWS CloudWatch** | Platform | ✅ | ✅ | ✅ | ❌ | Usage-based | AWS-native environments |
| **Prometheus** | Tool | ❌ | ✅ | ❌ | ✅ | Free | Kubernetes metrics |
| **Jaeger** | Tool | ❌ | ❌ | ✅ | ✅ | Free | Distributed tracing |
## **How to Choose the Right Observability Platform**
With so many options, decision paralysis is real. Use this framework to narrow down your choice:
- **Step 1, Understand your environment.** Are you cloud-native on AWS, GCP, or Azure? Running Kubernetes? Operating hybrid or on-prem infrastructure? Your environment heavily influences which tools integrate seamlessly.
- **Step 2, Define your use cases.** Are you primarily focused on application performance? Infrastructure reliability? Security and compliance? Log analytics? Different platforms have different strengths.
- **Step 3, Assess your budget honestly.** Model your costs at projected data volumes, not just today's volumes. Observability data grows fast. Platforms like [OpenObserve](https://openobserve.ai/) with object storage-based architectures offer dramatically lower TCO at scale compared to per-host SaaS tools.
- **Step 4, Evaluate team expertise.** Managed SaaS platforms (Datadog, New Relic) require less operational expertise but cost more. Open-source platforms (Grafana Stack, [OpenObserve](https://openobserve.ai/)) give you more control but require engineering bandwidth to operate.
- **Step 5, Check OpenTelemetry compatibility.** Instrument once with OTel and you retain the freedom to swap back-end platforms as your needs evolve. Avoid tools that require proprietary agents.
- **Step 6, Run a pilot.** Most platforms offer free trials. [Try OpenObserve Cloud free](https://cloud.openobserve.ai/), it's up and running in under 2 minutes. Include both engineers and business stakeholders in the evaluation.
For a side-by-side feature and pricing breakdown of every major platform, see [Top 10 Observability Platforms in 2026](https://openobserve.ai/blog/top-10-observability-platforms/) and [Top 10 APM Tools](https://openobserve.ai/blog/top-10-apm-tools/).
## **The Future of Observability**
The observability landscape is evolving rapidly. Key trends shaping the field in 2026 and beyond:
- **OpenTelemetry standardization**, OTel is rapidly becoming the universal standard for instrumentation. The entire industry is converging on OTel for vendor-neutral telemetry collection, making it easier than ever to switch platforms. [OpenObserve](https://openobserve.ai/) and Grafana both treat OTel as a first-class citizen.
- **AI-assisted observability**, AI is moving from anomaly detection to full-blown causal analysis. Next-generation platforms will not just alert on anomalies, they'll explain root causes, suggest remediations, and even auto-remediate in some cases. See: [Top 10 AIOps Platforms 2026](https://openobserve.ai/blog/top-10-aiops-platforms/).
- **LLM and AI observability**, As organizations deploy AI agents and LLM-powered applications at scale, a new category of observability is emerging, tracking hallucination rates, prompt injection, model drift, token costs, and output quality alongside traditional system metrics.
- **Cost intelligence**, With observability budgets under scrutiny, platforms are building cost governance features, helping teams understand which telemetry data is actually actionable and which is noise. Research suggests up to 70% of collected observability data may be unnecessary.
- **Continuous profiling**, Profiling is emerging as a fourth pillar of observability, giving teams code-level performance insights that complement logs, metrics, and traces.
- **FinOps integration**, Observability platforms are increasingly integrating with FinOps tooling to tie system performance data directly to infrastructure cost, enabling smarter resource allocation decisions.
For a deep dive on full-stack observability strategy: [Enterprise Observability Strategy Insights](https://openobserve.ai/blog/enterprise-observability-strategy-insights/)