# OpenObserve Usage Reporting
> Turn on usage reporting in OpenObserve to see ingest volume, API activity, and errors captured in the _meta org for auditing and oversight.
Source: https://openobserve.ai/blog/usage-reporting/
Published: 2025-10-10
Authors: Simran Kumari
Category: How To
Tags: Observability, Cost Optimization
---
## Monitor, Audit, and Track with Usage Reporting in OpenObserve
When you run OpenObserve at scale, collecting logs, metrics, and traces across multiple teams or organizations, one question eventually comes up:
**Do you know what’s happening inside your observability platform itself?**
Usage reporting in OpenObserve helps answer that. It gives you visibility into how much data you’re ingesting, what’s running in the background, who’s doing what through the API, and where errors are happening. Once enabled, OpenObserve automatically records these events in a special organization called `_meta`.
This post explains how to enable usage reporting, what streams get created, and how you can use them for audits and monitoring.
## Enabling Observability Usage Reporting
Usage reporting is built into OpenObserve but turned off by default. You can enable it through a few environment variables when starting your O2 instance.
| Environment Variable | Default | Description |
| ---------------------------- | --------------------------------------------- | -------------------------------------------------------------------------------------------- |
| `ZO_USAGE_REPORTING_ENABLED` | `false` | Enables usage reporting. Starts tracking how much data has been ingested per org and stream. |
| `ZO_USAGE_ORG` | `_meta` | Organization to which the usage data is sent. `_meta` is used by default. |
| `ZO_USAGE_BATCH_SIZE` | `2000` | Number of requests to batch before writing usage data to disk. |
| `ZO_USAGE_REPORTING_MODE` | `local` | `local` stores internally; `remote` posts to an external target; `both` does both. |
| `ZO_USAGE_REPORTING_URL` | `http://localhost:5080/api/_meta/usage/_json` | Endpoint for remote ingestion of usage data. |
| `ZO_USAGE_REPORTING_CREDS` | `-` | Credentials for remote ingestion, e.g. `Basic cm9vdEBleGFtcGxlLmNvbTpDb21wbGV4UGFzcyMxMjM=`. |
| `ZO_USAGE_PUBLISH_INTERVAL` | `600` | Interval (in seconds) after which usage data is published. |
Once enabled, OpenObserve automatically creates a `_meta` organization in your instance. This organization contains several internal log streams that record key operational data.
## The `_meta` Organization: Internal Streams for Full Visibility
The `_meta` organization acts as OpenObserve’s own internal monitoring and auditing layer. It contains four important streams:
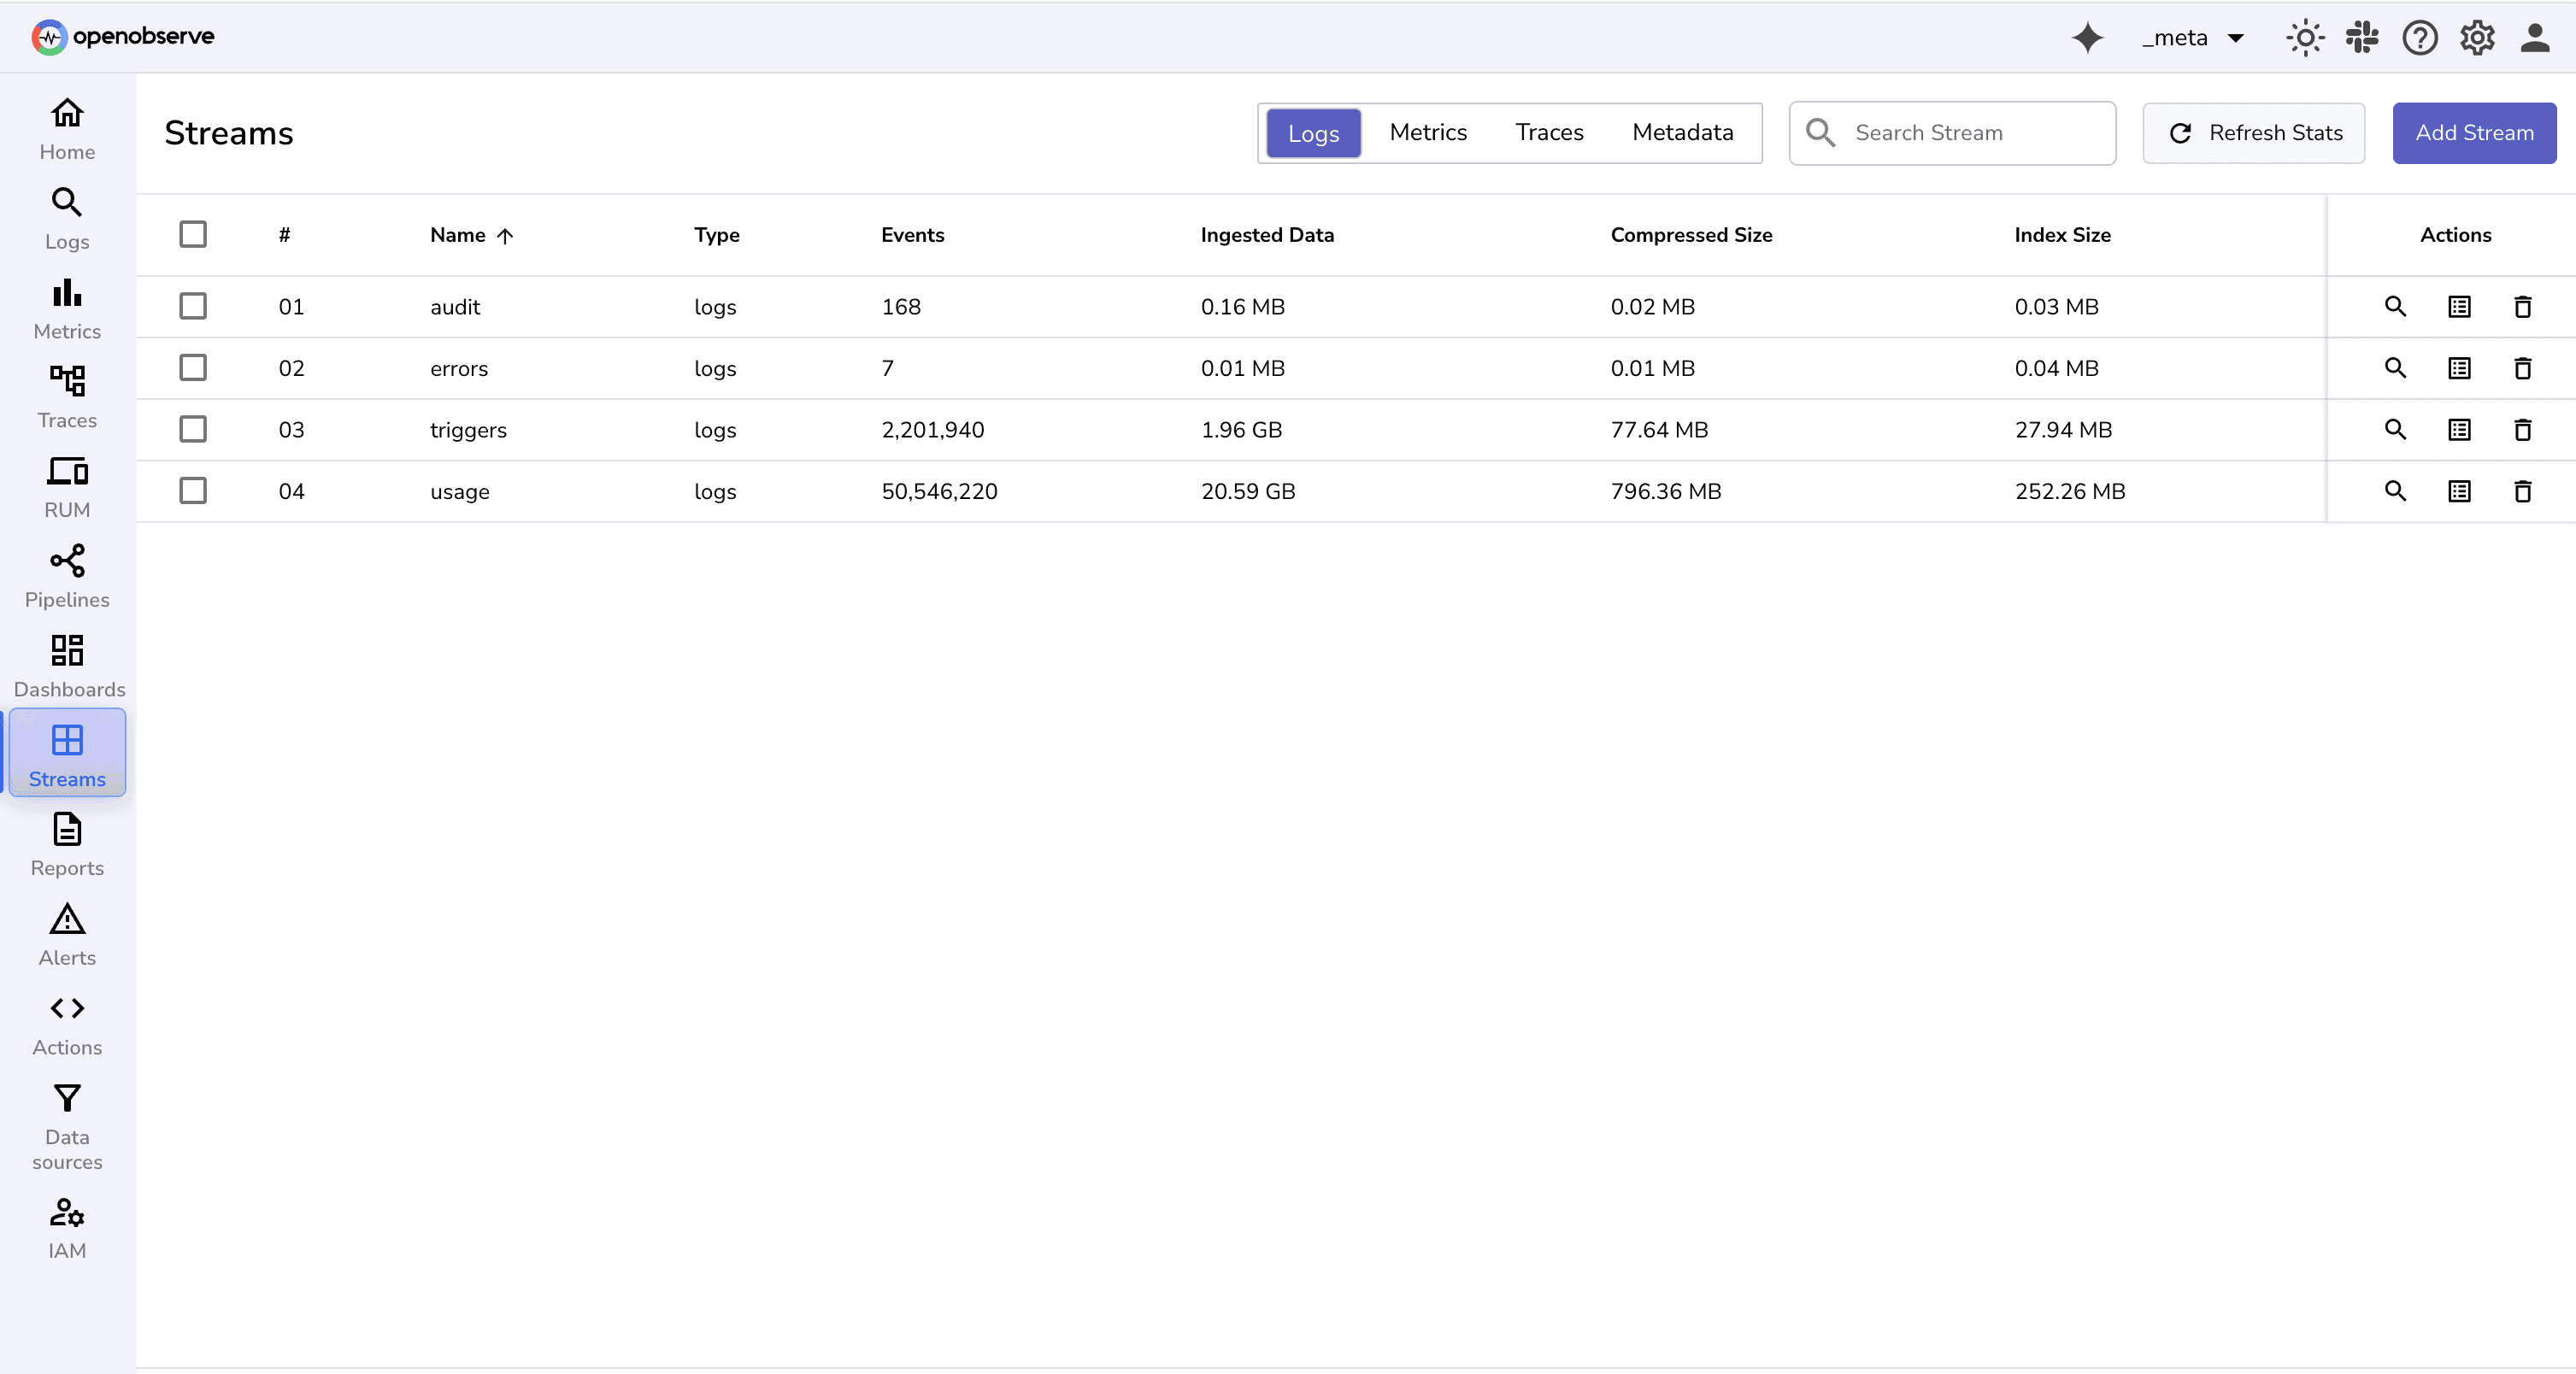
### **1\. `usage` Stream**
The `usage` stream records all ingestion and search activities essentially, what data was ingested, when, and from which source. It’s particularly useful if you want to analyze data volume or set up internal chargeback between teams.
The **usage stream** tracks data ingestion, search requests, and other usage events in OpenObserve.
Without usage tracking:
- It’s difficult to measure which orgs or pipelines are generating the most activity.
- Internal cost allocation or capacity planning is hard.
- Understanding platform usage patterns is limited.
**Record Structure**
Key fields include:
- `_timestamp`: Time of the usage event.
- `org_id`: Organization that generated the event.
- `alert_id`, `pipeline_name`, `dashboard_id`: Items involved in the usage.
- `trace_id`: Trace of the event.
- `request_body`: Request payload.
- `num_records`: Number of records ingested or processed.
- `response_time`: Time taken (in seconds) to process the request, useful for diagnosing slow ingestion or search.
- `event` : Whether its Ingestion, search, pipeline, functions etc
- `min_ts, max_ts`: The earliest and latest timestamps of the data processed in the operation ,useful for validating query or ingestion time ranges

#### **Example Scenario: Debugging a Slow Search Query**
Suppose a user reports that dashboard queries are taking unusually long to load. You can use the usage stream to investigate:
```
SELECT _timestamp, org_id, response_time, scan_files, size, min_ts, max_ts
FROM usage
WHERE event = 'Search' and response_time > 3; //3 seconds
```
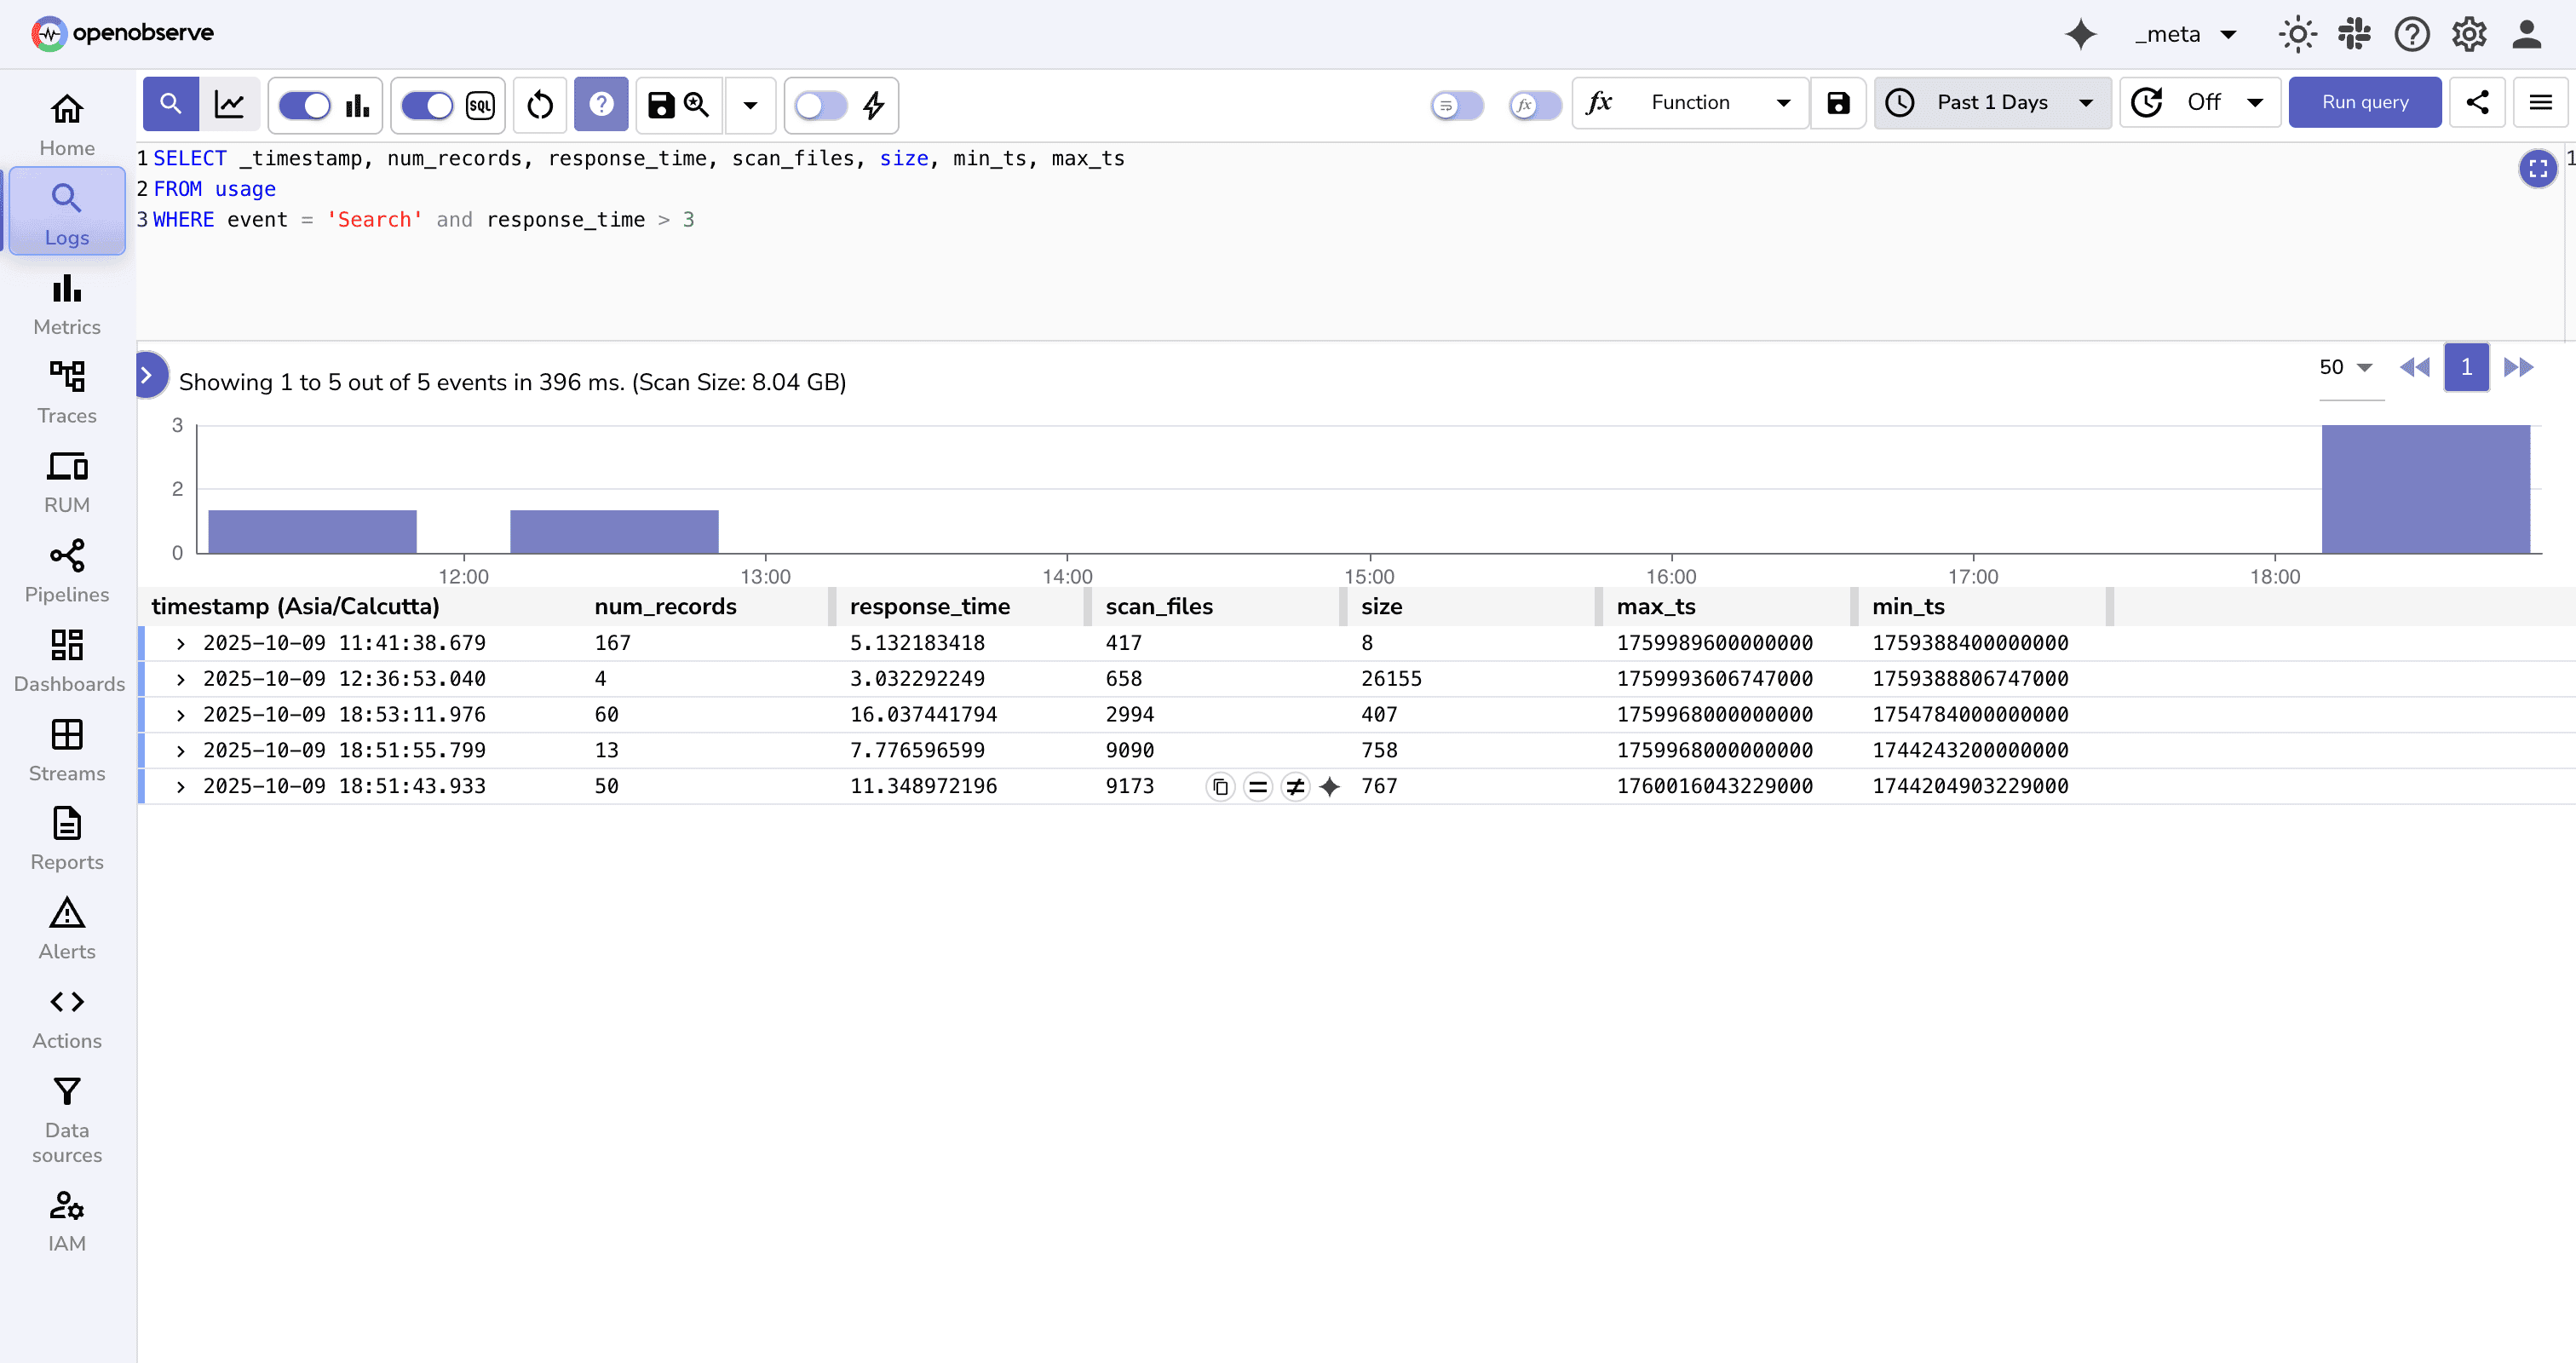
This query shows the **slow search operations**.
- If you see high `scan_files` and `size`, it means the query is scanning too much historical data consider tightening the time range or optimizing indexing.
- If `response_time` is high but `size` and `scan_files` are low, it may indicate backend contention or a temporary resource bottleneck.
- Comparing `min_ts` and `max_ts` helps confirm whether the query time window matches the expected data range.
This kind of visibility turns the usage stream into a powerful **troubleshooting tool** not just for reporting usage but for diagnosing performance and operational issues across ingestion, queries, and pipelines.
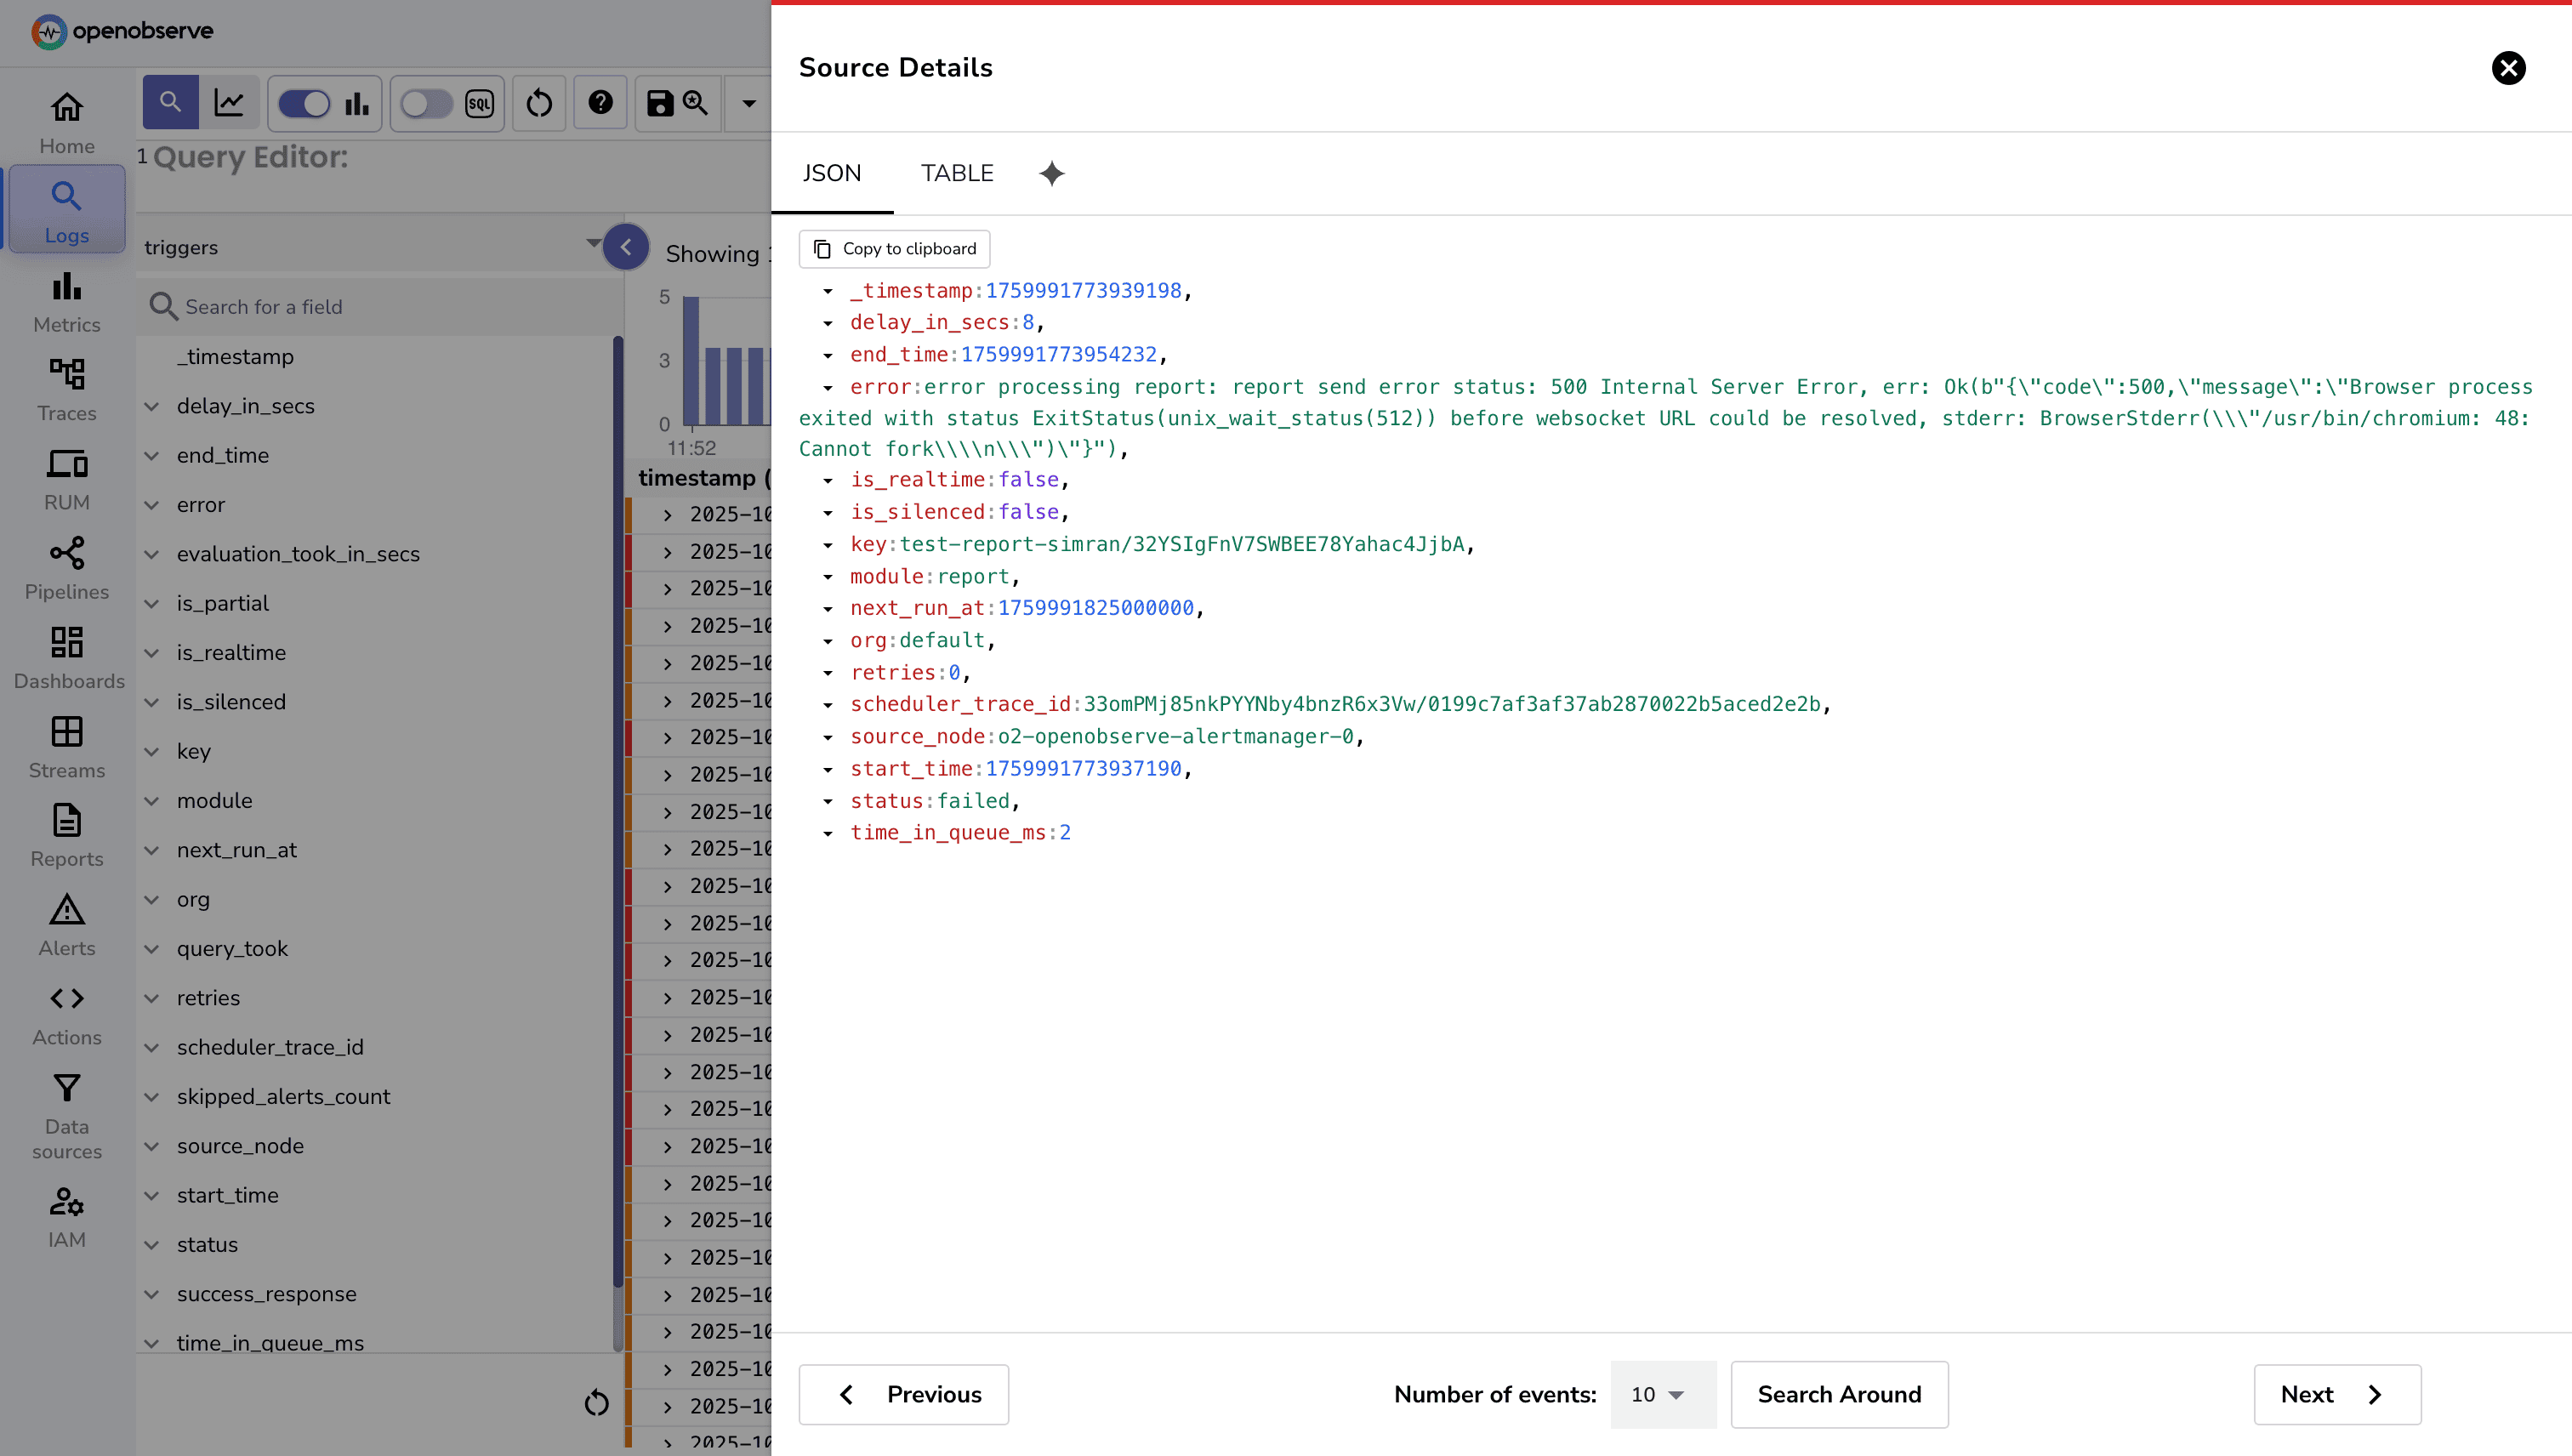
### 2\. `triggers` Stream
When users create alerts, reports, or scheduled pipelines, these tasks are processed **asynchronously** by the alert manager. This can create several visibility challenges:
- Users cannot easily monitor whether their alerts or reports are actively running.
- Success notifications only tell part of the story; failures can go unnoticed.
- Errors are invisible unless users directly access alert manager logs.
- Troubleshooting failed alerts or pipelines is difficult without a clear record of execution events.
The triggers stream addresses these gaps by **logging all processing events** in the `_meta` organization.
**Record Structure**
Each record in the triggers stream represents a single processing event. Key fields include:
- `_timestamp`: The exact time the job was processed.
- `module`: Type of job being processed (alert, report, derived_stream \[for scheduled pipelines\], etc.).
- `module_key`: Identifier of the item being processed:
- Alert ID for alerts
- Report name for reports
- Pipeline name for scheduled pipelines
- `status`: Outcome of the processing:
- `completed` \- Successful execution
- `failed` \- Execution failed due to an error
- `condition_not_satisfied`: Conditions not met (e.g., alert condition not triggered)
- `skipped` \- The job was not evaluated because the alert manager was delayed or too busy; by the time it picked up the task, it had already timed out
- `error`: Detailed error message if the execution failed (empty if successful).
### 3\. errors Stream
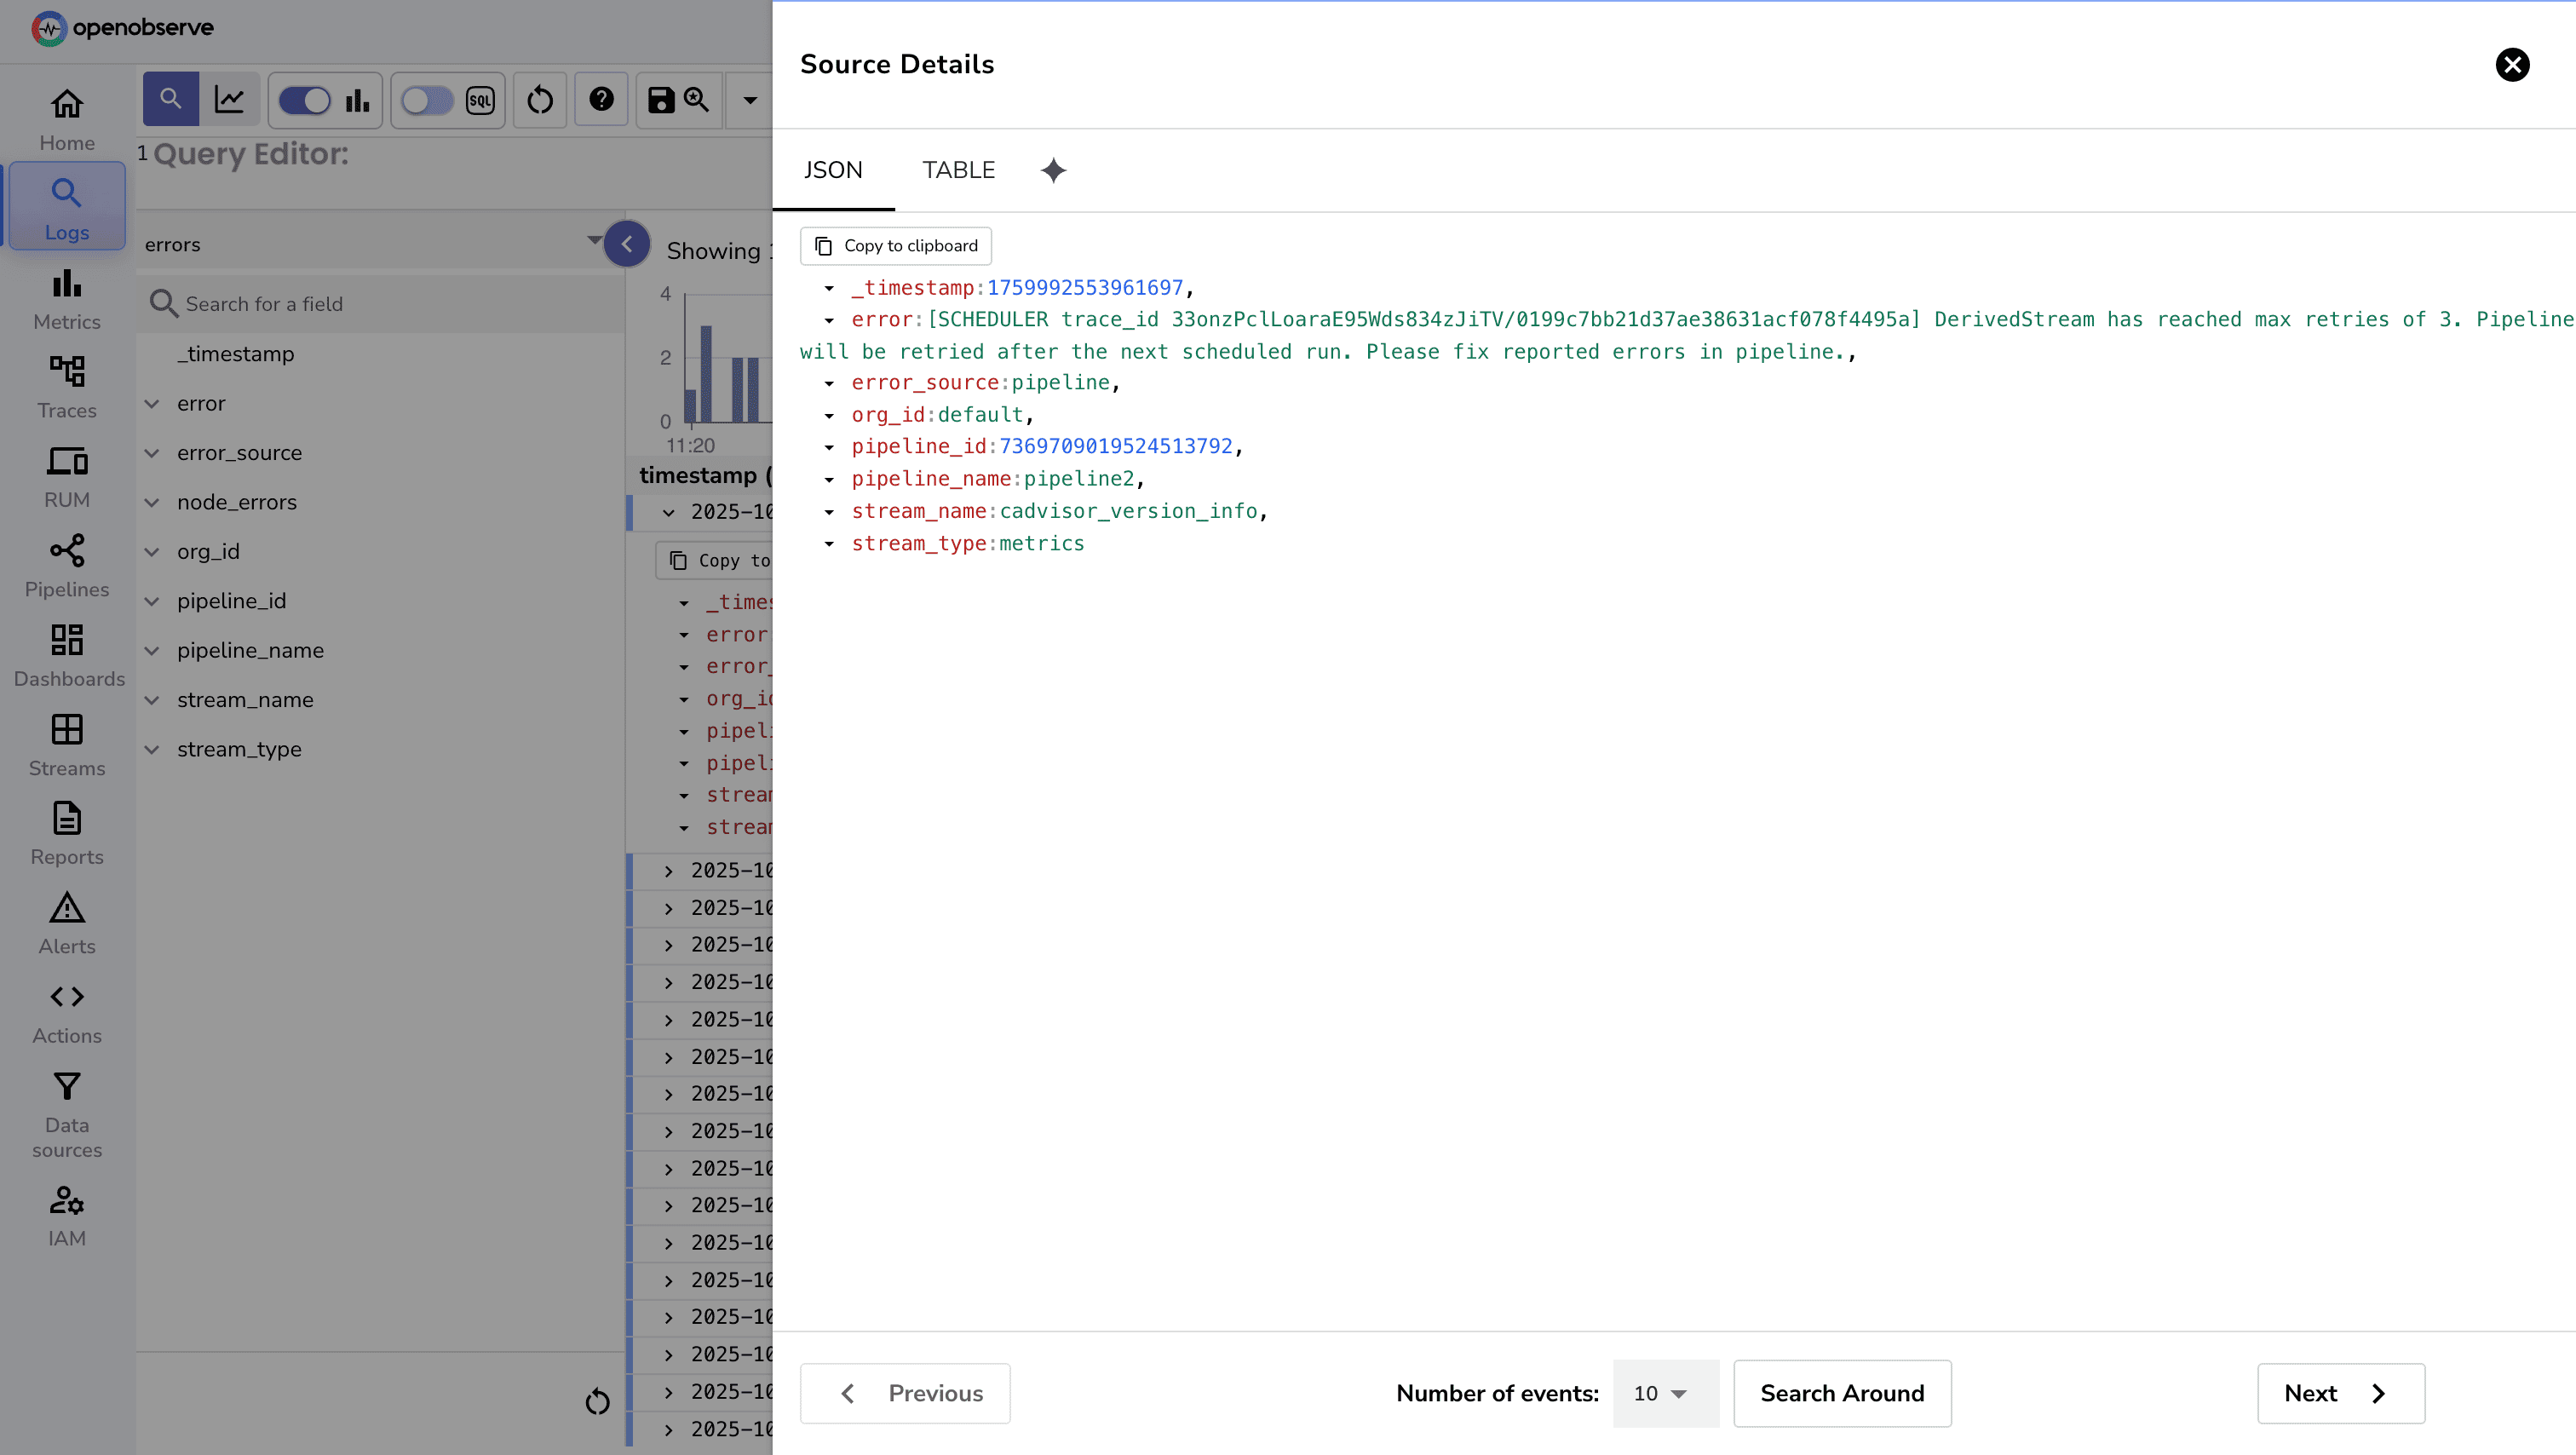
The `errors` stream records all pipeline-level errors. This is part of OpenObserve’s open-source core and gives direct visibility into issues during data ingestion or transformation.
The errors stream logs all errors, making it easy to monitor failures and perform historical analysis.Without an errors stream:
- Failures in ingestion or pipeline execution can go unnoticed.
- Debugging pipeline issues requires manual log inspection.
- Identifying error patterns across orgs and streams is difficult.
**Record Structure**
Each record includes:
- `_timestamp`: Time the error occurred.
- `error`: Error message.
- `error_source`: Component that caused the error.
- `org_id`: Organization where the error occurred.
- `pipeline_id`: Identifier of the pipeline.
- `pipeline_name`: Name of the pipeline.
- `stream_name`: Stream associated with the error.
- `stream_type`: Type of stream.
### 4\. `audit` Stream (Enterprise Only)
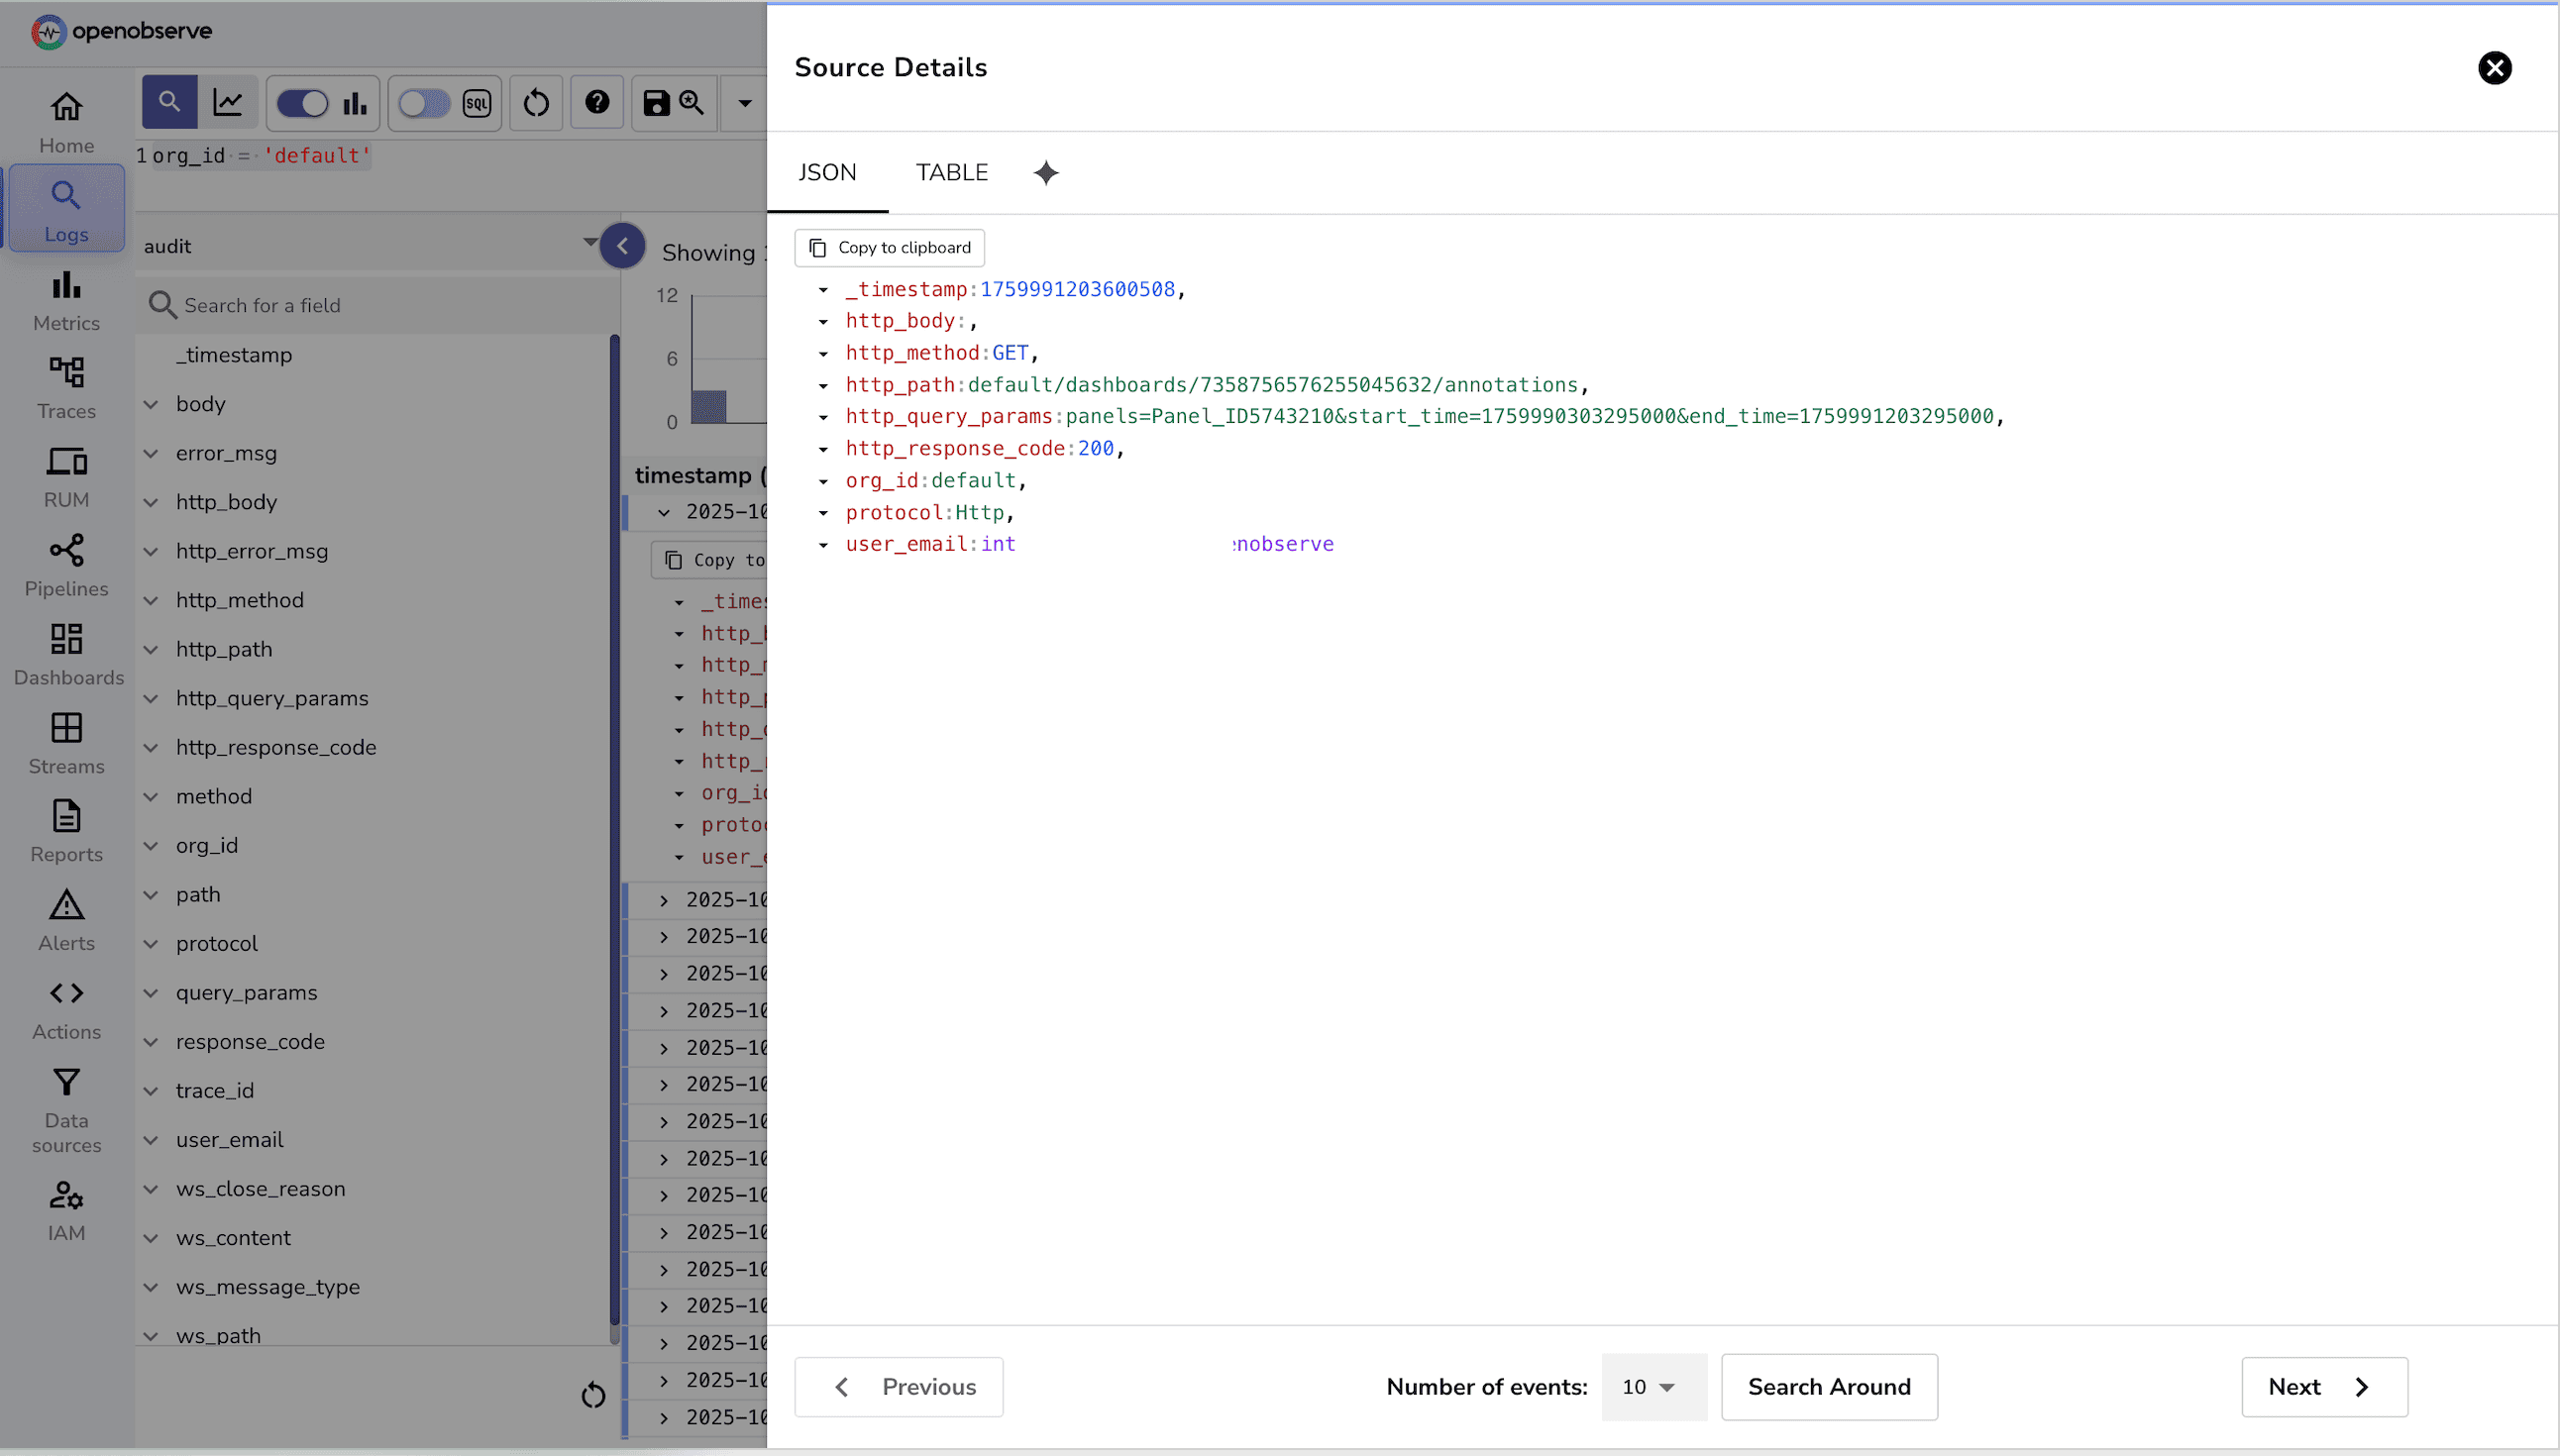
The audit stream logs all events such as API calls, logins, logouts, and configuration changes. It serves as a **single source of truth** for all user activity.
Without a centralized audit stream:
- Administrators cannot easily track who made configuration changes.
- API usage and access patterns are hard to analyze.
- Security or compliance investigations require digging into scattered logs.
**Record Structure**
Each record contains bunch of fields. Key fields include::
- `_timestamp`: Time the event occurred.
- `user_email`: The user who performed the action.
- `http_method`: HTTP method used (GET, POST, etc.).
- `http_path`: API endpoint path accessed.
- `http_response_code`: Response code returned.
- `error_msg`: Error message if the action failed.
- `org_id`: Organization ID associated with the action.
- `protocol`: HTTP protocol used (HTTP/HTTP2).
- `trace_id`: Trace ID for correlating requests.
**Note:** The **Audit Stream** (Audit Trail) is available **only in OpenObserve Enterprise Edition**. To enable it, you need to set the relevant environment variables (e.g., `O2_AUDIT_ENABLED=true`) when starting your O2 instance. You can check [details around configuring Audit Trial.](https://openobserve.ai/docs/user-guide/account-administration/management/audit-trail/#configuration)
## What You Can Learn from Usage Reporting
The `_meta` organization streams provide a rich source of internal observability data. Once enabled, this data can help answer key operational and administrative questions, such as:
- **Platform utilization:** Which organizations, pipelines, or streams are generating the most activity?
- **User behavior:** Who is using the platform, what APIs are being called, and how frequently?
- **Alert and job reliability:** Which alerts, reports, or scheduled pipelines are succeeding or failing?
- **Error patterns:** Are there recurring issues in ingestion pipelines or transformations that need attention?
- **Capacity planning & cost allocation:** How can resources be allocated or billed accurately based on usage?
This data essentially turns OpenObserve into **self-observing observability**, giving teams visibility into how their platform itself is performing.
## Explore Insights with Ready-to-Import Dashboards
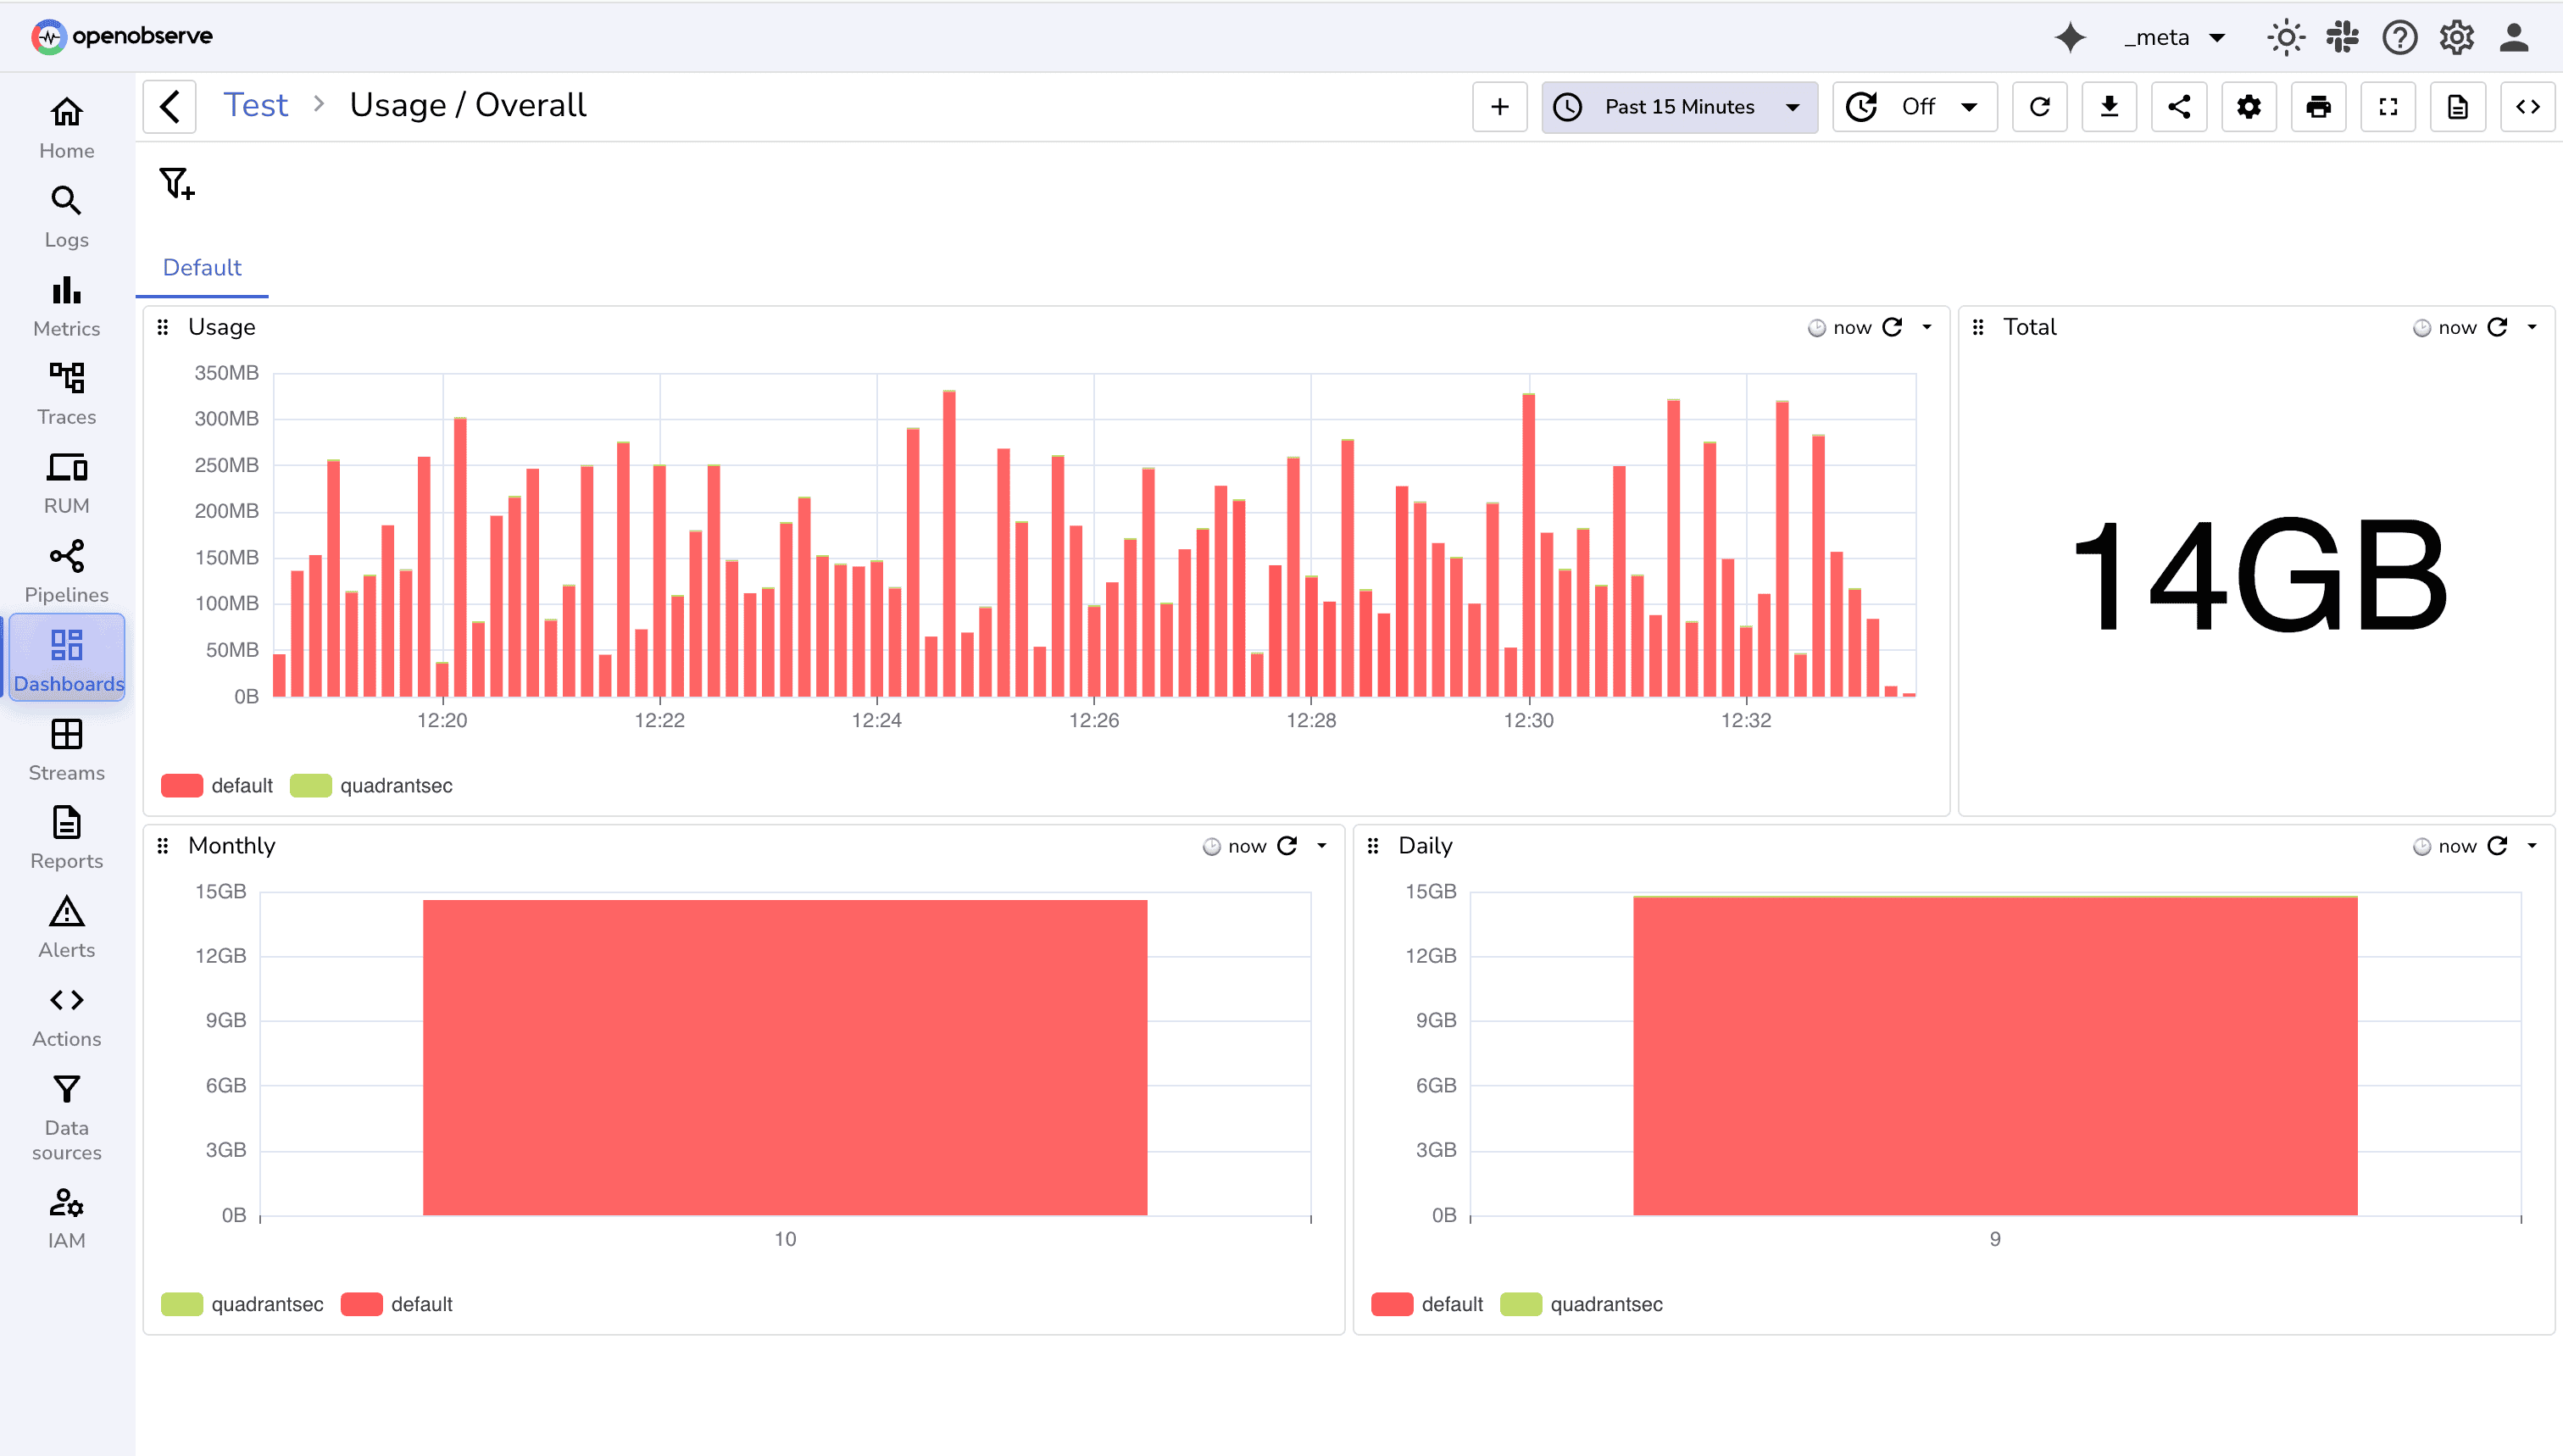
You can also explore this usage data quickly using OpenObserve’s **Community dashboards**, which provide ready-made visualizations of ingestion volume, usage trends, and per-organization activity. These dashboards make it easy to monitor platform usage without writing SQL queries.
## Conclusion
OpenObserve’s usage reporting and `_meta` streams give teams **full visibility into the platform itself**. By tracking ingestion, errors, alerts, and user activity, you can:
- Optimize resource allocation and internal billing
- Detect failures before they impact end-users
- Monitor user behavior for security and compliance
- Identify trends and growth in ingestion and processing
For further reading and step-by-step guides, check out:
- [Configuring Audit Trail in OpenObserve Enterprise](https://openobserve.ai/docs/user-guide/account-administration/management/audit-trail/)
- [Setting Up Alerts and Scheduled Reports](https://openobserve.ai/docs/user-guide/analytics/alerts/)
- [Querying `_meta` Streams with SQL](https://openobserve.ai/docs/user-guide/data-exploration/example-queries/)
### **_Get Started with OpenObserve Today\!_**
_Sign up for a [14 day cloud trial](https://cloud.openobserve.ai/). Check out our GitHub repository for self-hosting and contribution opportunities._