---
title: Grafana plugin
metaTitle: OpenObserve Plugin for Grafana
description: Use the OpenObserve plugin in Grafana to visualize logs and metrics if you are already using Grafana. Includes setup steps for Kubernetes and non-K8s installs.
weight: 4450
---
# OpenObserve Plugin for Grafana
This guide walks you through installing and configuring the openobserve plugin in Grafana within a Kubernetes environment. If you are not using Kubernetes, you can adapt these steps for your environment.
## Overview
Grafana is an open-source platform for creating dashboards and visualizations.
OpenObserve provides its own interface for [logs](../../../user-guide/data-exploration/logs/logs.md), [metrics](../../../features/metrics.md), [tracing](../../../features/distributed-tracing.md), [frontend monitoring](../../../features/frontend.md), [dashboards](../../../user-guide/analytics/dashboards/dashboards-in-openobserve.md), and [alerting and notifications](../../../user-guide/analytics/alerts/index.md).
The OpenObserve plugin for Grafana is an optional integration. It enables OpenObserve to be added as a Grafana data source, making it possible to use existing Grafana dashboards or combine OpenObserve data with other monitoring systems.
:::note[Plugin maintenance status]
OpenObserve actively maintains this Grafana plugin.
:::
:::note[Quick start]
If you are familiar with the Grafana plugin installation process, proceed to [download the plugin](https://zincsearch-releases.s3.us-west-2.amazonaws.com/zo_gp/zo_gp.tar.gz) and skip ahead to [using the plugin in Grafana](#use-the-openobserve-plugin-in-grafana).
:::
## Install the OpenObserve plugin in Grafana
::::accordion[Prerequisite]
**Storage Requirements**
Grafana requires persistent storage for two things: configuration and data.
- Configuration can be stored in a ConfigMap or Secret.
- Data must be stored in a database. Grafana supports SQLite, MySQL, and PostgreSQL.
Most Grafana installations run on a single node with SQLite.
**Deployment method**
In Kubernetes, you deploy applications using either a Deployment or StatefulSet. Since Grafana needs persistent storage for its data, your choice depends on which database you use:
- **SQLite** stores data files inside the pod itself. Use a `StatefulSet` to preserve this data when the pod restarts.
- **MySQL or PostgreSQL** store data in an external database. Use a `Deployment` since the data persists outside the pod.
:::note[Note]
This guide uses a StatefulSet with SQLite.
:::
::::
:::accordion[Step 1: Create the configuration file]
Create a `grafana.ini` file with the following configurations.
```ini title="grafana.ini" lineNumbers {4,9}
[date_formats]
default_timezone = UTC
[server]
root_url = https://grafana.yourdomain.com
[plugins]
enable_alpha = true
app_tls_skip_verify_insecure = false
allow_loading_unsigned_plugins = openobserve
```
**Important**:
- In `Line 4`, you must update the `root_url` with the root URL of your Grafana installation. This is the URL that you will use to access grafana. For example, `https://grafana.yourdomain.com`.
- In `Line 9`, you must specify that Grafana should use the unsigned plugin `openobserve`.You will install this plugin using the `init container` in the `statefulset`.
:::
:::accordion[Step 2: Create a Kubernetes secret]
Once you have created the file, you can create a Kubernetes secret using the below command.
```bash lineNumbers
kubectl create secret generic grafana-config --from-file=grafana.ini
```
This secret is mounted into the Grafana container in the following StatefulSet YAML.
:::
:::accordion[Step 3: Create `grafana_statefulset.yaml`]
This file includes an init container that downloads and configures the `openobserve` plugin for the Grafana container.
```yaml title="grafana_statefulset.yaml" lineNumbers
apiVersion: apps/v1
kind: StatefulSet
metadata:
name: grafana
spec:
serviceName: "grafana"
replicas: 1
selector:
matchLabels:
app: grafana
template:
metadata:
labels:
app: grafana
spec:
securityContext:
fsGroup: 2000
runAsUser: 10000
runAsGroup: 3000
initContainers:
- name: openobserve-plugin-loader
image: wbitt/network-multitool
imagePullPolicy: IfNotPresent
command:
[
"sh",
"-c",
"curl -o /var/lib/grafana/plugins/zo_gp.tar.gz https://zincsearch-releases.s3.us-west-2.amazonaws.com/zo_gp/zo_gp.tar.gz && cd /var/lib/grafana/plugins && tar -zxvf zo_gp.tar.gz",
]
volumeMounts:
- name: grafana-base
mountPath: /var/lib/grafana
- name: grafana-plugins
mountPath: /var/lib/grafana/plugins
containers:
- name: grafana
image: grafana/grafana:latest
ports:
- containerPort: 3000
name: grafana
volumeMounts:
- name: grafana-base
mountPath: /var/lib/grafana
- name: grafana-plugins
mountPath: /var/lib/grafana/plugins
- name: grafana-config
mountPath: /etc/grafana
volumes:
- name: grafana-base
persistentVolumeClaim:
claimName: grafana-base
- name: grafana-plugins
persistentVolumeClaim:
claimName: grafana-plugins
- name: grafana-config
secret:
defaultMode: 420
secretName: grafana-config
volumeClaimTemplates:
- metadata:
name: grafana-base
spec:
accessModes: ["ReadWriteOnce"]
resources:
requests:
storage: 1Gi
- metadata:
name: grafana-plugins
spec:
accessModes: ["ReadWriteOnce"]
resources:
requests:
storage: 1Gi
---
apiVersion: v1
kind: Service
metadata:
name: grafana
spec:
ports:
- port: 3000
targetPort: 3000
selector:
app: grafana
```
:::
:::accordion[Step 4: Deploy the `openobserve` plugin]
Run the following `kubectl apply` command to deploy the plugin:
```bash lineNumbers
kubectl apply -f grafana_statefulset.yaml
```
:::
## Use the OpenObserve plugin in Grafana
:::accordion[Step 1: Set up data source]
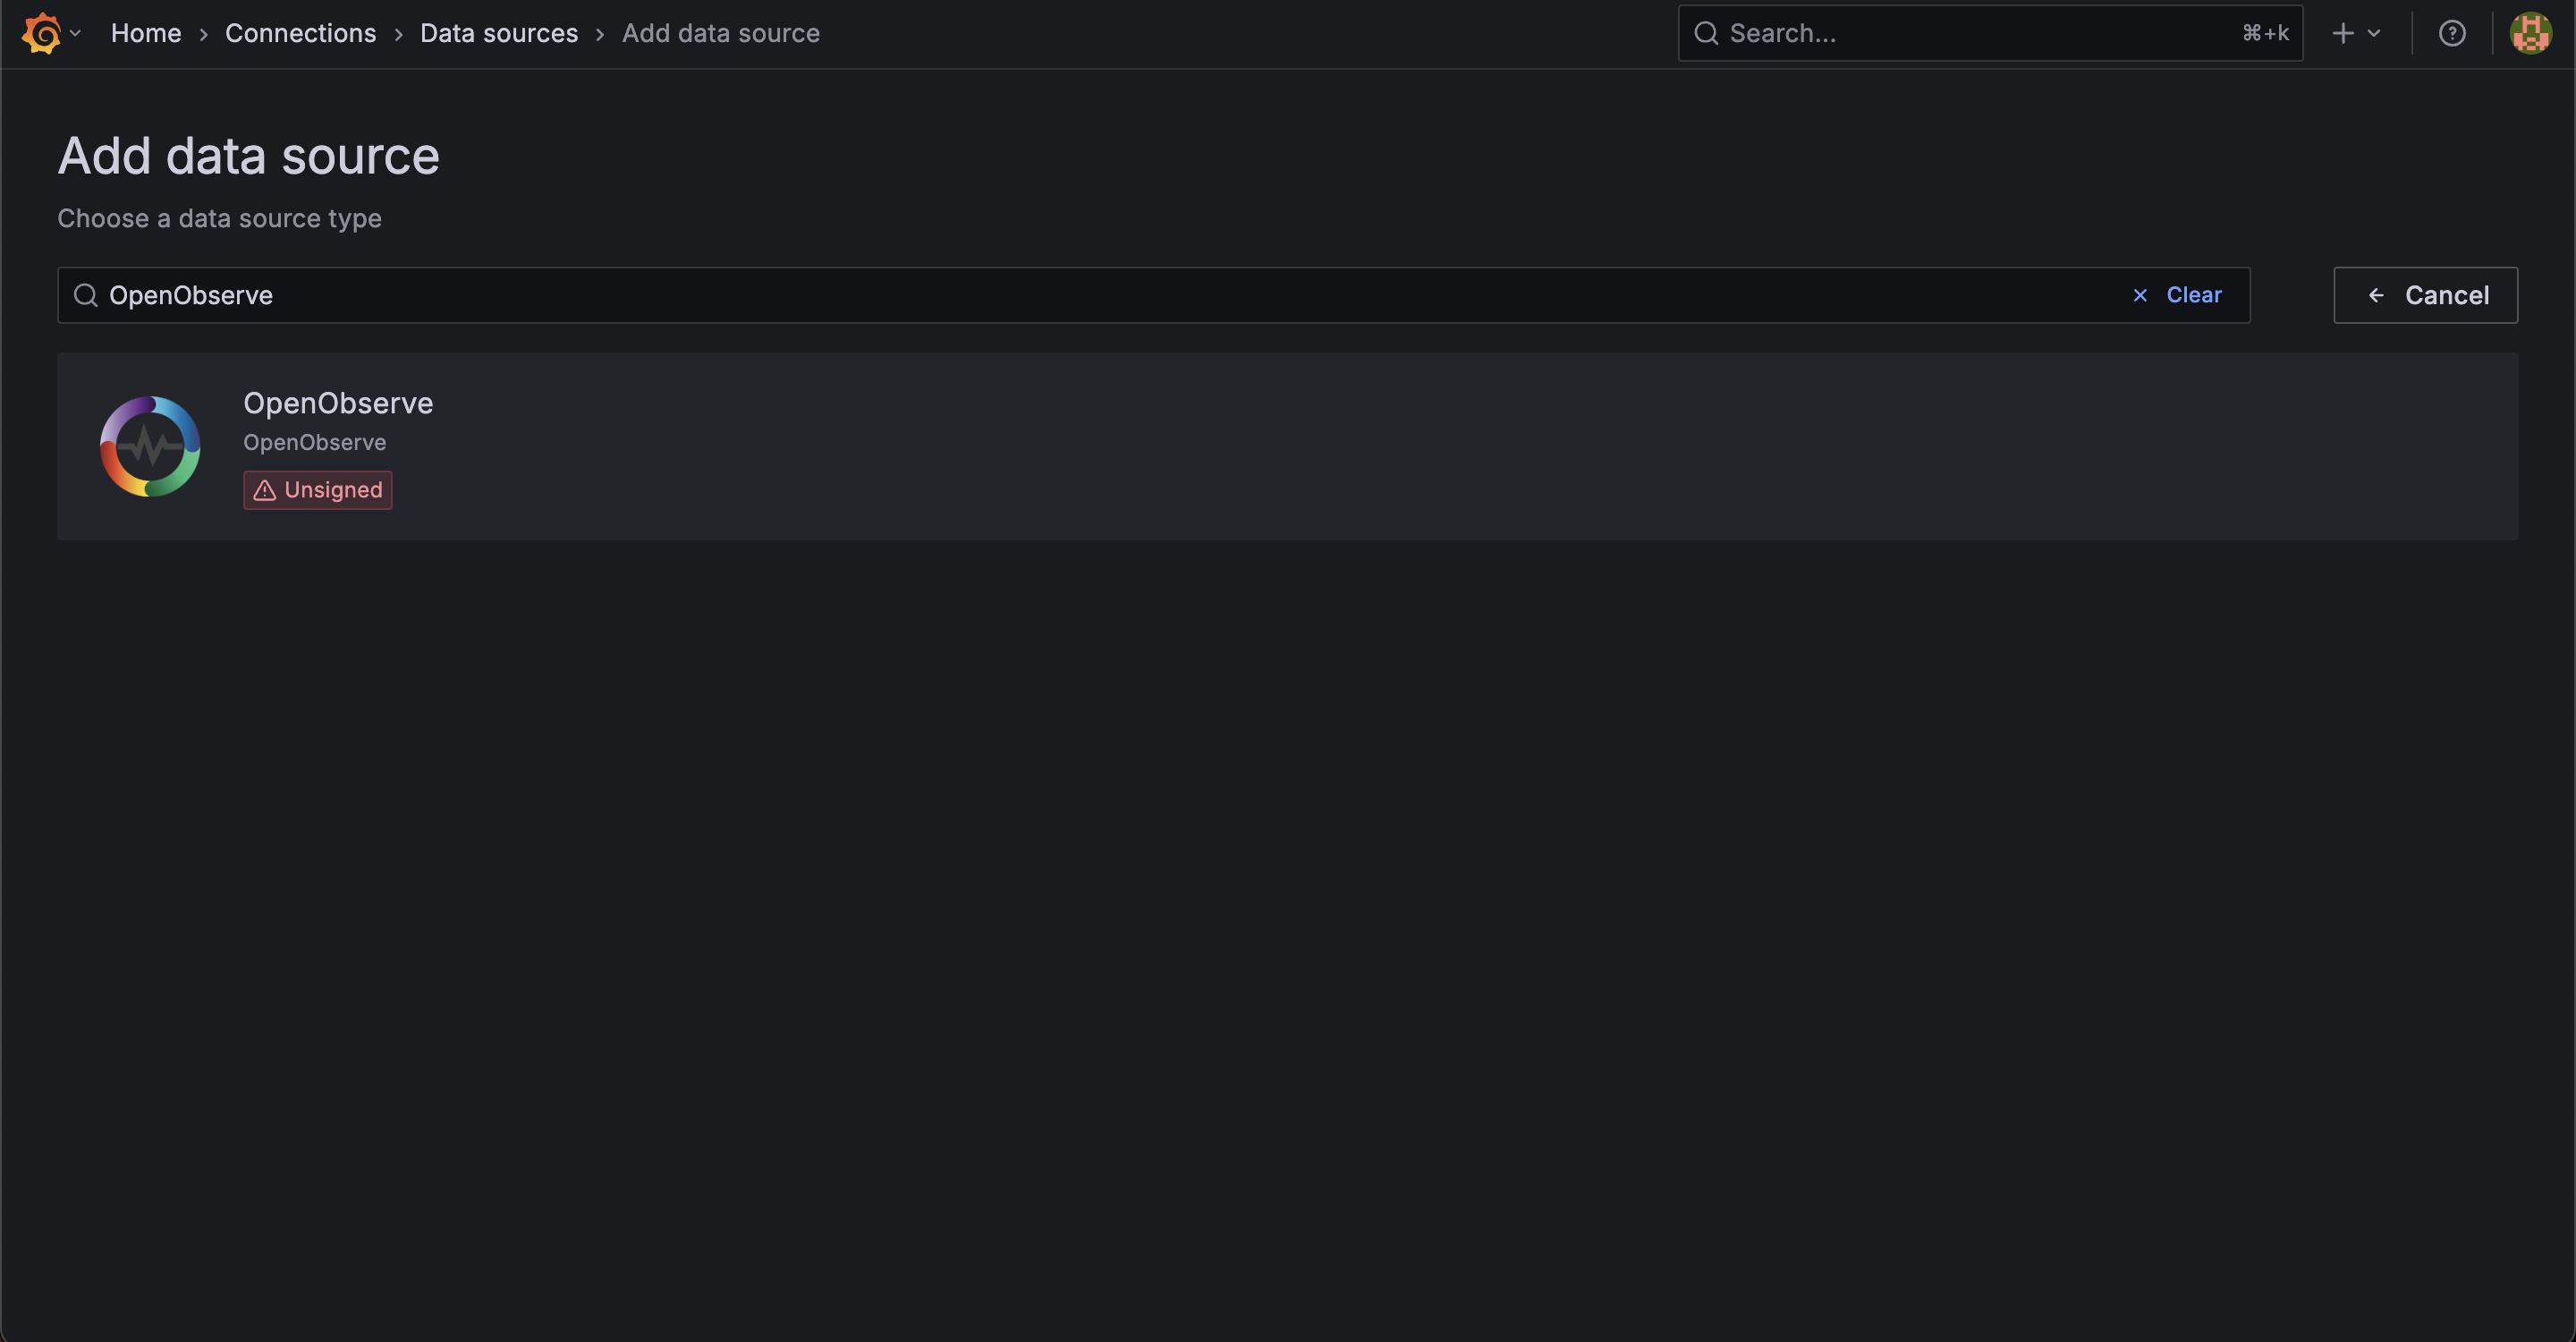
From the Grafana interface, go to the **Data Sources** section and search for `openobserve`.
:::
:::accordion[Step 2: Add OpenObserve data source server details]
1. In the data source configuration screen, update the following fields:
- In the **HTTP** section, add the **URL**.
- In the **Auth** section, enable **Basic Auth** toggle.
- Under **Basic Auth Details**, add the User ID and password.
2. Click **Save and Test** to save the changes.
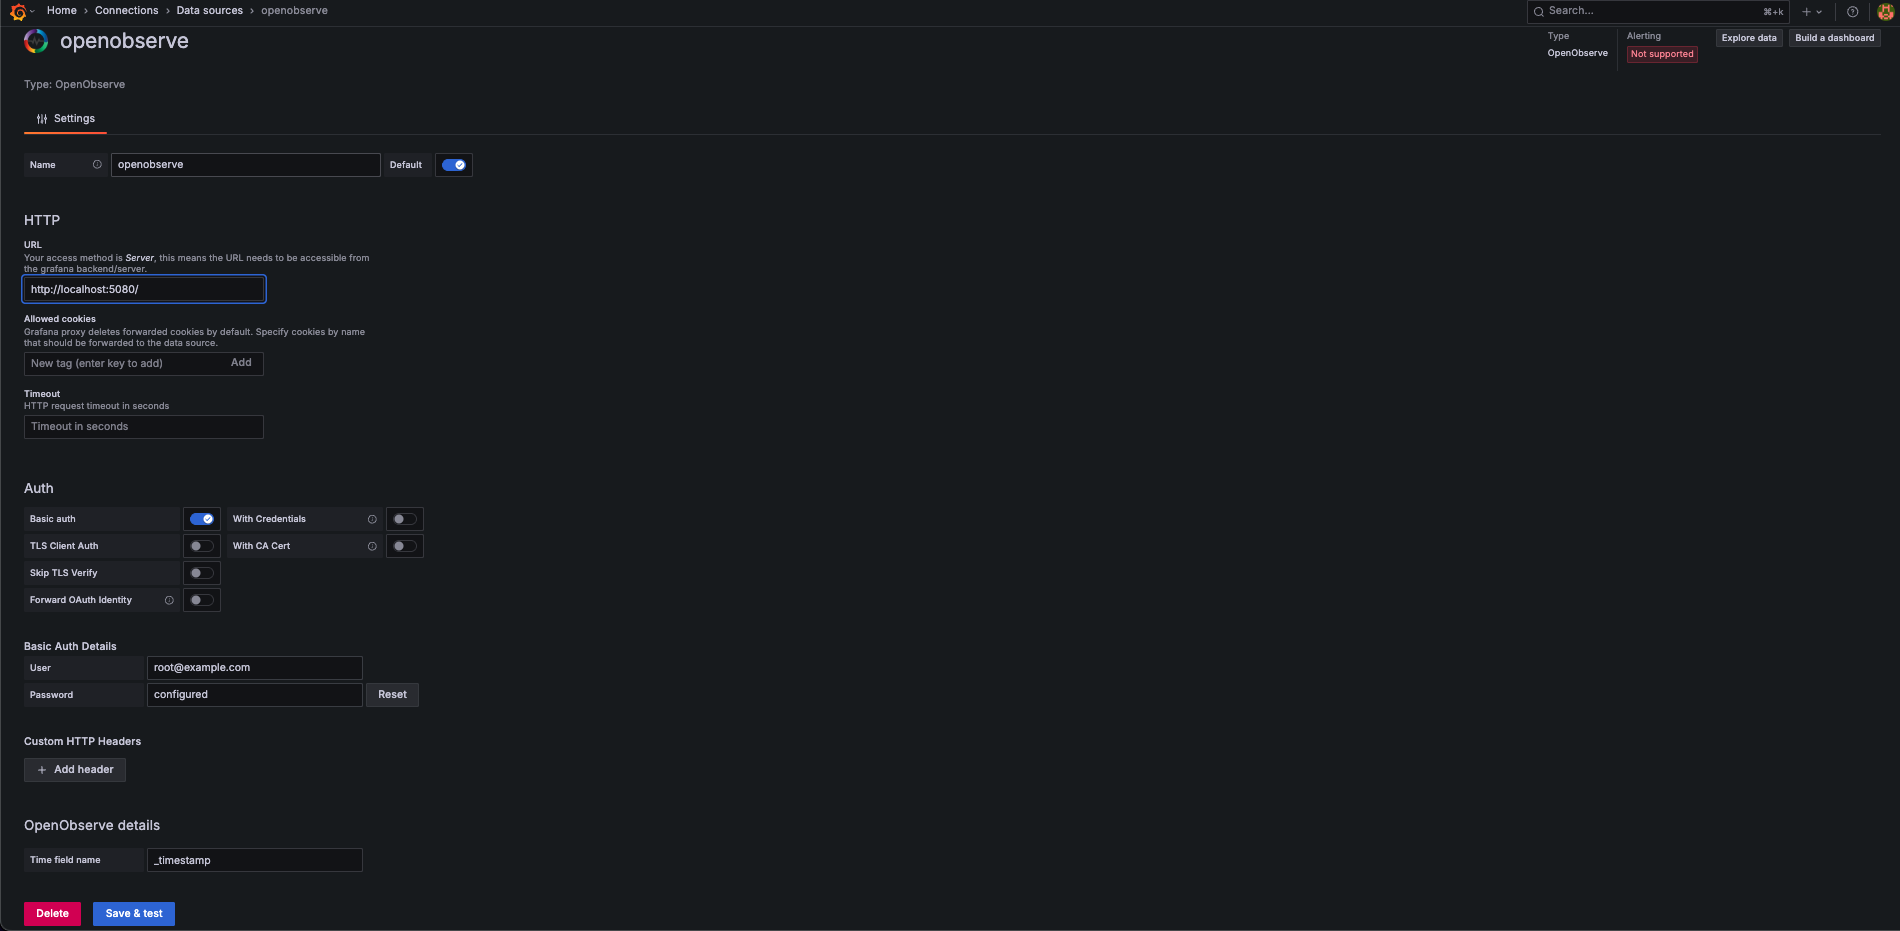
If everything is correct you should see a success message.
:::
:::accordion[Step 3: Explore logs]
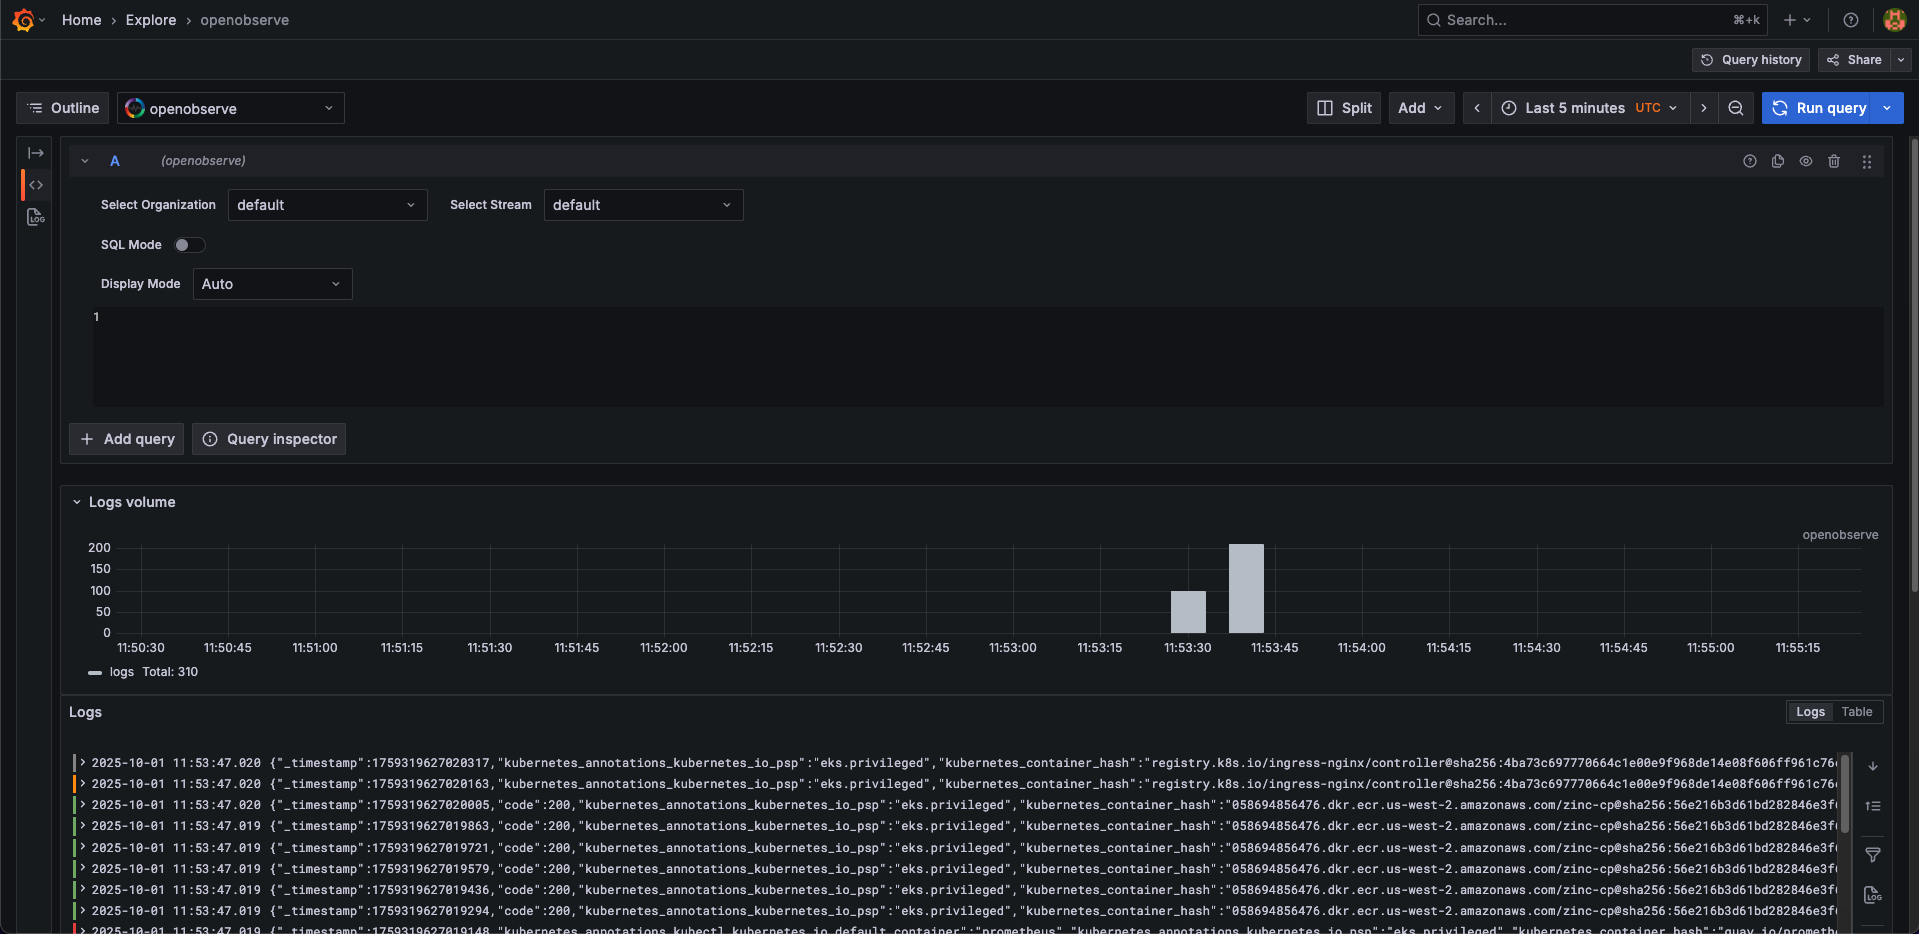
1. Click the **Explore** menu and select `openobserve` as the data source.
2. Select appropriate organization, stream, and time range.
3. Click **Run Query**.
You should now be able to see the results.
:::
:::note[Note]
If you want to explore metrics from OpenObserve in Grafana, you can set up OpenObserve as a Prometheus-compatible data source using an endpoint like [https://api.openobserve.ai/api/org_name/prometheus](https://api.openobserve.ai/api/org_name/prometheus). You do not need the plugin for this, as Grafana supports Prometheus natively.
:::