---
title: Spring AI
description: Instrument Spring AI applications and send traces to OpenObserve via OpenTelemetry.
---
# **Spring AI → OpenObserve**
Capture LLM call latency, model name, token usage, and request parameters for every Spring AI chat call. Spring AI integrates with Spring Boot's Micrometer observability stack. Add the `micrometer-tracing-bridge-otel` and `opentelemetry-exporter-otlp` dependencies, configure your OTLP endpoint, and every `ChatClient` call is automatically traced with a full span hierarchy.
## **Prerequisites**
* Java 17+
* Maven 3.9+
* An [OpenObserve](https://openobserve.ai/) account (cloud or self-hosted)
* Your OpenObserve **organisation ID** and **Base64-encoded auth token**
* An OpenAI API key
## **Installation**
Add the following to your `pom.xml`:
```xml
org.springframework.boot
spring-boot-starter-parent
3.4.0
17
1.0.4
org.springframework.ai
spring-ai-starter-model-openai
${spring-ai.version}
org.springframework.boot
spring-boot-starter-actuator
io.micrometer
micrometer-tracing-bridge-otel
io.opentelemetry
opentelemetry-exporter-otlp
```
## **Configuration**
Set the following in `src/main/resources/application.yml`:
```yaml
spring:
main:
web-application-type: none
application:
name: spring-ai
ai:
openai:
api-key: ${OPENAI_API_KEY}
chat:
options:
model: gpt-4o-mini
max-tokens: 256
management:
tracing:
sampling:
probability: 1.0
otlp:
tracing:
endpoint: ${OPENOBSERVE_OTLP_URL:https://api.openobserve.ai/api//v1/traces}
headers:
Authorization: ${OPENOBSERVE_AUTH_TOKEN:Basic }
```
The `spring.application.name` value becomes the `service_name` in OpenObserve. Set `web-application-type: none` for command-line applications that do not serve HTTP traffic.
## **Instrumentation**
Inject `ChatClient.Builder`, build a `ChatClient`, and call `.prompt().call().content()`. Spring AI and Micrometer automatically trace each call with no additional code.
```java
import org.springframework.ai.chat.client.ChatClient;
import org.springframework.boot.CommandLineRunner;
import org.springframework.boot.SpringApplication;
import org.springframework.boot.autoconfigure.SpringBootApplication;
import org.springframework.context.annotation.Bean;
@SpringBootApplication
public class MyApp {
public static void main(String[] args) {
SpringApplication.run(MyApp.class, args);
}
@Bean
CommandLineRunner runner(ChatClient.Builder builder) {
return args -> {
ChatClient client = builder.build();
String response = client
.prompt("What is distributed tracing?")
.call()
.content();
System.out.println(response);
System.exit(0);
};
}
}
```
Run with:
```shell
export OPENAI_API_KEY=your-key
mvn spring-boot:run
```
## **What Gets Captured**
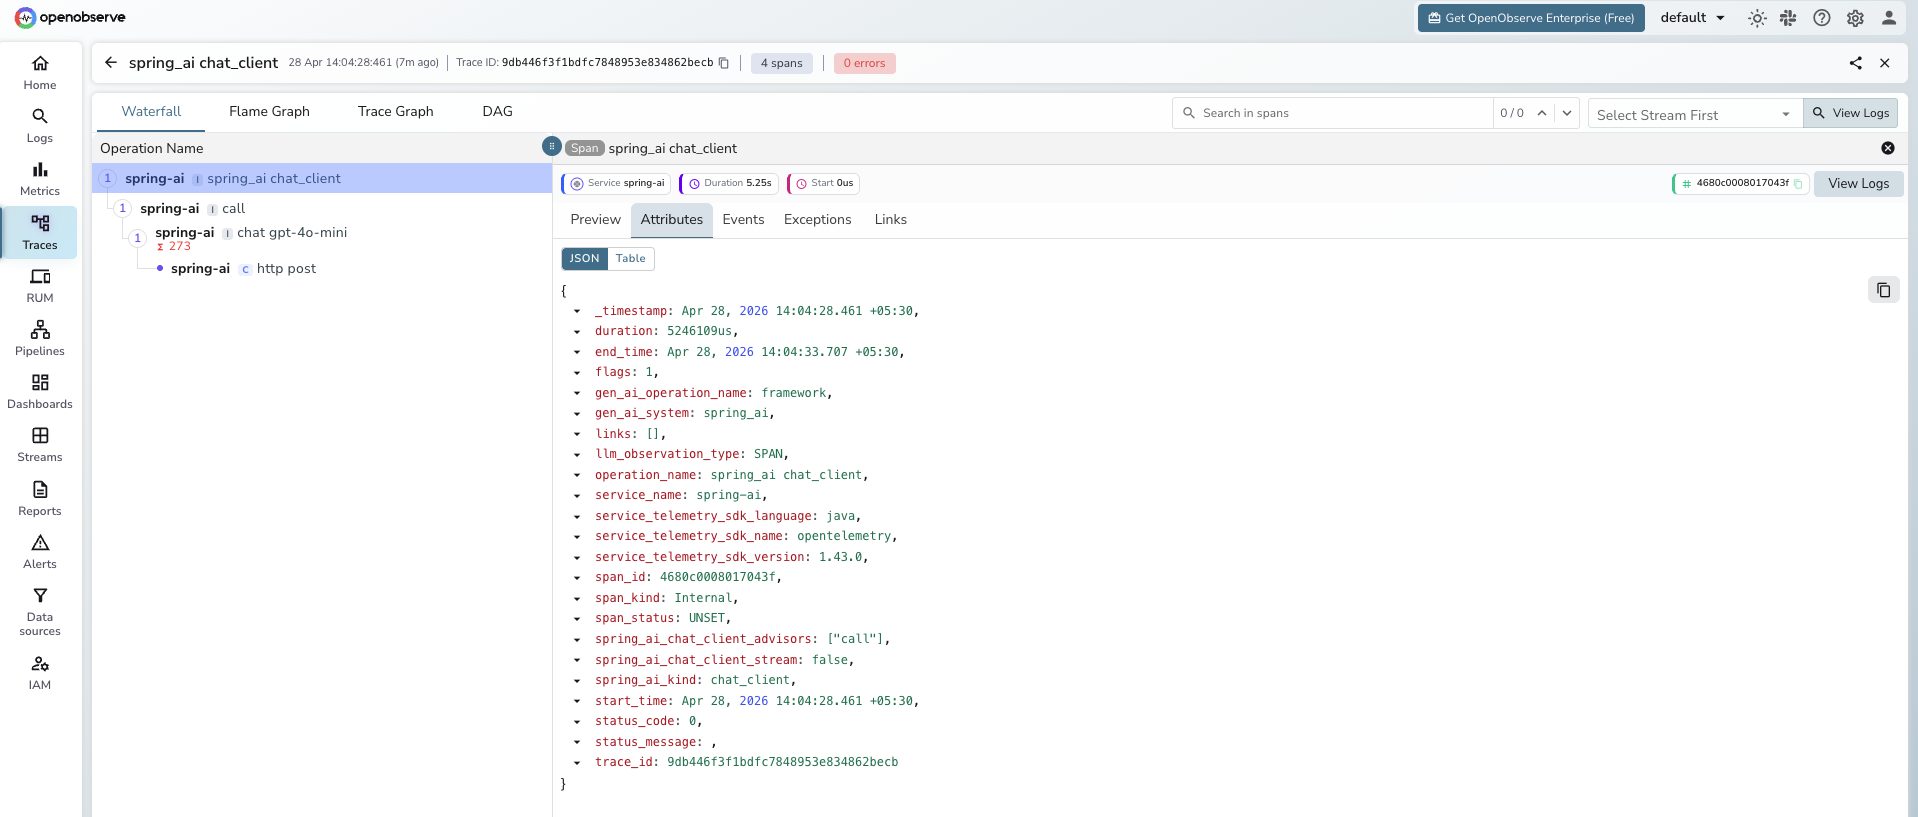
Each `ChatClient` call produces a hierarchy of spans. The innermost LLM generation span carries model and token details.
**LLM generation span** (`chat gpt-4o-mini`):
| Attribute | Example Value |
| ----- | ----- |
| `operation_name` | `chat gpt-4o-mini` |
| `gen_ai_system` | `openai` |
| `gen_ai_operation_name` | `chat` |
| `gen_ai_request_model` | `gpt-4o-mini` |
| `gen_ai_response_model` | `gpt-4o-mini-2024-07-18` |
| `gen_ai_request_max_tokens` | `256` |
| `gen_ai_request_temperature` | `0.7` |
| `gen_ai_response_finish_reasons` | `["LENGTH"]` |
| `gen_ai_usage_input_tokens` | `15` |
| `gen_ai_usage_output_tokens` | `256` |
| `gen_ai_usage_total_tokens` | `271` |
| `llm_usage_tokens_input` | `15` |
| `llm_usage_tokens_output` | `256` |
| `llm_observation_type` | `GENERATION` |
| `span_status` | `UNSET` on success, `ERROR` on failure |
| `duration` | End-to-end LLM call latency in microseconds |
**Outer chat client span** (`spring_ai chat_client`):
| Attribute | Example Value |
| ----- | ----- |
| `operation_name` | `spring_ai chat_client` |
| `gen_ai_system` | `spring_ai` |
| `spring_ai_kind` | `chat_client` |
| `spring_ai_chat_client_advisors` | `["call"]` |
| `spring_ai_chat_client_stream` | `false` |
**HTTP client span** (`http post`):
| Attribute | Example Value |
| ----- | ----- |
| `operation_name` | `http post` |
| `http_url` | `https://api.openai.com/v1/chat/completions` |
| `method` | `POST` |
| `status` | `200` |
| `span_kind` | `Client` |
## **Viewing Traces**
1. Log in to OpenObserve and navigate to **Traces**
2. Filter by `service_name = spring-ai` to see all Spring AI calls
3. Click any trace to expand the full span hierarchy: `chat_client` → `advisor` → `chat` → `http post`
4. Inspect `gen_ai_request_model`, `gen_ai_usage_input_tokens`, and `gen_ai_usage_output_tokens` on the innermost `chat` span
5. Filter by `span_status = ERROR` to find failed chat calls
## **Next Steps**
With Spring AI instrumented, every `ChatClient` call is recorded in OpenObserve. From here you can track token consumption per endpoint, compare latency across models, and alert on error rates across Spring AI services.
## **Read More**
- [LLM Observability Overview](../llm-applications.md)
- [Traces Ingestion](../../../ingestion/traces/index.md)
- [Exploring Traces in OpenObserve](../../../user-guide/data-exploration/traces/index.md)
- [Building Dashboards](../../../user-guide/analytics/dashboards/index.md)