---
title: Aggregate Functions
metaTitle: histogram() Function in OpenObserve
description: "Use the histogram() function to group time-based log data into fixed intervals for trend analysis. Syntax, aggregate use, and a worked 30-second example."
---
Aggregate functions compute a single result from a set of input values. For usage of standard SQL aggregate functions such as `COUNT`, `SUM`, `AVG`, `MIN`, and `MAX`, refer to [PostgreSQL documentation](https://www.postgresql.org/docs/).
## `histogram`
**Syntax**: histogram(field) or histogram(field, 'interval')
**Description:**
Use the `histogram()` function to divide your time-based log data into fixed intervals and apply aggregate functions such as `COUNT()` or `SUM()` to analyze time-series patterns. This helps visualize trends over time and supports meaningful comparisons.
**Syntax:**
```sql
histogram(timestamp_field, 'interval')
```
- `timestamp_field`: A valid timestamp field, such as _timestamp.
- `interval`: A fixed time interval in readable units such as '30 seconds', '1 minute', '15 minutes', or '1 hour'.
**Histogram with aggregate function**
```sql
SELECT histogram(_timestamp, '30 seconds') AS key, COUNT(*) AS num
FROM "default"
GROUP BY key
ORDER BY key
```
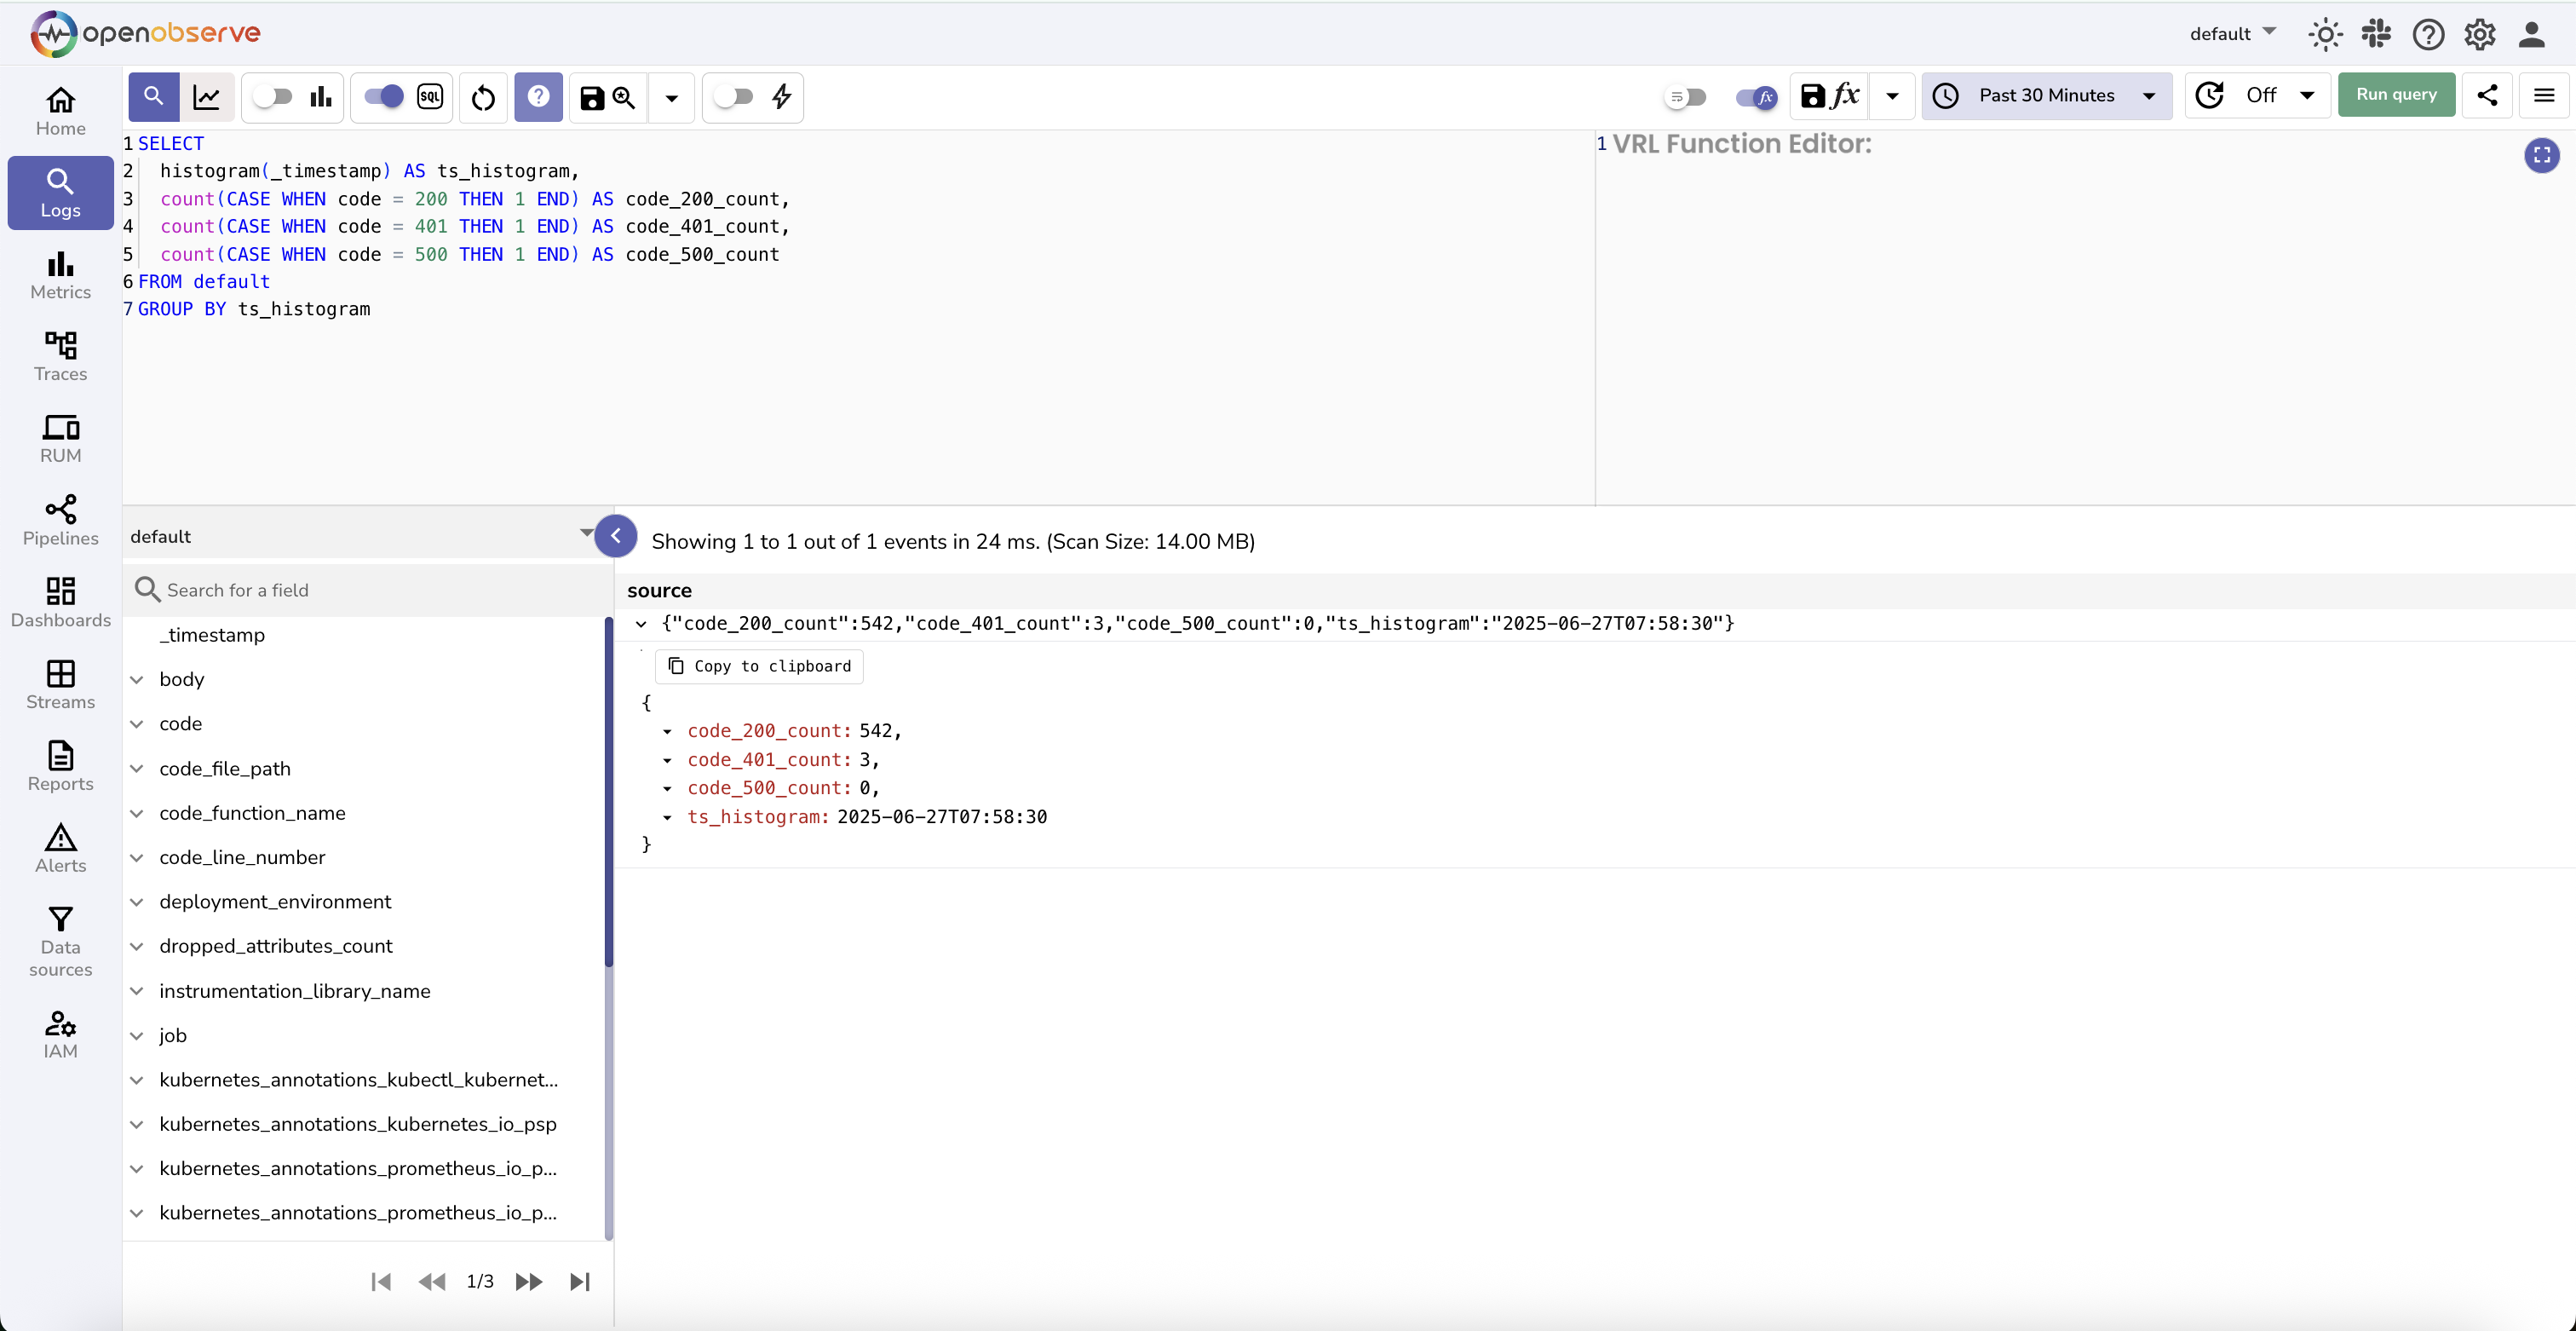
**Expected Output**:
This query divides the log data into 30-second intervals.
Each row in the result shows:
- **`key`**: The start time of the 30-second bucket.
- **`num`**: The count of log records that fall within that time bucket.
:::note[Note]
- If you do not specify an interval, the backend automatically determines a suitable value.
- To ensure consistent bucket sizes and avoid unexpected behavior, it is recommended to always define the interval explicitly.
:::