---
title: Streaming Aggregation
metaTitle: Streaming Aggregation in OpenObserve
description: "How streaming aggregation and the aggregation cache work in OpenObserve Enterprise, and how they speed up repeated queries over large time ranges."
---
This page explains what streaming aggregation is and how it improves query performance in OpenObserve.
:::info[Availability]
This feature is available in Enterprise Edition.
:::
:::::tabs
::::tab[Overview]
## What is streaming aggregation?
Streaming aggregation is an Enterprise feature that enables **aggregation cache**. By default, the streaming aggregation feature is enabled. It allows OpenObserve to cache the factors required to compute aggregates for each time partition during query execution. These cached values can then be reused for later queries that cover the same or overlapping time ranges.
:::accordion[Why aggregation cache matters]
Aggregation queries often scan large volumes of historical data. Without caching, every query recomputes all partitions of the requested time range, even if the results were already computed before.
Aggregation cache works by:
- Caching the factors required to compute aggregates, such as sums and counts, rather than the final aggregate values.
- Reusing these stored values when a later query requests the same partitions.
- Computing only the missing partitions and combining them with cached results.
This approach reduces repeated computation and lowers dashboard latency while preserving accuracy.
:::
:::accordion[Relationship between streaming aggregation and aggregation cache]
- **Streaming aggregation** is the underlying technology that enables aggregation cache.
- **Aggregation cache** is the mechanism that stores and reuses your query results.
:::
:::note[Who can use it]
All Enterprise users.
:::
:::note[Where to find it]
It is **enabled by default** in Enterprise Edition. No manual configuration is required.
:::
:::note[Environment variables]
| Environment Variable | Description | Default Value |
| ------------------------------------------------ | ------------------------------------------------------------------------------------------------------------------------------------------ | --------------------------------- |
| `ZO_FEATURE_QUERY_STREAMING_AGGS` | Enables or disables streaming aggregation. When set to `true`, aggregation queries use the aggregation cache. | `true` |
| `ZO_DATAFUSION_STREAMING_AGGS_CACHE_MAX_ENTRIES` | Defines the maximum number of cache entries stored for streaming aggregations. Controls how many partition results are retained. | `10000` |
| `ZO_DISK_AGGREGATION_CACHE_MAX_SIZE` | Sets the maximum size for record batch cache on disk. By default, it is 10 percent of the local volume space, capped at 20 GB. | 10 percent of volume, up to 20 GB |
| `ZO_CACHE_DELAY_SECS` | Defines the number of seconds to wait before aggregation results become eligible to cache. | `300 secs` |
| `ZO_AGGREGATION_TOPK_ENABLED` | Enables the `approx_topk` function. | `true` |
:::
---
## How does it work?
**First run: partitioning and caching aggregate factors**
When an aggregation query runs for the first time, OpenObserve divides the requested time range into fixed-size partitions. Each partition is processed separately. Instead of storing the final aggregates, OpenObserve caches the factors required to compute the aggregate. For example, it caches sums and counts, which can later be combined to produce averages.
These results are cached on disk. This creates the initial aggregation cache for the query stream.
**Later runs: reuse of cached partitions**
When another query runs with the same stream, filters, and grouping, OpenObserve checks the cache. If the requested time range overlaps with existing partitions, it reuses the cached results and computes only the missing partitions. Results remain accurate because cached sums, counts, and other stored values can be combined with new results to compute the final aggregates.
---
## How does it handle late-arriving data?
To handle late-arriving data, OpenObserve applies a delay window before marking aggregation results as eligible to cache.
The system compares the query time with the end of the selected time range. If the end of the range falls within the delay window, the result is not cached. This ensures that results include all delayed records before being stored.
The delay window is configured through the environment variable `ZO_CACHE_DELAY_SECS`. The default value is 300 secs. You can adjust this value to match the ingestion delay in your environment. For example, if logs typically arrive with up to 10 minutes of delay, set the variable to 600 secs.
---
## Query Behavior
OpenObserve writes intermediate results into disk as Arrow IPC files. These files store values that can be safely combined later instead of full raw logs.
Example query
```sql
SELECT avg(response_time), sum(bytes), count(*)
FROM access_logs
WHERE status = 200
```
**First run**
Suppose the query time range covers two partitions, A and B. The system scans both partitions fully. It caches sums and counts for each partition.
| Partition | SUM(bytes) | COUNT(*) | SUM(response_time) | AVG(response_time) |
| --------- | ---------- | --------- | ------------------- | ------------------- |
| A | 3000 | 30 | 1500 | 50 |
| B | 5000 | 50 | 2500 | 50 |
**Later runs**
- When you run the same query again for the same or overlapping range, the system fetches results from cached partitions.
- If there is a new partition C, only C is scanned. Cached results for A and B are reused.
- Results are then merged safely.
| Partition | SUM(bytes) | COUNT(*) | SUM(response_time) |
| --------- | ---------- | --------- | ------------------- |
| A | 3000 | 30 | 1500 |
| B | 5000 | 50 | 2500 |
| C | 4000 | 40 | 1600 |
| **Final** | **12000** | **120** | **5600** |
**How averages are calculated**
- **SUM(bytes)** is computed as `3000 + 5000 + 4000 = 12000`.
- **COUNT(*)** is computed as `30 + 50 + 40 = 120`.
- **AVG(response_time)** is computed from merged sums and counts: `5600 ÷ 120 = 46.67`.
---
## Cached file names
Cached file names reflect the start and end timestamps of the partition. For example:
```
/data/openobserve/cache/aggregations/default/logs/oly/
13018130667245808899_30/
1756116000000000_1756117800000000.arrow
```
---
## Guarantee of accuracy
Accuracy is guaranteed by [Apache Arrow DataFusion](https://arrow.apache.org/blog/2023/08/05/datafusion_fast_grouping/). OpenObserve caches DataFusion’s internal intermediate representation on disk and DataFusion later combines and finalizes it, producing the same results as a fresh run over the same stream, filters, grouping, and time range.
---
## Cacheability of Queries
Not all queries can benefit from aggregation cache. For a query to be cacheable, OpenObserve must be able to store and safely merge intermediate results across partitions.
---
## Supported aggregate functions
The following aggregates are directly supported for caching:
- min
- max
- sum
- count
- avg
- median
- array_agg
- percentile_cont
- summary_percentile
- first_value
- last_value
- [approx_distinct](https://datafusion.apache.org/user-guide/sql/aggregate_functions.html#approx-distinct)
- [approx_median](https://datafusion.apache.org/user-guide/sql/aggregate_functions.html#approx-median)
- [approx_percentile_cont](https://datafusion.apache.org/user-guide/sql/aggregate_functions.html#approx-percentile-cont)
- [approx_percentile_cont_with_weight](https://datafusion.apache.org/user-guide/sql/aggregate_functions.html#approx-percentile-cont-with-weight)
- [approx_topk](https://openobserve.ai/docs/reference/sql-functions/approximate-aggregate/approx-topk/)
- [approx_topk_distinct](https://openobserve.ai/docs/reference/sql-functions/approximate-aggregate/approx-topk-distinct/)
---
## Aggregation cache metrics
OpenObserve exposes Prometheus metrics to monitor aggregation cache performance and memory usage.
| Metric | Description |
|--------|-------------|
| `zo_query_aggregation_cache_items` | Monitor to understand cache utilization and verify that streaming aggregation is populating the cache as expected |
| `zo_query_aggregation_cache_bytes` | Monitor memory consumption to ensure the cache stays within acceptable limits and doesn't exhaust system resources |
---
::::
::::tab[Verifying aggregation cache]
## Verifying aggregation cache
**Example query**
```sql
SELECT
k8s_deployment_name as "x_axis_1",
count(_timestamp) as "y_axis_1"
FROM "default"
GROUP BY x_axis_1
```
You can apply the aggregation query in any place where queries are executed, such as Logs or Dashboards. To measure load time, check cacheability, and verify cache usage, use your browser’s developer tools.
Right-click the browser, select **Inspect**, open the **Network** tab, and filter by **Fetch/XHR**.
The following example is performed with [Streaming Search](https://openobserve.ai/docs/user-guide/data-processing/streams/summary-streams/) enabled. Aggregation cache works the same when Streaming Search is disabled.
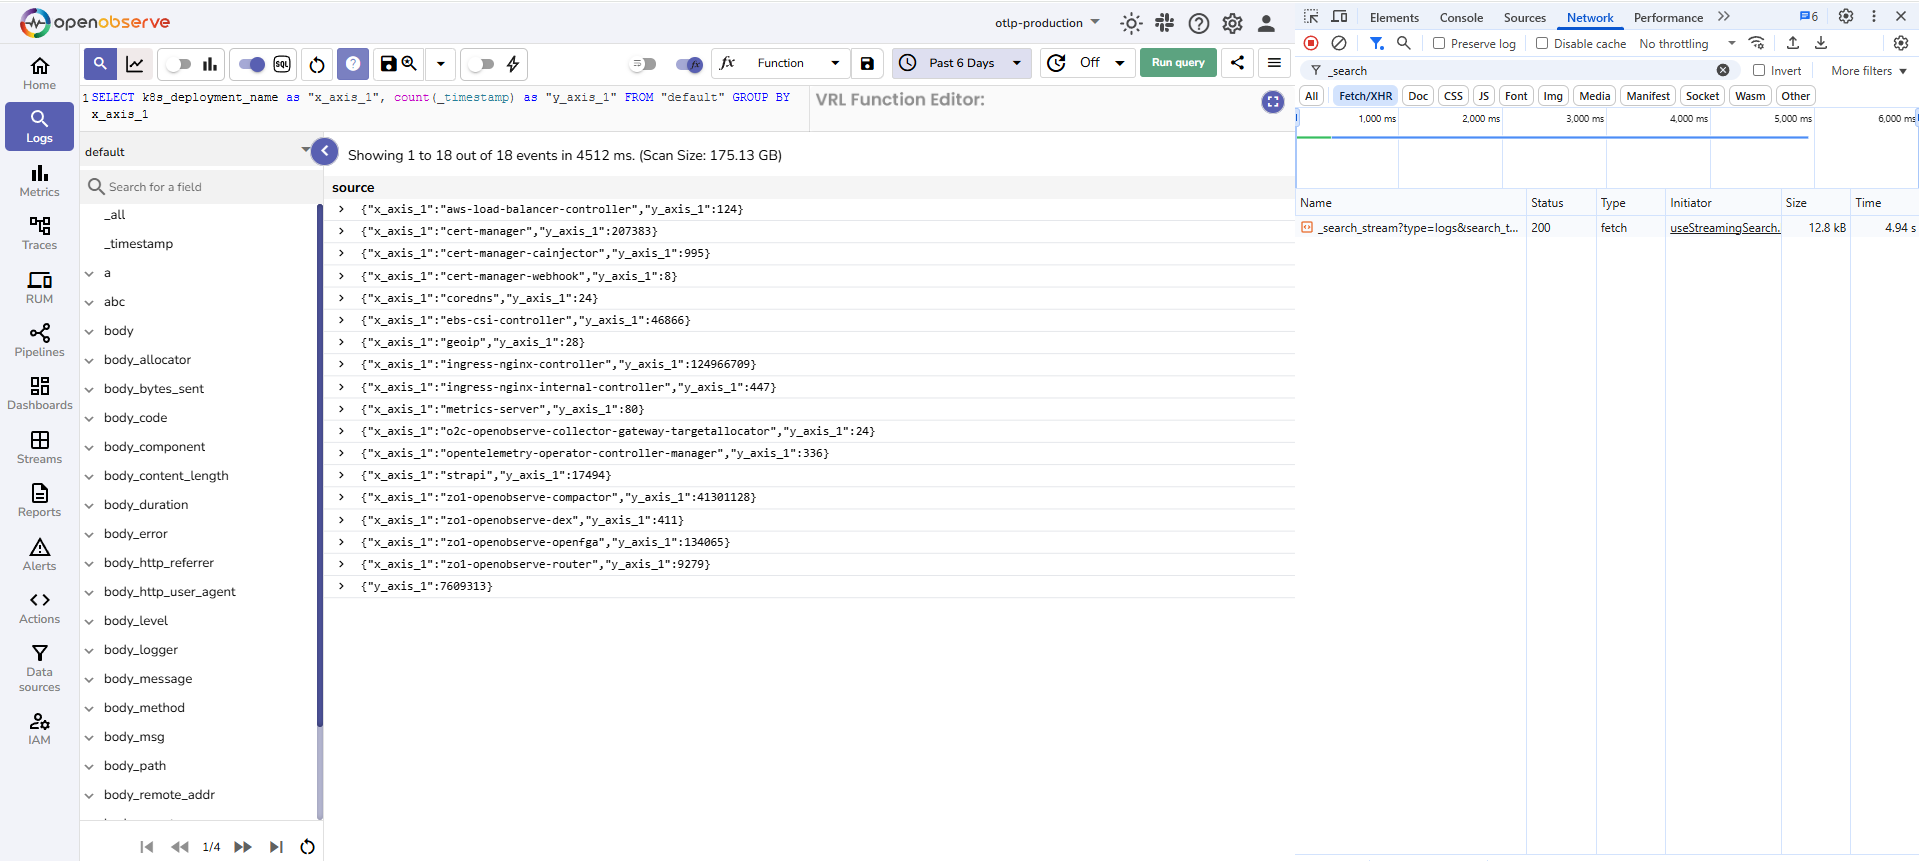
**Step 1: Run the aggregation query**
1. Go to the **Logs** page.
2. In the SQL query editor, enter the aggregation query.
4. Select a time range, for example Past 6 days.
5. Select **Run Query**.
The results show event counts per deployment.
**Step 2: Check if the query is eligible for caching**
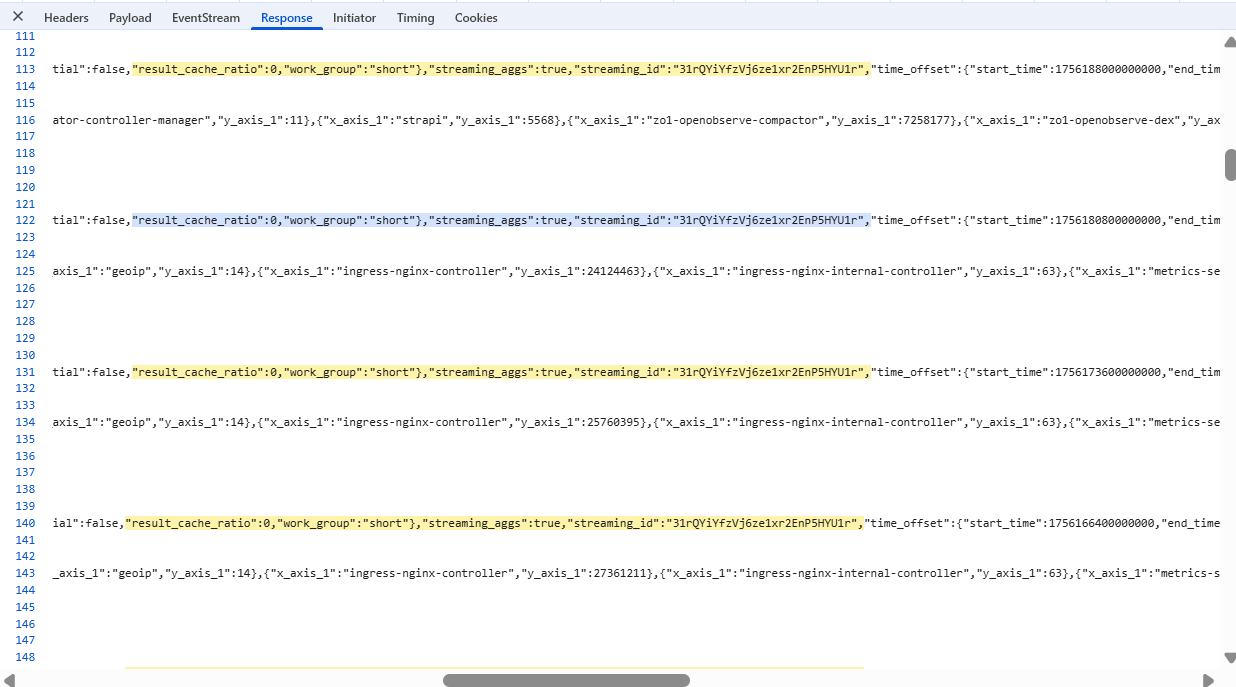
After the first run, if `streaming_aggs` is true and `streaming_id` has a value, the query is eligible for caching. You can check these fields in the query response by using your browser developer tools. Open **Network**, select the `_search_partition` entry, and view the **Response** tab to confirm the values.
**Step 3: Run the query again with overlapping time**
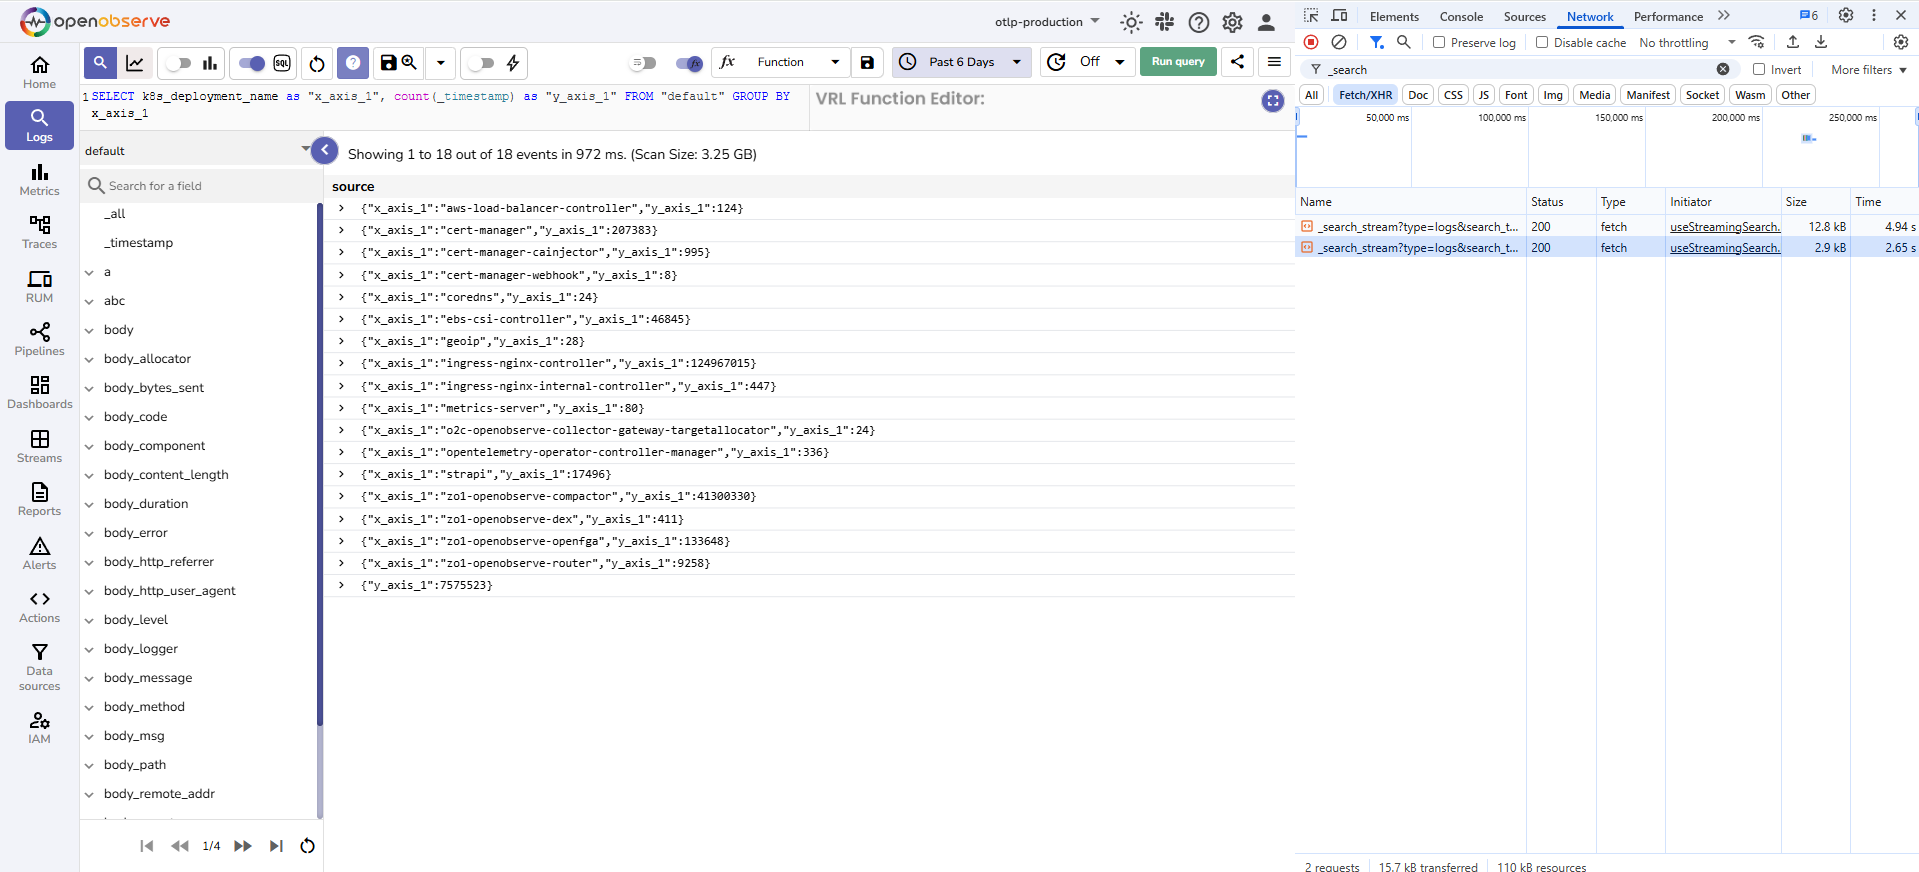
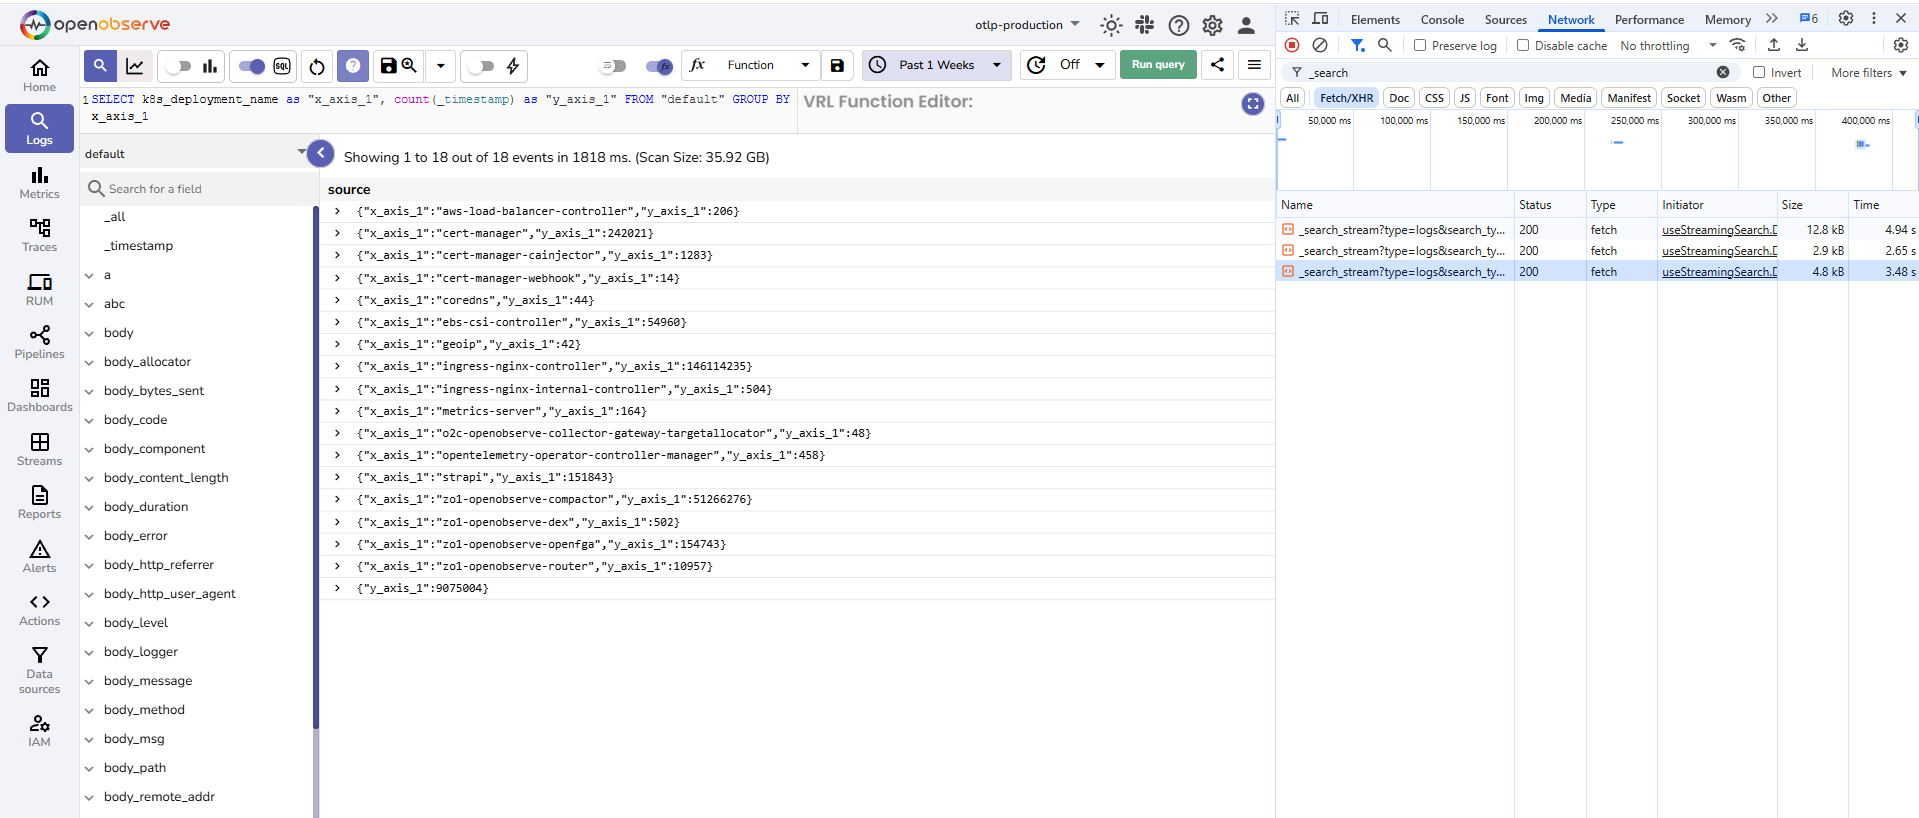
Select a time window that overlaps with the earlier run, for example Past 6 days or Past 1 week, and run the query again. Cached partitions are reused and only new partitions are computed, which reduces execution time.
Second run shows the result for the Past 6 days.
Third run shows the result for the Past 1 week.
**Step 4: Confirm cache reuse on later runs**
Use your browser developer tools.
1. In the Network tab of your developer tool, select one of the later runs.
2. Open **Response**.
3. Capture the following details:
- `streaming_aggs` must be true
- `streaming_id` must have a value
- `streaming_output` must be true
- `result_cache_ratio` per partition:
- `100` means the partition came from aggregation cache.
- `0` means the partition was computed on this run.
**Notes:**
- The first successful run does not reuse aggregation cache because nothing has been stored yet.
- Ratios other than 0 or 100 indicate general result caching, not aggregation cache.
---
::::
:::::
## Performance benefits
The following test runs demonstrate aggregation cache performance improvements:
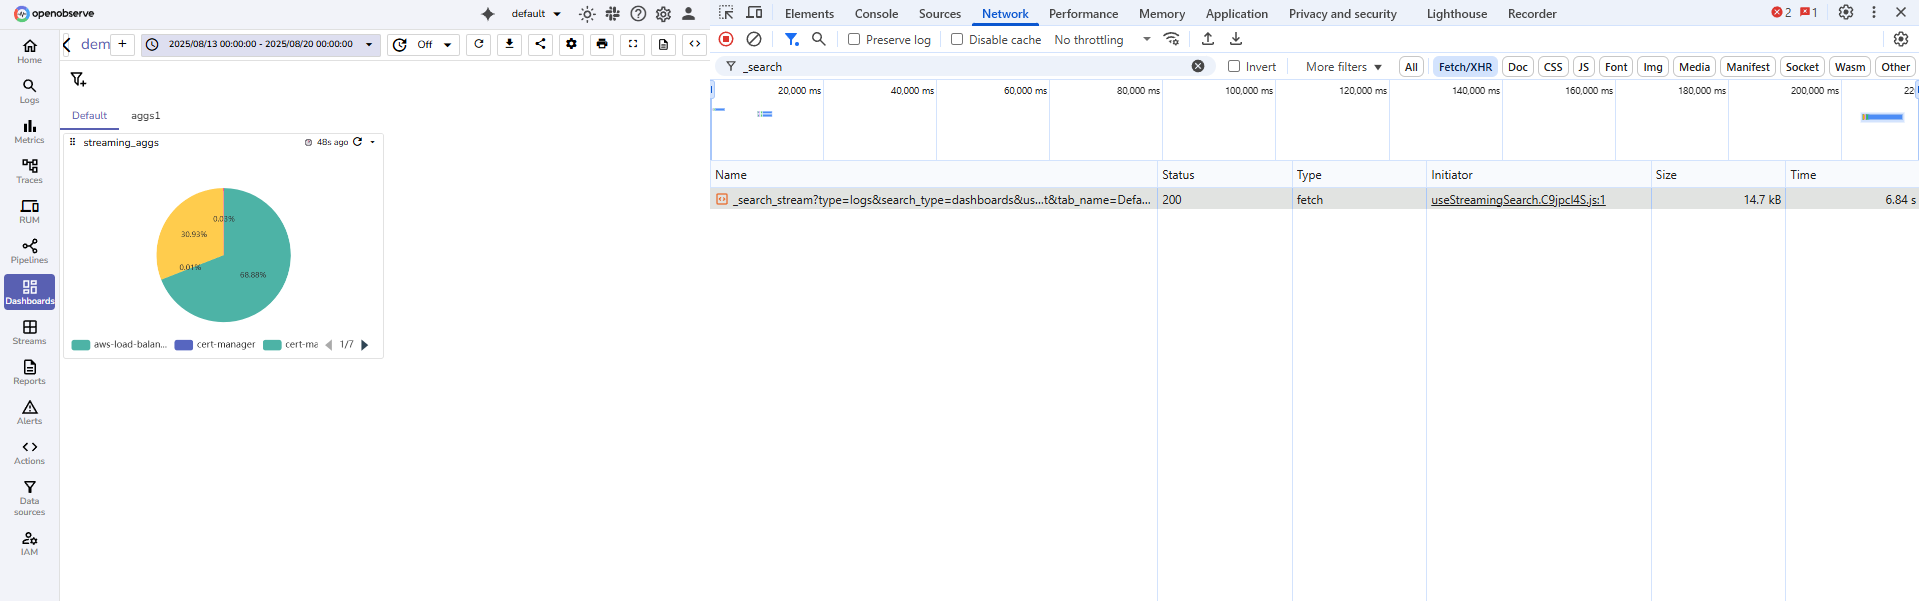
**Test run 1**:
- Time range: `2025-08-13 00:00:00 - 2025-08-20 00:00:00`
- Time taken to load the dashboard: `6.84 s`
- `result_cache_ratio` is `0` in all partitions
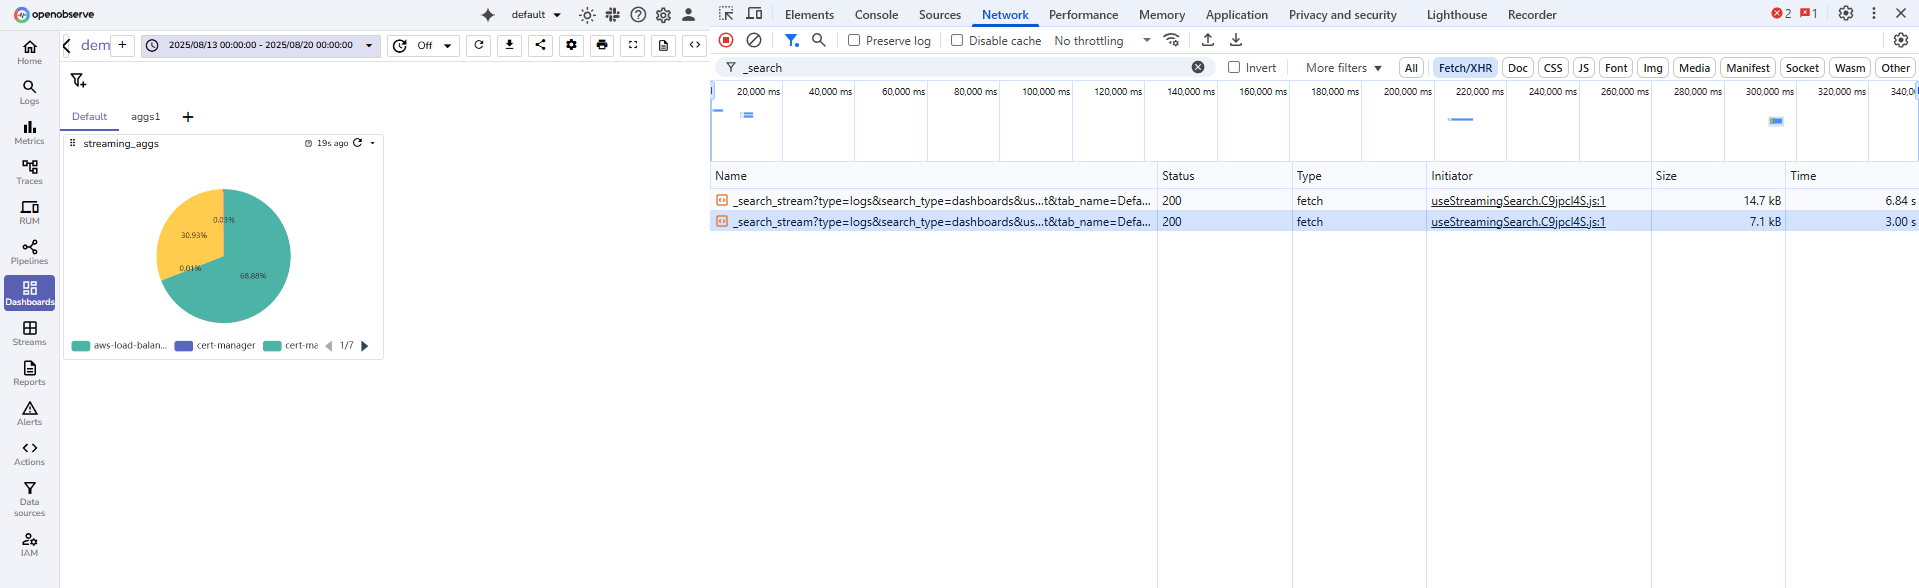
**Test run 2**:
- Time range: `2025-08-13 00:00:00 - 2025-08-20 00:00:00`
- Time taken to load the dashboard: `3.00 s`
- `result_cache_ratio` is `100` in all partitions
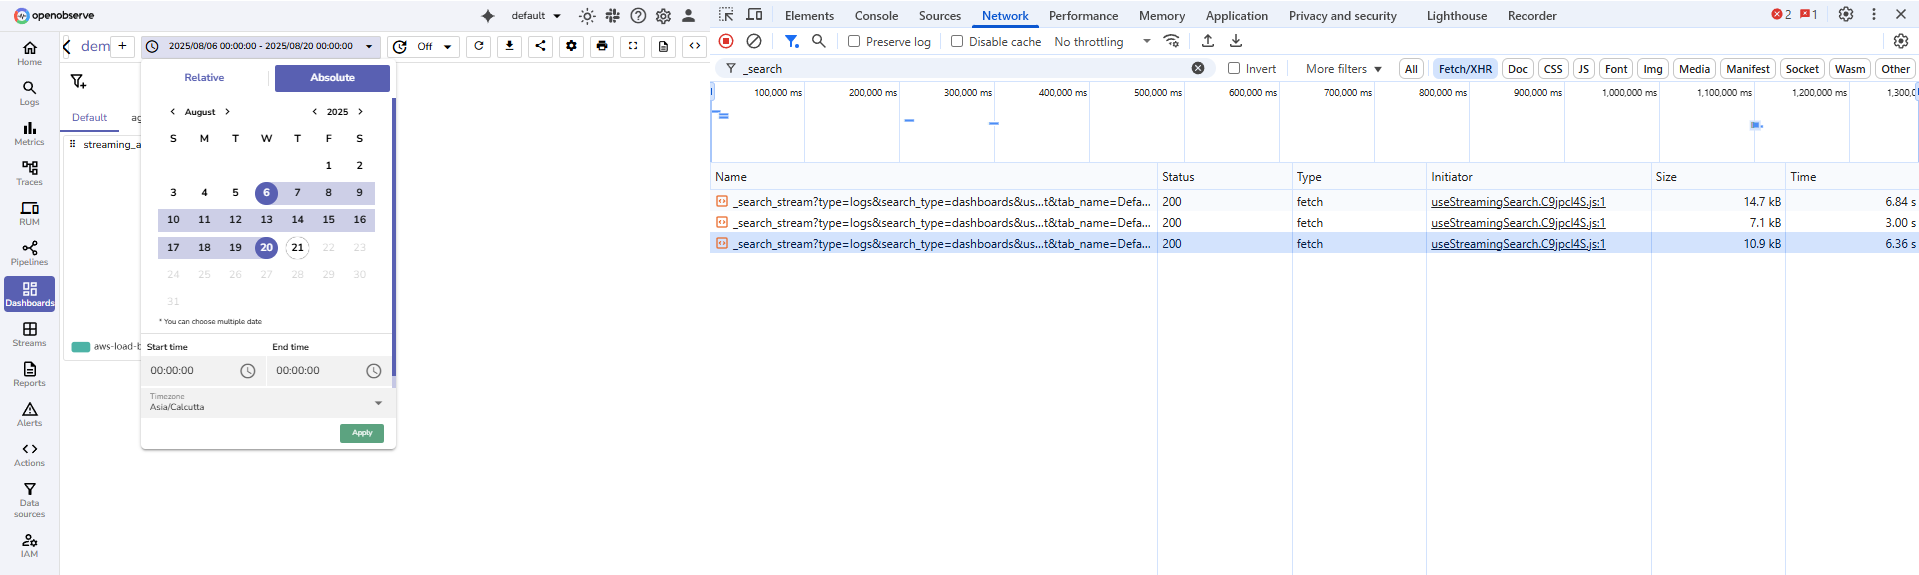
**Test run 3**:
- Time range: `2025-08-6 00:00:00 - 2025-08-20 00:00:00`
- Time taken to load the dashboard: `6.36 s`
- `result_cache_ratio` is `100` for partitions that cover the time range `2025-08-13 00:00:00 → 2025-08-20 00:00:00` and `result_cache_ratio` is `0` for the rest of the partitions
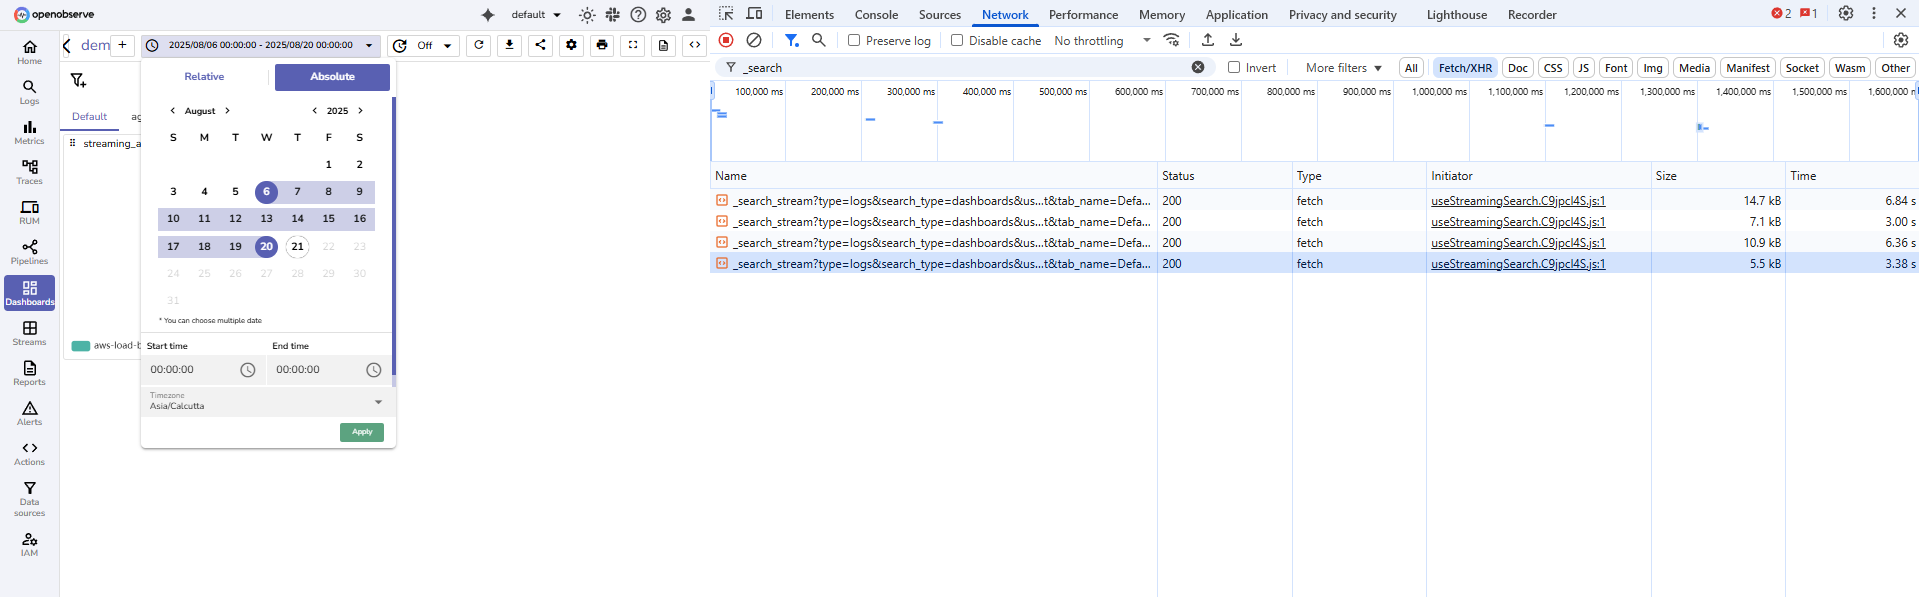
**Test run 4**:
- Time range: `2025-08-6 00:00:00 - 2025-08-20 00:00:00`
- Time taken to load the dashboard: `3.38 s`
- `result_cache_ratio` is `100` for all partitions
---
## Limitations
- Very complex queries may not be eligible for cache reuse yet. Examples include joins, nested subqueries, heavy window functions, and large unions.
- The first run pays full computation cost to populate the cache.
- Reuse depends on partition availability. Eviction due to capacity limits can reduce reuse.
---
## Troubleshooting
- **Issue**: **Second run is not faster**
- **Cause**: The query was not cacheable or the first run did not complete.
- **Fix**: Align time windows and filters with the first run. Verify `streaming_aggs` and `streaming_id`. After a successful first run, confirm `result_cache_ratio` equals `100` on some partitions.