---
title: Query Management
description: Monitor and cancel live queries across dashboards, alerts, and logs; inspect execution time, range, user, and more in HA deployments.
---
This page explains what Query Management is and shows how to use it.
:::info[Availability]
This feature is available in Enterprise Edition. Not available in Open Source and Cloud.
:::
:::::tabs
::::tab[Overview]
## What is Query Management?
The Query Management feature provides real-time visibility and control over all currently running queries across dashboards, alerts, logs, and reports within an OpenObserve instance. Using the Query Management page, you can decide whether to cancel a query or leave it running.
:::note[Who can use it]
By default, `root` users and any other user who has access to the `_meta` org can access the Query Management page.
:::
:::note[Where to find it]
To access the Query Management page:
1. Select `_meta` organization from the top right corner.
2. Go to **Management**.
3. In the side panel, select **Query Management**.
You will be taken to the **Running Queries** section.
:::
## Viewing Modes
You can toggle between:
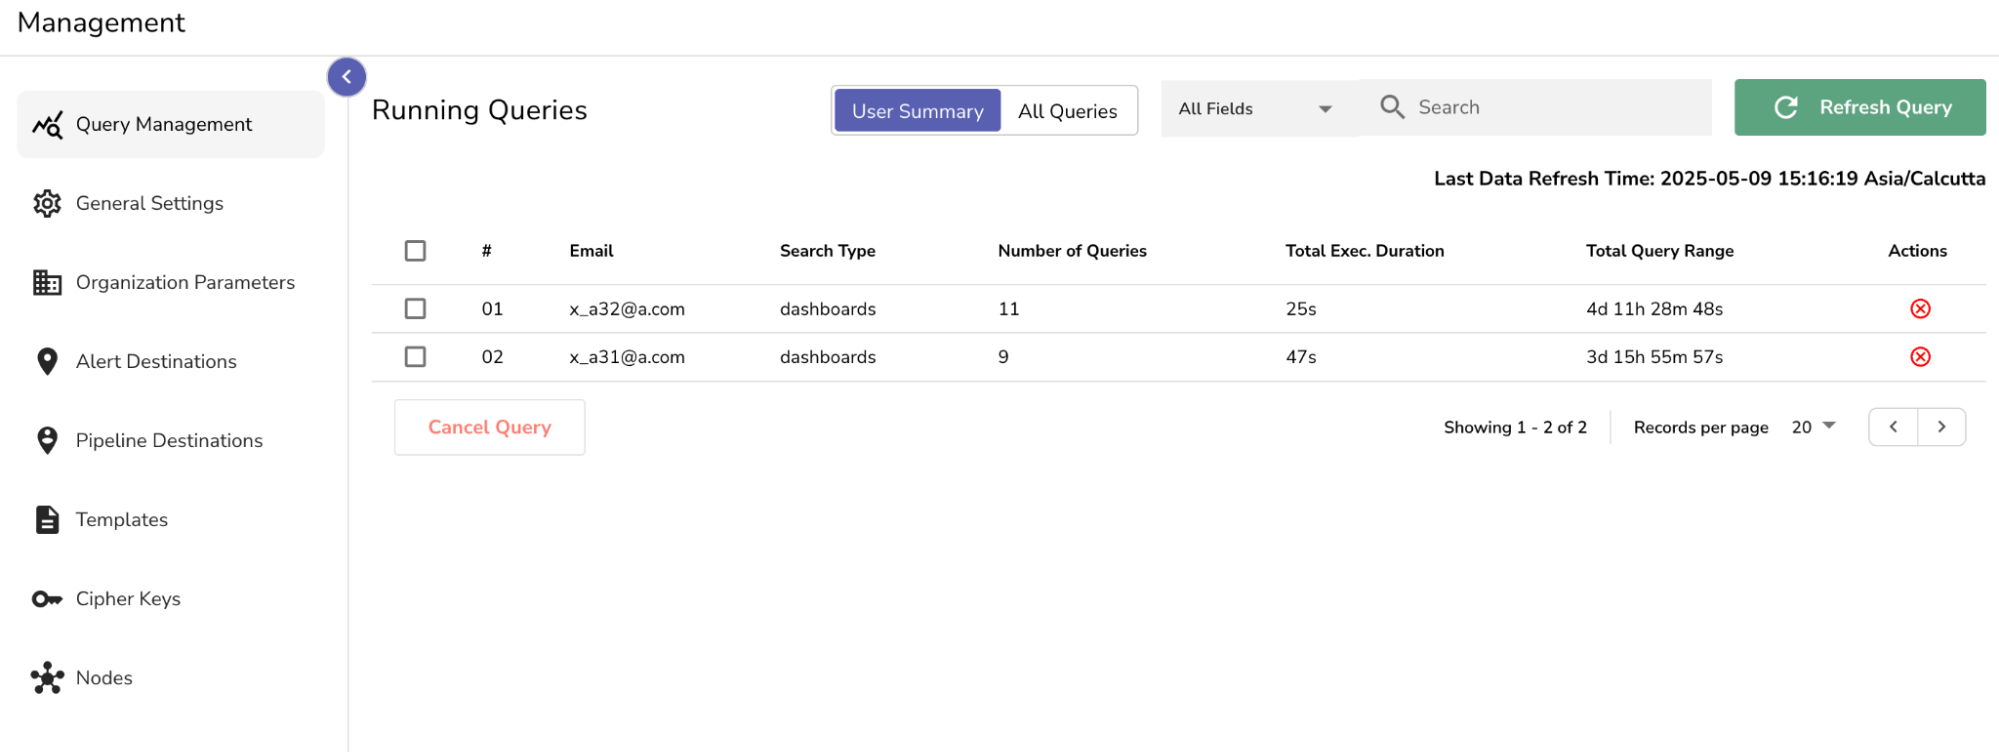
- **User Summary**: Groups all queries by user and displays their combined activity.
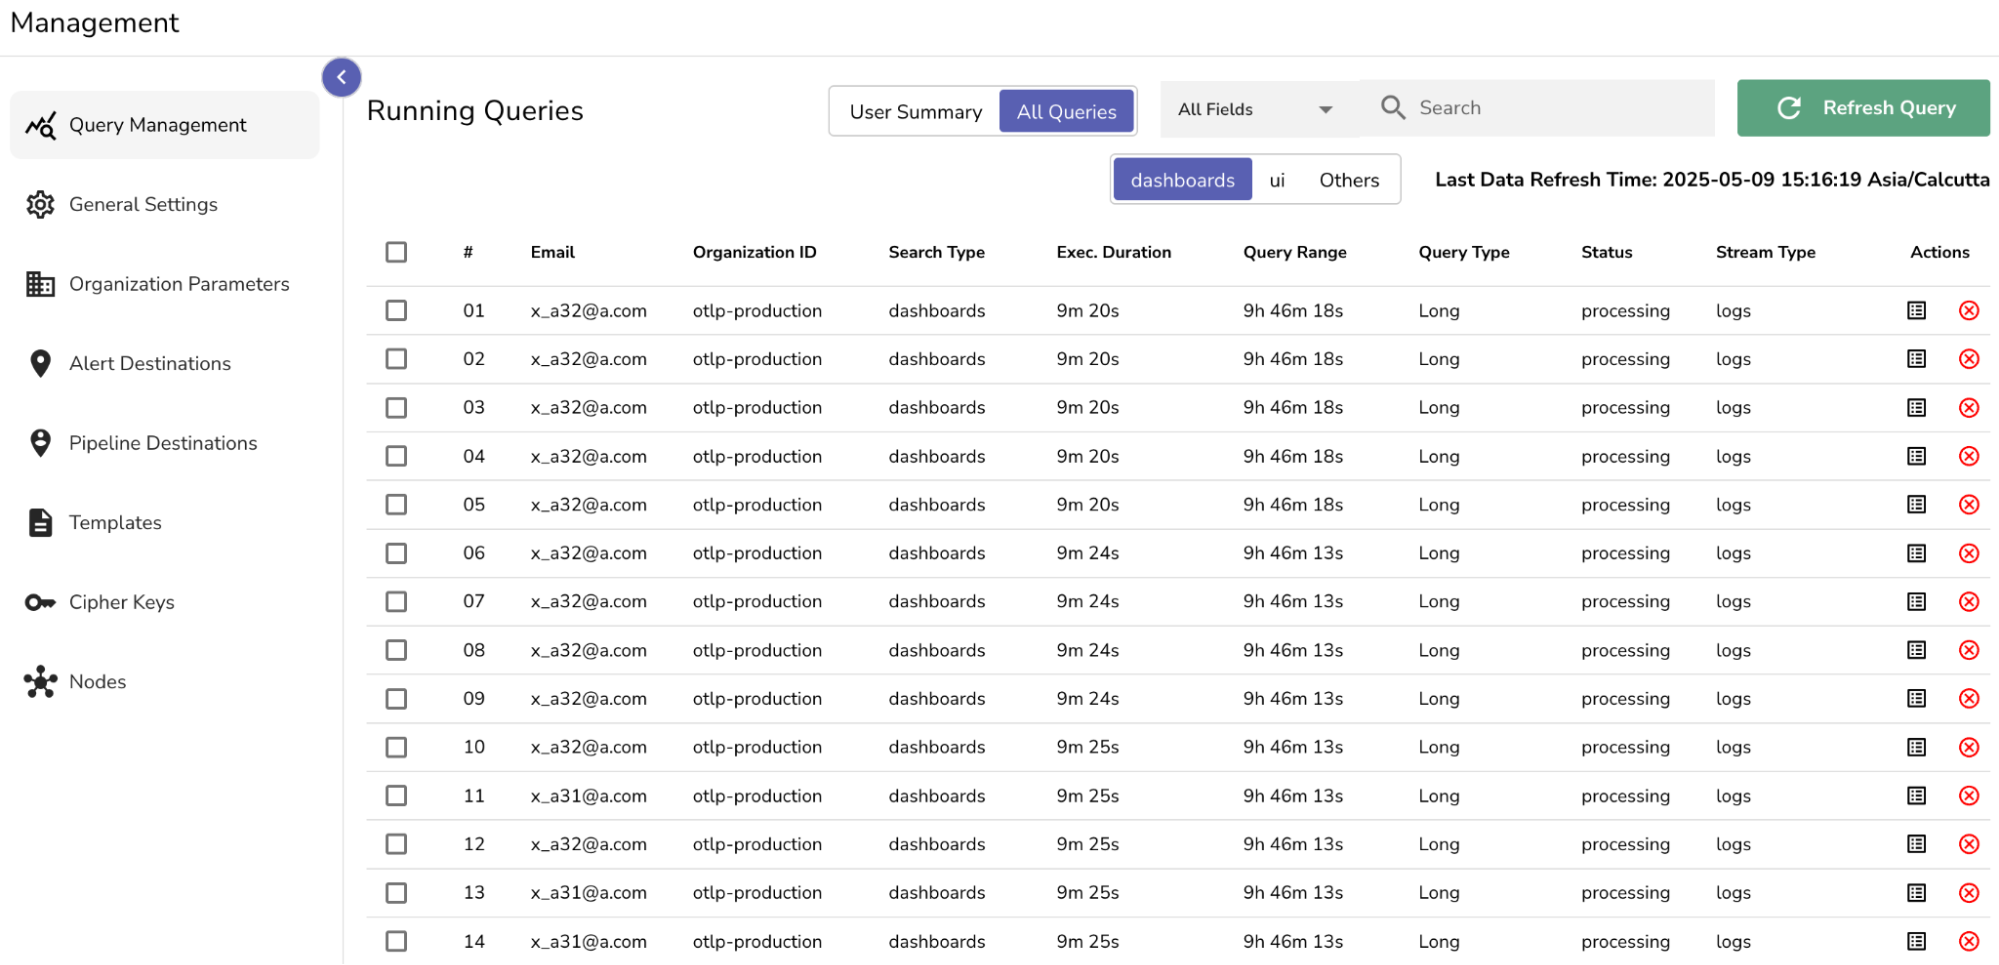
- **All Queries**: Displays each query individually with full details and filtering options.
Use **User Summary** for high-level monitoring. Switch to **All Queries** when you need to investigate specific query behavior.
## Page Layout and Field Descriptions
The **Running Queries** table displays the following fields:
- **Email**: The email ID of the user who initiated the queries.
- **Search Type**: The origin of the query. For example, dashboards, alerts, or others.
- **Number of Queries**: Total active queries for that user.
- **Total Exec. Duration**: Combined time spent executing all active queries.
- **Total Query Range**: Total log duration the queries are scanning.
- **Actions**: Cancel queries initiated by a user.

The **All Queries** table displays the following fields:
- **Email:** The email of the user who triggered the query.
- **Organization ID:** The organization context.
- **Search Type:** The source of the query, such as dashboards, alerts, or others.
- **Query Source:** Displays the specific origin of the query. If the query originates from a **dashboard**, this field shows the dashboard name. If the query originates from an **alert**, it shows the alert name.
- **Execution Duration:** The total time the query has been running.
- **Query Range:** The time range being queried.
- **Query Type:** Whether the system classifies the query as Short or Long.
- **Status:** The current status of the query, whether it is still processing or waiting.
- **Stream Type:** The type of data stream being queried, such as logs.
- **Actions:** Two actions available:
- **View Details** to inspect the query details.
- **Cancel** to stop the query immediately.
## Filters and Searches
- **Search Bar**: Enter an email or keyword to filter queries.
- **All Fields Dropdown**: The **All Fields dropdown** lets you filter queries based on either **Execution Duration** or **Query Range**. Range.
- **Source Filter**: Filter queries by source. Select one of the following:
- **Dashboards**: Queries coming from Dashboards.
- **UI**: Queries run manually by users from the Logs interface.
- **Others**: Queries triggered by Alerts or Reports.
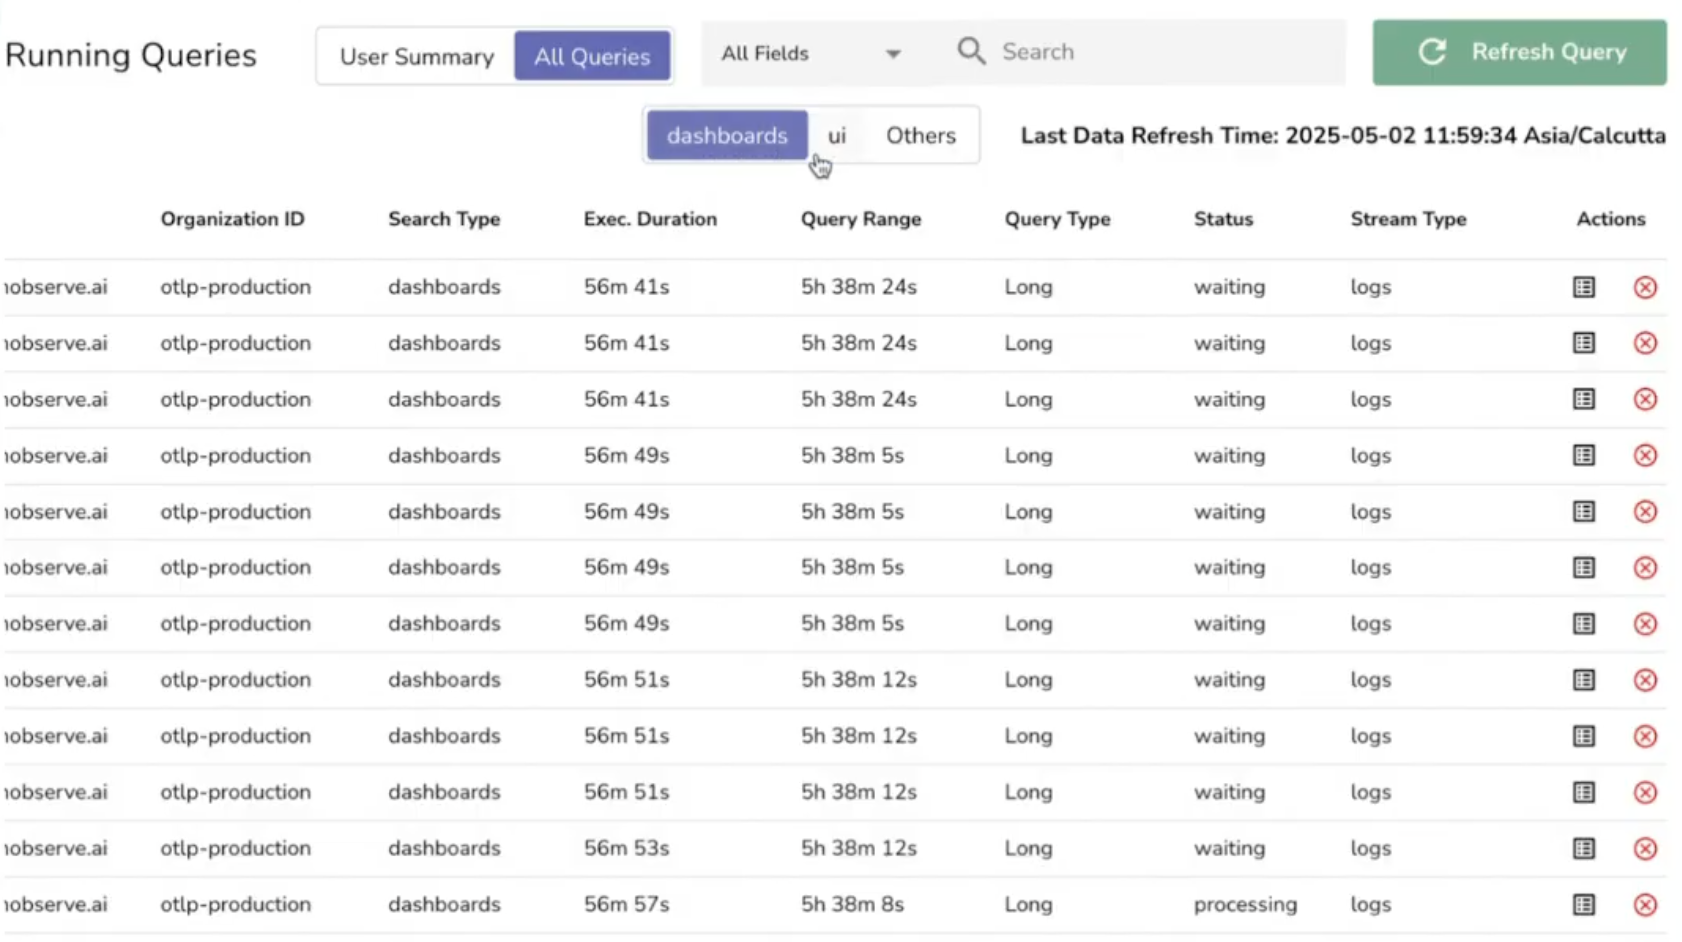
- **Refresh Query Button**: Click to reload the page with the latest query data. Refer to the **Last Data Refresh Time** section to confirm whether the query results are up to date before refreshing.
::::
::::tab[How to]
## How to View Query Details
To inspect a running query:
1. In the **All Queries** view, locate the query you want to examine.
2. In the **Actions** column, click the icon to **view details**.
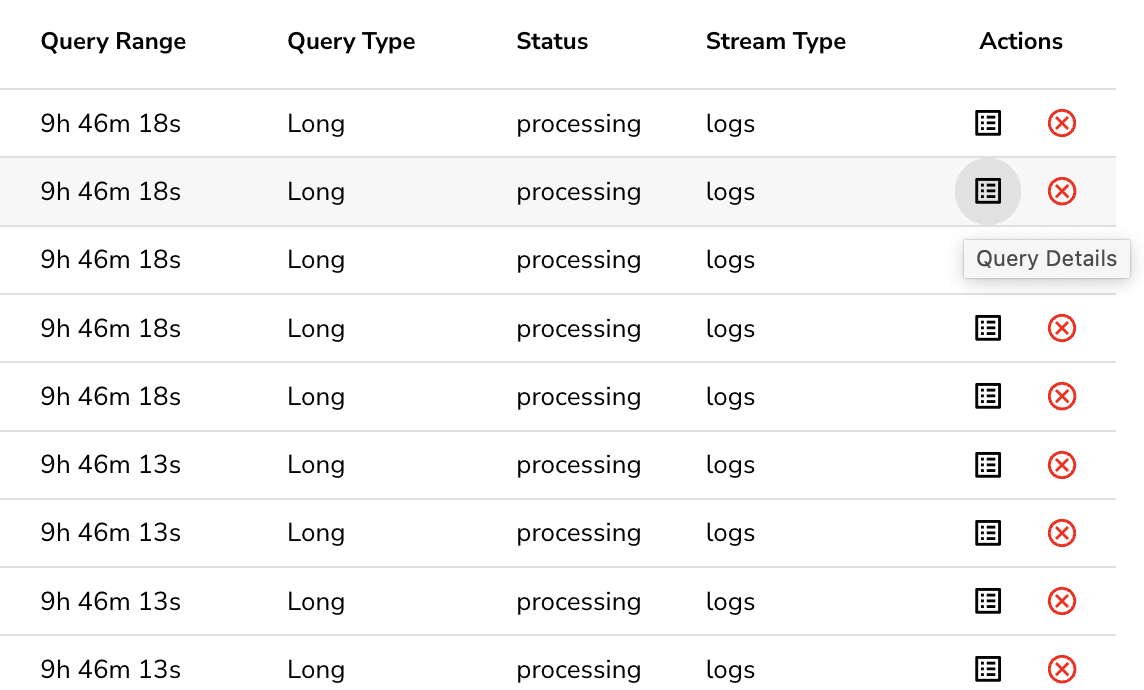
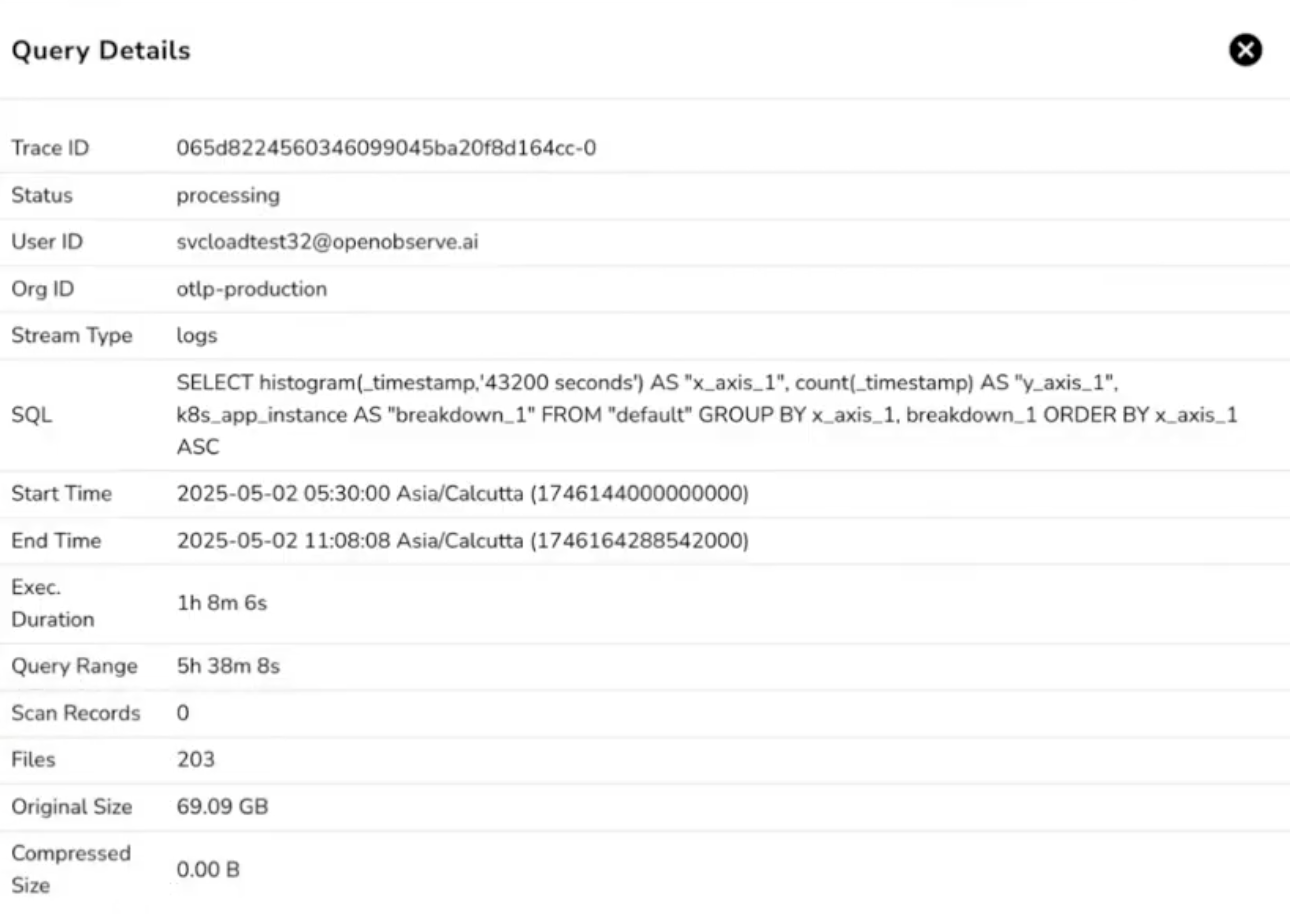
You will see a pop-up with full information about the query:
- Unique Trace ID.
- Current status (e.g., waiting, processing).
- User email and organization ID.
- Stream type (e.g., logs).
- The complete SQL query.
- The start time and end time selected by the user. This defines the **Query Range**.
- The **Execution Duration** and final **Query Range** calculated.
- Additional technical metrics, including the number of records scanned within the selected time range, the original size of the scanned files, and their compressed size in Parquet format.
## How to Cancel a Query
Before you begin:
Canceling a query may interrupt active investigations. Confirm the impact before proceeding.
:::note[When should you cancel a query]
You should cancel a query if any of the following are true:
- The execution time has exceeded acceptable limits.
- The time range being queried is too wide.
- The system is under strain, and this query appears in a long or waiting state.
:::
:::note[When should you not cancel a query]
The query is from a critical source.
:::
You can cancel a query from the **User Summary** page as well as the **All Queries** view.
**To cancel from User Summary**:
1. Locate the user whose queries you want to stop.
2. Either select the checkbox and click **Cancel Query** at the bottom of the page, or click the red **X** icon in the **Actions** column.
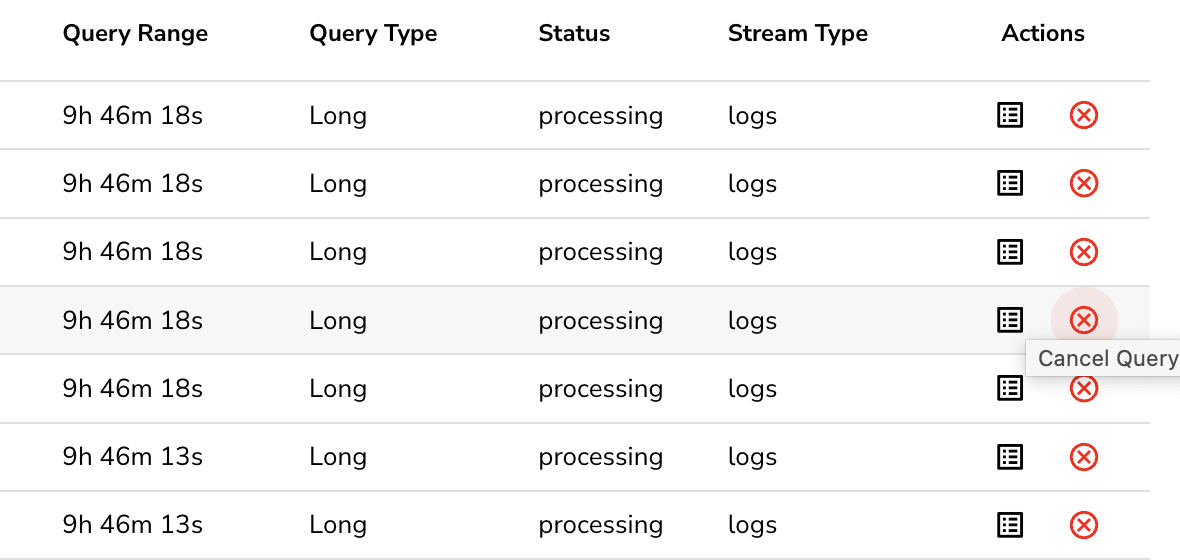
**To cancel from All Queries**:
1. Find the query you want to cancel.
2. In the **Actions** column, click the red `X` icon.
After you confirm, the query is terminated immediately.
::::
:::::