---
title: Alert History
description: Alert History records every alert evaluation in OpenObserve's triggers stream, letting you read status codes and retries and debug failed or skipped alerts.
---
This guide provides information about how the Alert History feature in OpenObserve works, where the data originates from, who can access it, how to interpret the Alert History table, and how to debug failed or skipped alerts.
## Overview
OpenObserve records alert evaluation events in a dedicated stream called `triggers`. Each organization has its own `triggers` stream. When an alert is evaluated, the evaluation result is written to the triggers stream inside that organization. OpenObserve also writes a copy of the same event to the `triggers` stream in the `_meta` organization for organization level monitoring.
> An evaluation is the system checking whether the alert’s condition is true. For scheduled alerts, this check happens at the set frequency. For real time alerts, the check happens whenever new data arrives. The condition defines what should trigger the alert.
A trigger happens when the evaluation finds the condition to be true. This creates a firing event and can send a notification if one is set.
:::note[Who can access it]
Any user who has permission to view, update, or delete alerts can also access Alert History. Users do not need access to the `_meta` organization to view alert history for their own organization. Access to the `_meta` organization is only required when administrators need to review alert evaluation events across all organizations.
:::
:::note[Environment variable]
`ZO_USAGE_REPORT_TO_OWN_ORG`: Controls where alert evaluation events are stored. When it is enabled, OpenObserve writes each evaluation event to the organization’s own `triggers` stream and also keeps a copy in the `_meta` organization. This allows users to view their alert history within their own organization without requiring access to `_meta`, while still supporting organization level debugging from the `_meta` organization.
:::
## How to interpret the Alert History table
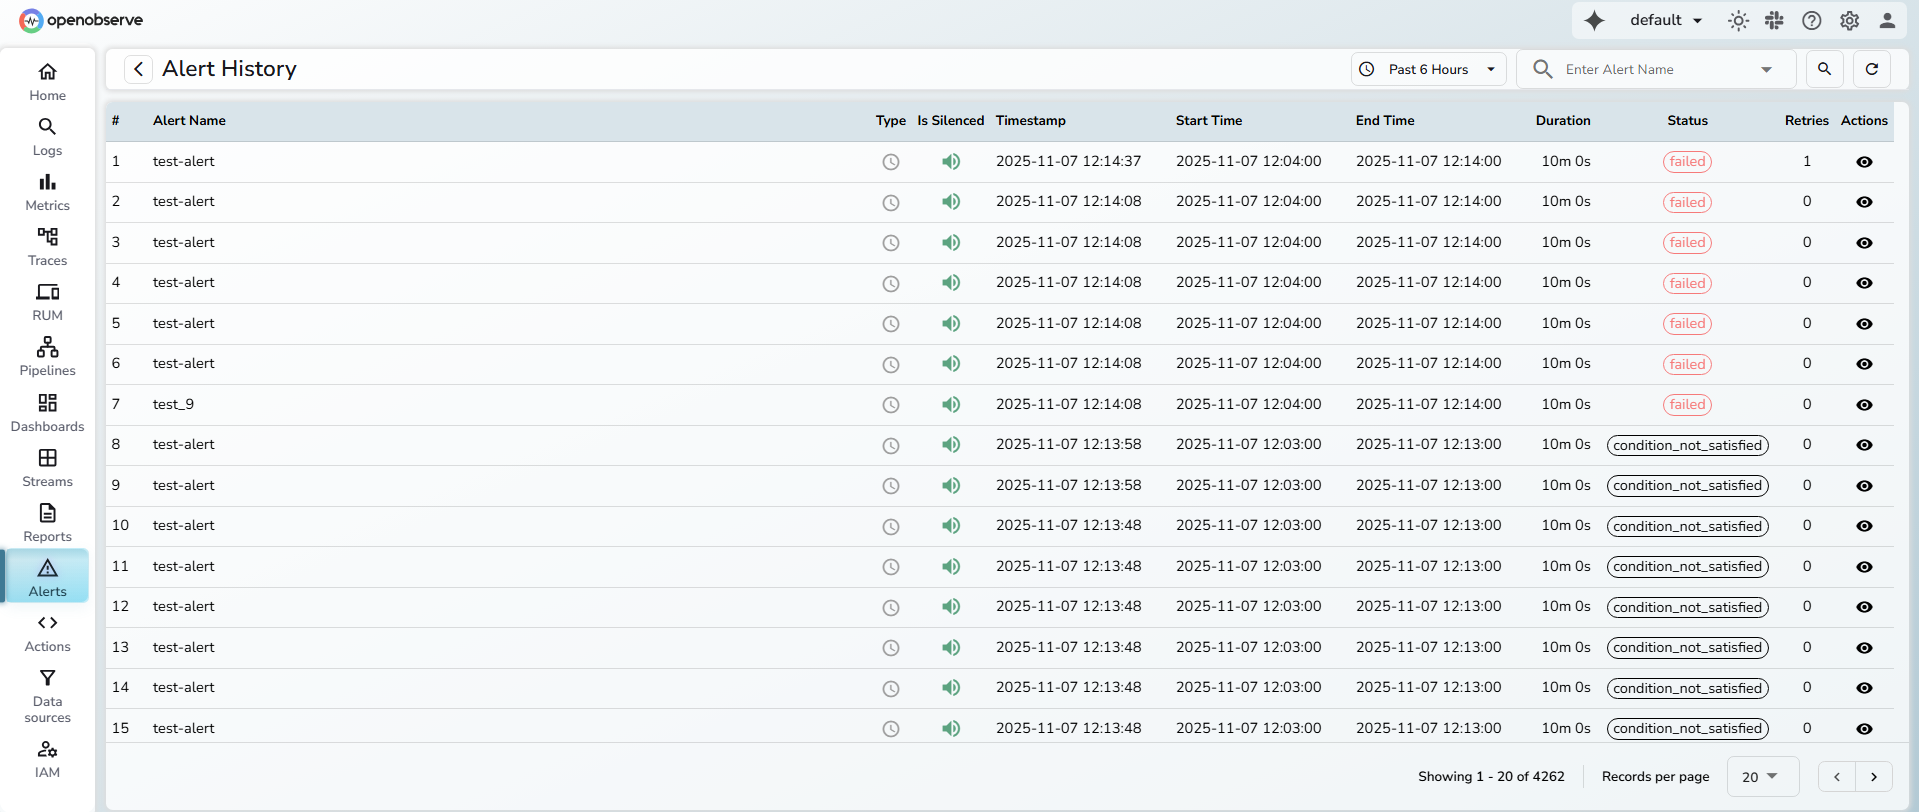
Each row represents one alert evaluation.
- **Alert Name**: The name of the configured alert.
- **Type**: Indicates whether the alert is Scheduled or Real-time.
- **Is Silenced**: Shows whether the alert was silenced during evaluation.
- **Timestamp**: Time when the scheduler picked up the alert for evaluation.
- **Start Time** and **End Time**: The time range of data evaluated.
- **Duration**: How long the alert condition remained true.
- **Status**: The result of the alert evaluation.
- **Retries**: Number of times the system retried alert delivery when the destination did not acknowledge it. The system retries up to three times.
**Note**: The environment variable `ZO_SCHEDULER_MAX_RETRIES` defines how many times the scheduler retries a failed execution.
- **Total Evaluations**: Shows how many times the alert rule has been evaluated over the selected time range. Each evaluation corresponds to one run of the alert’s query and condition.
- **Firing Count**: Shows how many of those evaluations resulted in a firing event, that is, how many times the alert condition was satisfied and the alert was triggered.
- **Actions**: Opens a detailed view that includes:
- **Evaluation Time**: The time taken to complete the alert’s search query.
- **Silenced**: Indicates whether the alert was silenced.
- **Source Node**: The node that processed the alert. Useful for debugging distributed environments.
- **Error**: The error message captured when the evaluation or delivery failed. Shown for records with a `failed` status.
- **Status codes**:
- **completed**: The alert condition was met, and the notification was sent to its destination.
- **failed**: The alert evaluation or delivery failed. The trigger record in `_meta` includes the error field with details.
- **condition_not_met**: The configured alert condition was not satisfied for that time range.
- **skipped**: The scheduled evaluation window was missed due to a delay, and the system evaluated the next aligned window.
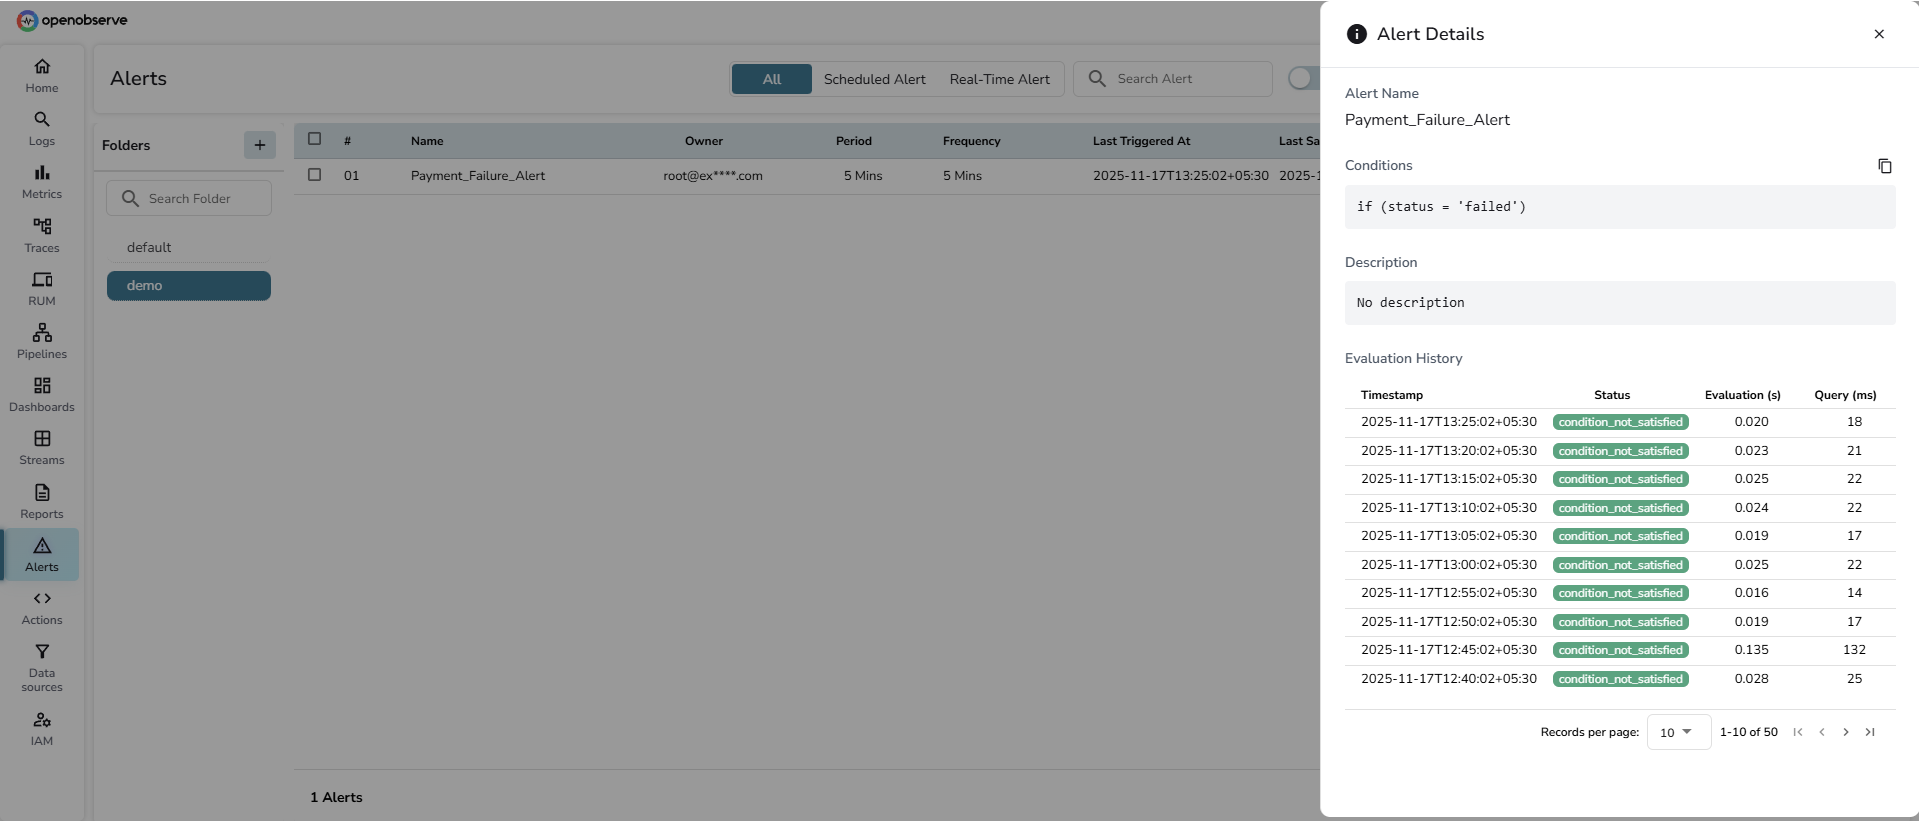
- **Alert Details** drawer: Opens when the user clicks an alert in the Alerts list. The drawer displays the alert condition, description, and evaluation history. It includes a date-time picker (relative or absolute, defaulting to the last 15 minutes) to filter the evaluation history, replacing the previous fixed window and manual refresh.
:::note[Note]
The selected time range is limited by the `max_query_range` setting on the organization's `triggers` stream; ranges larger than this are automatically shortened to the most recent allowed window.
:::
## How to debug a failed alert
This process applies only to users who have access to the `_meta` organization.
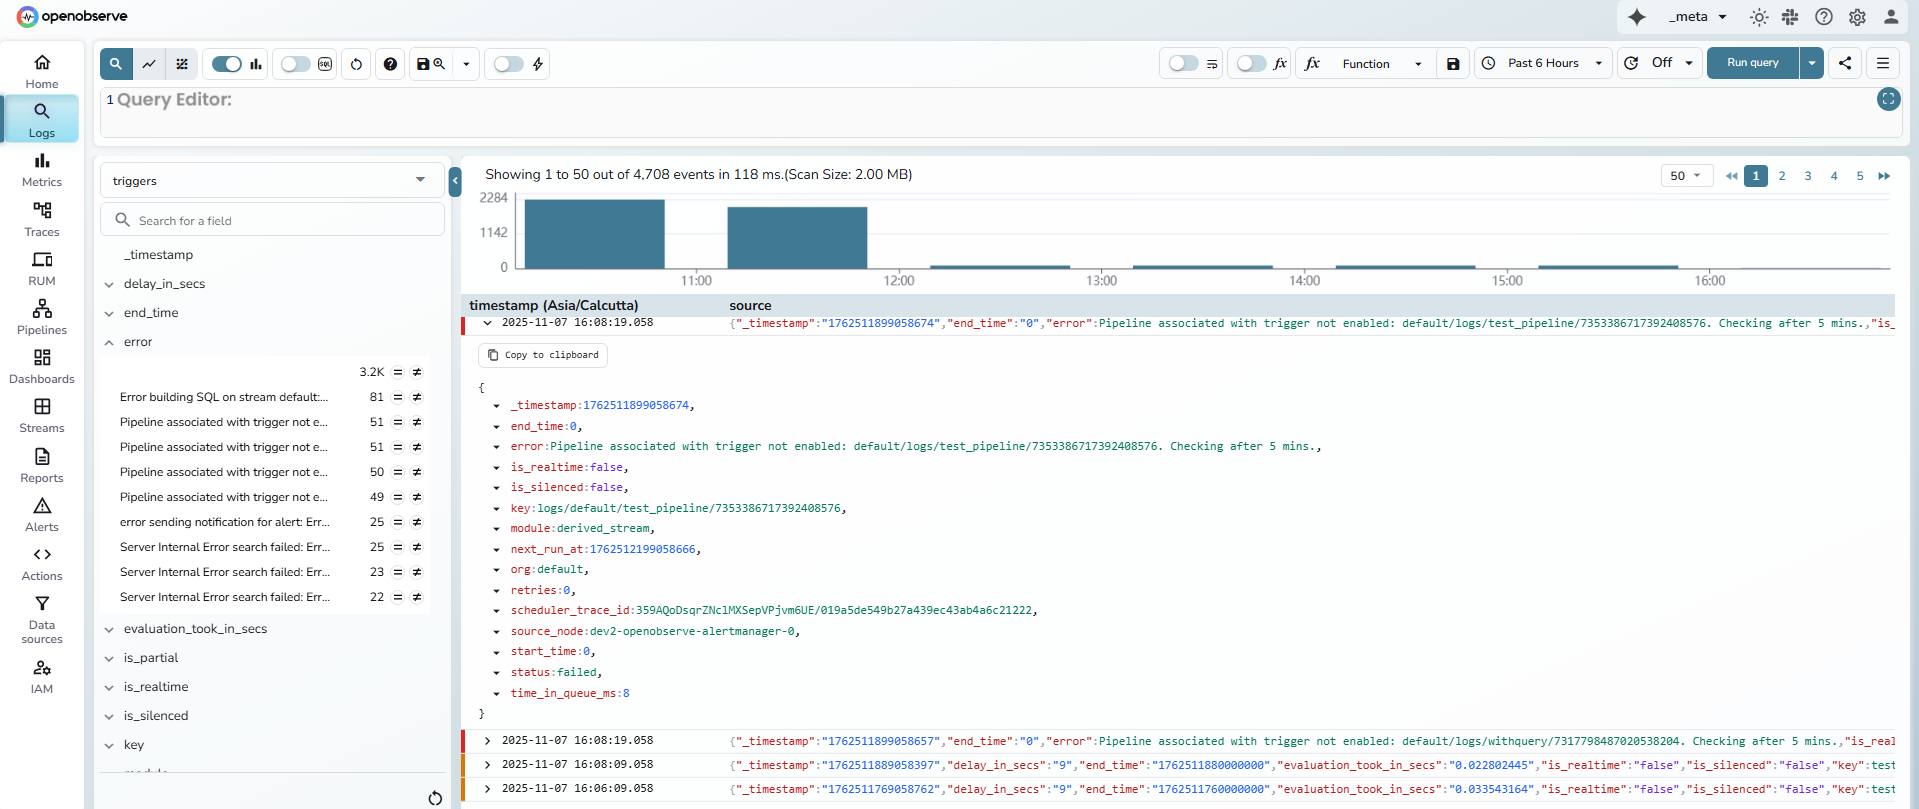
1. From the organization selector, switch to `_meta`.
2. Go to **Logs**.
3. From the stream dropdown, select `triggers`.
4. Set the required time range and select Run query.
5. Locate the error log for the failed alert.
6. Identify the `scheduler_trace_id` field.
**Example:**
`scheduler_trace_id: 358zJCLiWVdApBSBXM50YYnIwgA/019a5d91932174c3bab84fff2785f73f`
The trace ID is the part after the slash: `019a5d91932174c3bab84fff2785f73f`
7. Copy this trace ID.
8. Switch back to your organization.
9. Go to **Logs**.
10. In the SQL editor, search using the trace ID.
For example,
`match_all('019a5d91932174c3bab84fff2785f73f')`
This displays all logs related to that alert evaluation.
11. Review the logs to identify the failure cause, such as query issues, destination errors, timeouts, or node resource problems.
12. Use the **Source Node** field from the **Alert History** details to locate the node that processed the alert and check its introspection logs if needed.
## Why you might see a skipped status
A **skipped** status appears when a scheduled alert runs later than its expected window.
For example, an alert configured with a 5-minute period and 5-minute frequency is scheduled to run at 12:00 PM.
It should normally evaluate data from 11:55 to 12:00.
If the scheduler experiences a delay and runs the job at 12:05 PM, it evaluates the current aligned window (12:00 to 12:05) instead of the earlier one.
The earlier window (11:55 to 12:00) is marked as skipped to indicate that evaluation for that range did not occur because of delay in job pickup or data availability.