---
title: Comparison Against in Dashboards
description: Visually compare current vs. past data in OpenObserve dashboards using the Comparison Against feature for trend analysis across supported chart types.
---
The **Comparison Against** feature in OpenObserve **Dashboards** allows you to visually compare your **current data** with **data from a selected point in time in the past**.
It is useful for trend analysis and identifying patterns over time.
## Where to Find This Feature
The **Comparison Against** feature is available for the following chart types in **Dashboards**:
- Area
- Area Stacked
- Bar
- Horizontal Bar
- Line
- Scatter
- Stacked
- Horizontal Stacked
## How it Works
| Step | Without Comparison Against | With Comparison Against |
|------|------------------------|---------------------|
| **SQL Query** | You write SQL query for the current time frame (default). | Same SQL query is used for both current and past time frames. |
| **Period (Time Range)** | You select a time range (e.g., last 30 mins). | Same time range is applied to both current and past queries. |
| **Query Execution** | Query runs at the current time for the selected time range. | If you select one time frame in the past, the same query runs twice:
• Query 1: Runs at the current time for the selected time range.
• Query 2: Runs at the past time for the selected time range. |
| **Query Results** | Single result: current data only. | Two result sets:
• Query 1: Current data
• Query 2: Past data |
| **Visualization** | Chart shows current data only. | Chart shows both current and past data side by side for comparison. |
## How to Use the Compare Against Feature
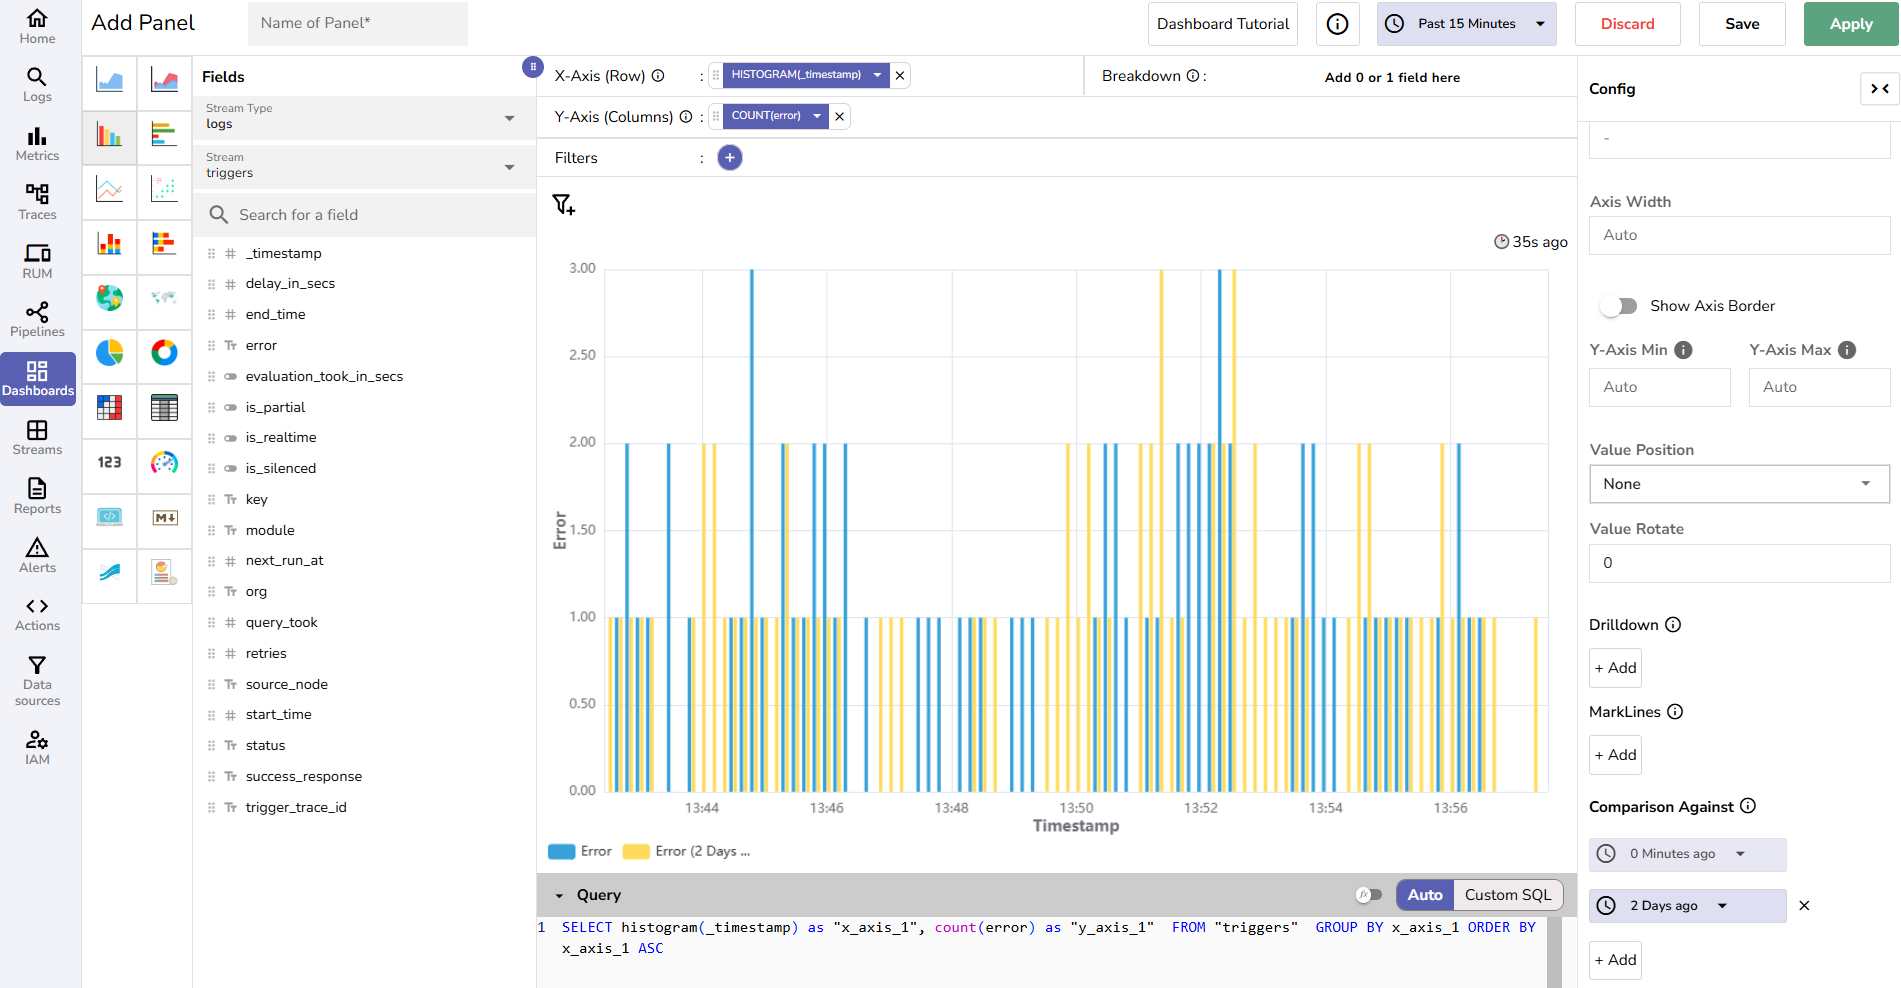
For example, you want to compare **the error trends for the last 15 mins today** with **the error trends for the same time period, 2 days ago**.
Let's say,
- You want to view the error trend for the past 15 mins today (for example, from 3:45 PM - 4:00 PM, today).
- Now, you want to compare the error trend for the same time period (from 3:45 PM - 4:00 PM), 2 days ago.
The following steps explain how to use the **Comparison Against** feature for this scenario:
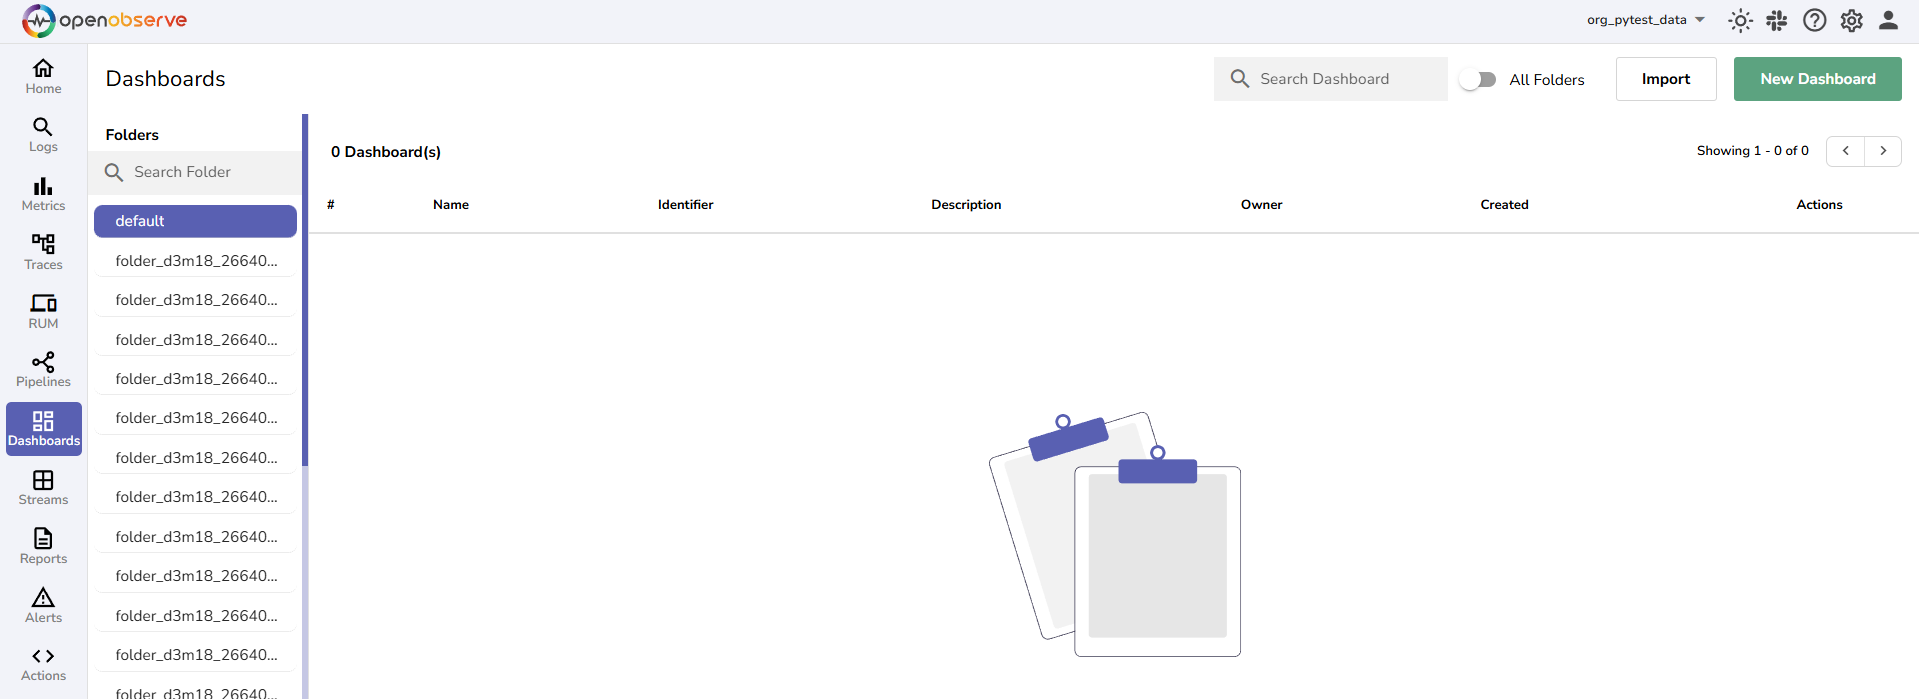
1. Go to **Dashboards** > **New Dashboard**.
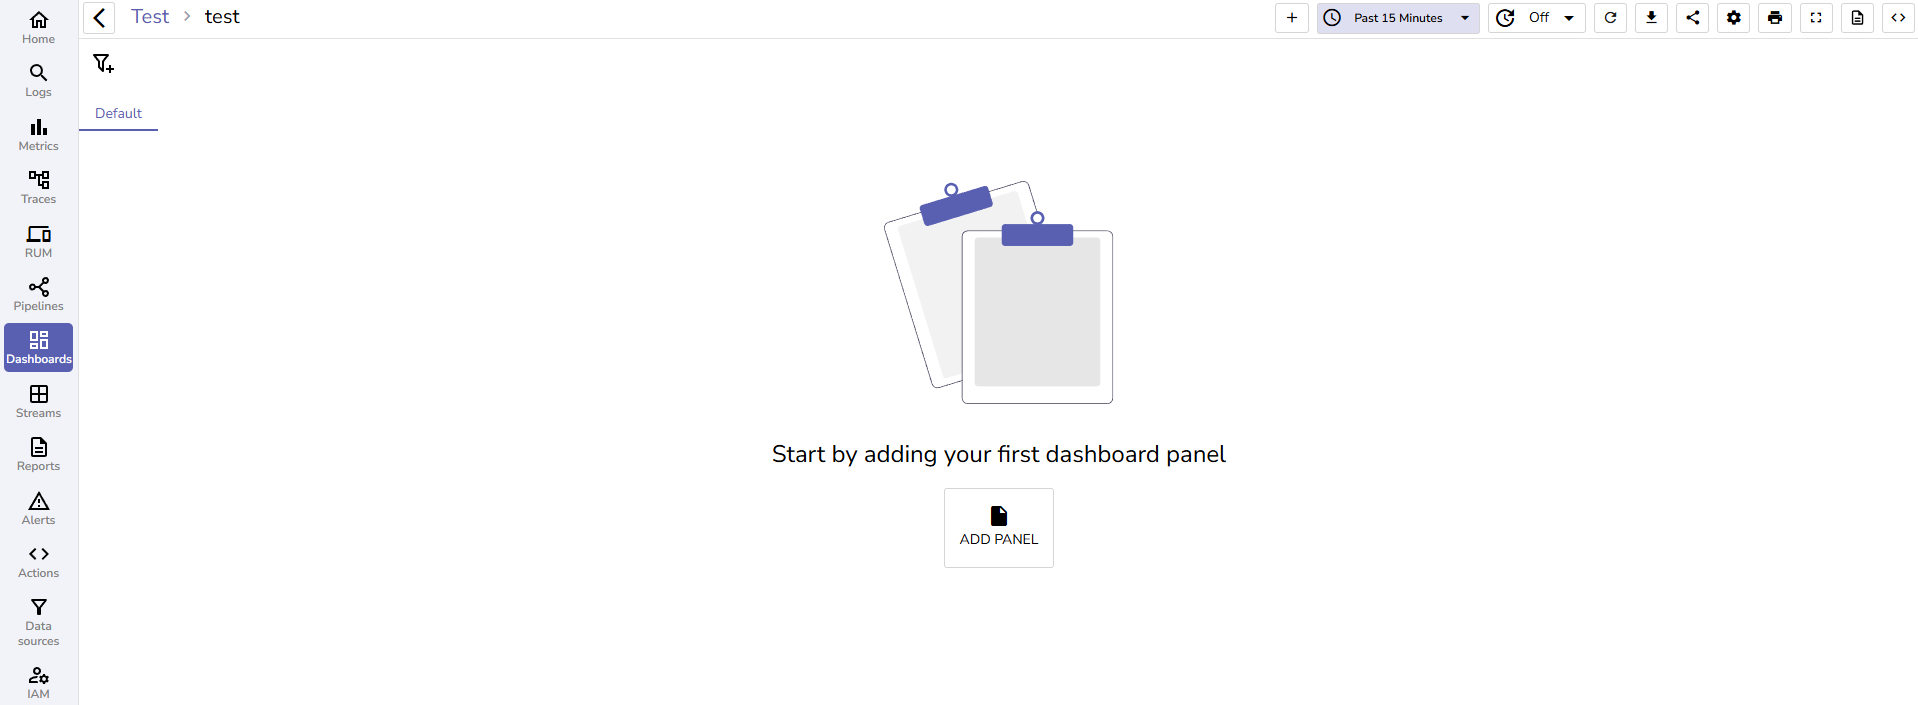
2. Click **Add Panel.**
3. Select a chart [where the **Comparison Against** feature is available](#where-to-find-this-feature).
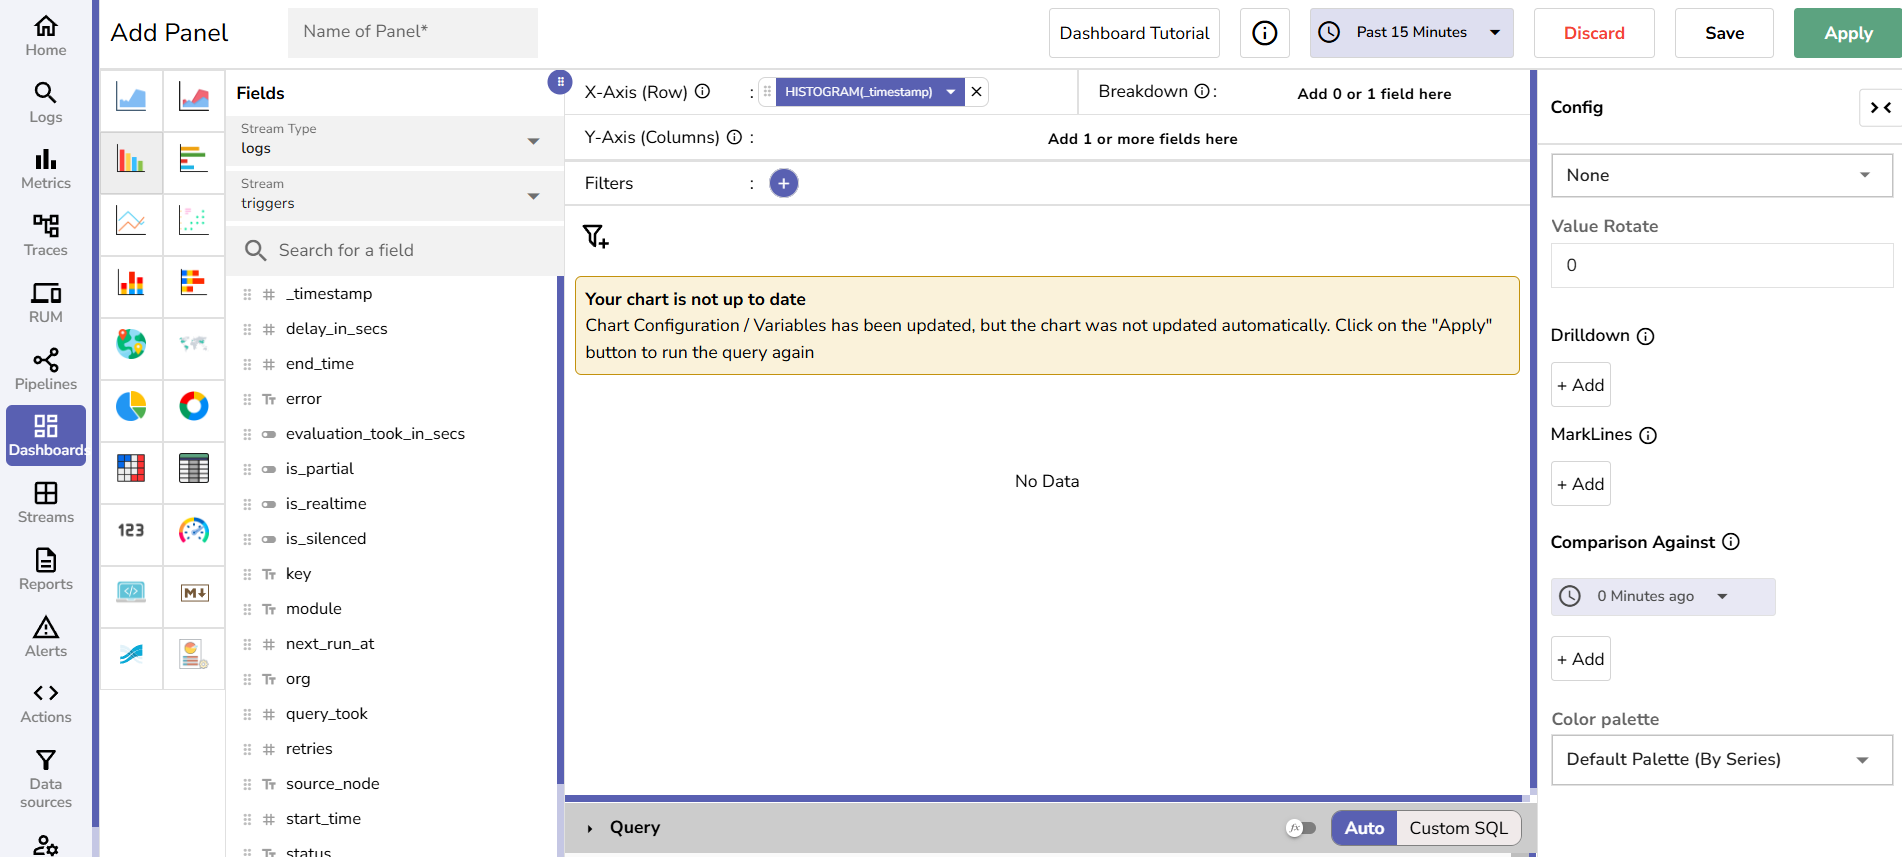
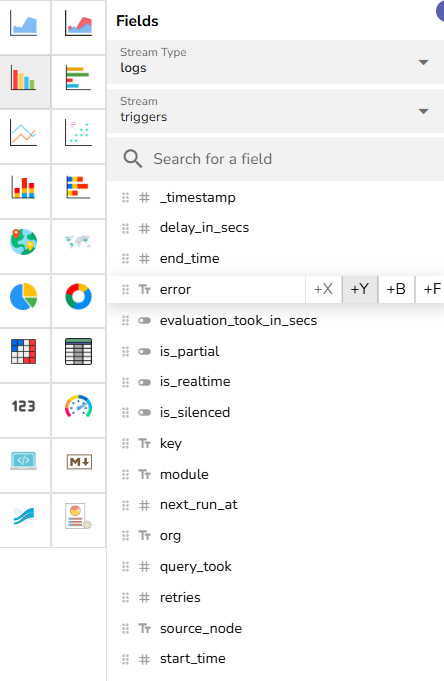
4. Under **Fields**, add **Stream Type** and **Stream**. These define the data source for your SQL query. Select fields that you want to set as x-axis (for example, timestamp) and y-axis (for example, error) of the chart.
**Note**: You may use the Query editor to further customize your query.

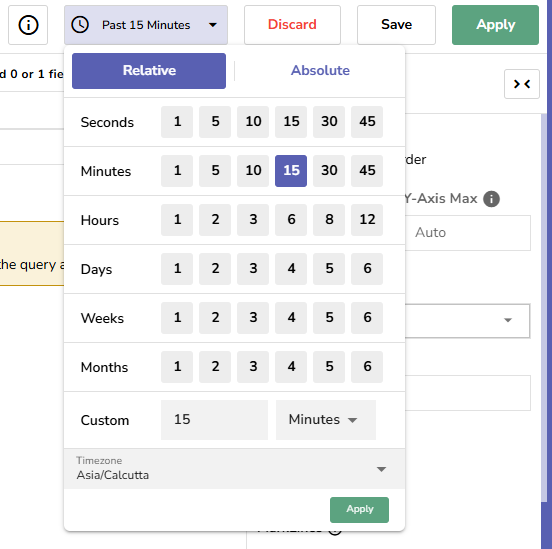
5. Choose a time range. For instance, **Past 15 Minutes**. This becomes the period, the time range the system will use for both your current data and comparison data.
6. Open the **Config** menu and scroll to **Comparison Against**.
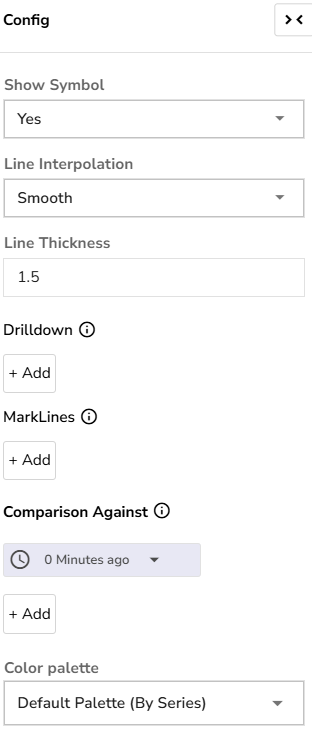
7. By default, **0 Minutes ago** is selected. This represents your current time.
8. Click **+ Add** to choose one or more past times to compare against the current time. For example, **2 days ago**. Use the dropdown menu to select the desired time. The system runs your SQL query for the same time range (period) at this past point.
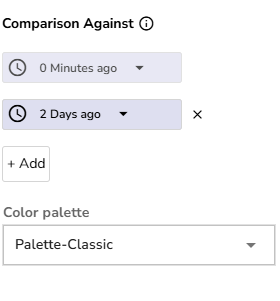
9. (Optional) Select a **Color Palette** to differentiate charts.
10. Click **Apply** to run the query and update the chart.
**Note**: You must click **Apply** after adding or changing any comparison values.
**Result:**
The results of both queries are shown side by side on your chart, making it easy to visually compare your current data with historical data.