---
title: Trellis Layout
metaTitle: Trellis Layout in Dashboards
description: "Use Trellis Layout under the Config tab to split a chart into multiple panels by a breakdown field, making grouped values easy to compare."
---
This guide explains how to use the **Trellis Layout** option under the **Config** tab to split a single chart into multiple consistently formatted panels based on a selected breakdown field.
## What is Trellis Layout?
**Trellis Layout** creates a separate chart panel for each unique value in a selected breakdown field. All panels use the same X-axis and Y-axis scales, making it easier to visually compare metric trends across different values.
For example, if the breakdown field is `k8s_app_instance`, **Trellis Layout** generates one panel for each application instance.
---
## Supported Chart Types
Trellis Layout supports:
- Area
- Bar
- Horizontal bar
- Line
- Scatter
---
## Apply Trellis Layout to a Panel
Follow these steps:
1. Open or [create a panel](https://openobserve.ai/docs/user-guide/analytics/dashboards/dashboards-in-openobserve/#panels).
2. Click **Add Panel** to create a new panel and choose a supported chart type.
Alternatively, select **Edit Panel** from the dropdown menu on an existing panel.
3. Under **Fields**, choose a stream type and a stream name.
4. By default, the system set the X-axis as `histogram(_timestamp)`. Modify if needed.
5. Under **Fields**, select Y-axis and **Breakdown**.
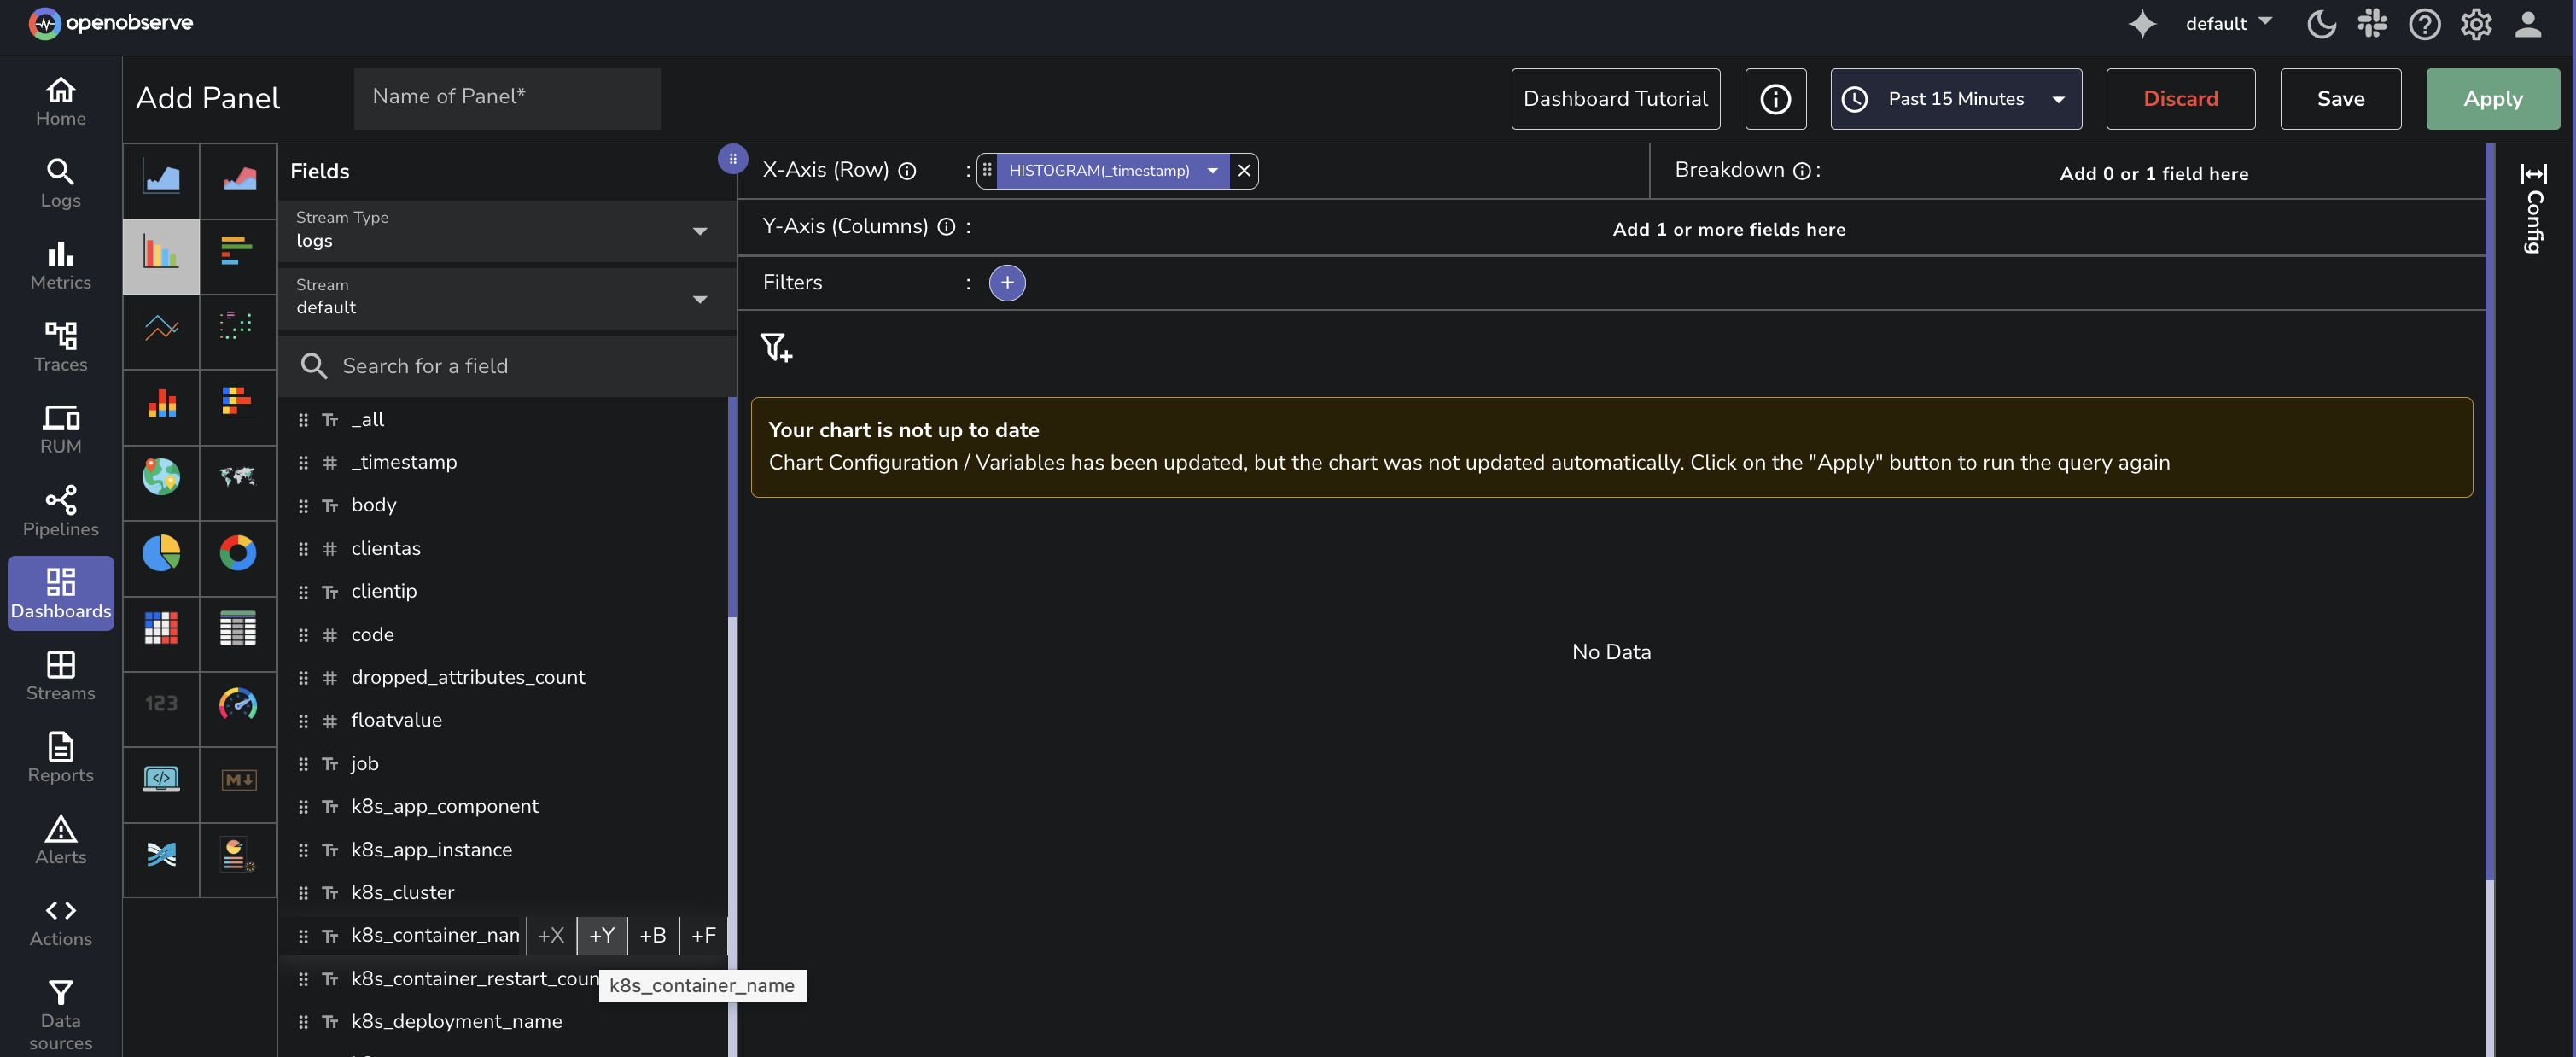
- To select a Y-axis field, hover over a field and click the **+Y** icon.
For example, `k8s_container_name`.
> Note: You can select more than one Y-axis fields.
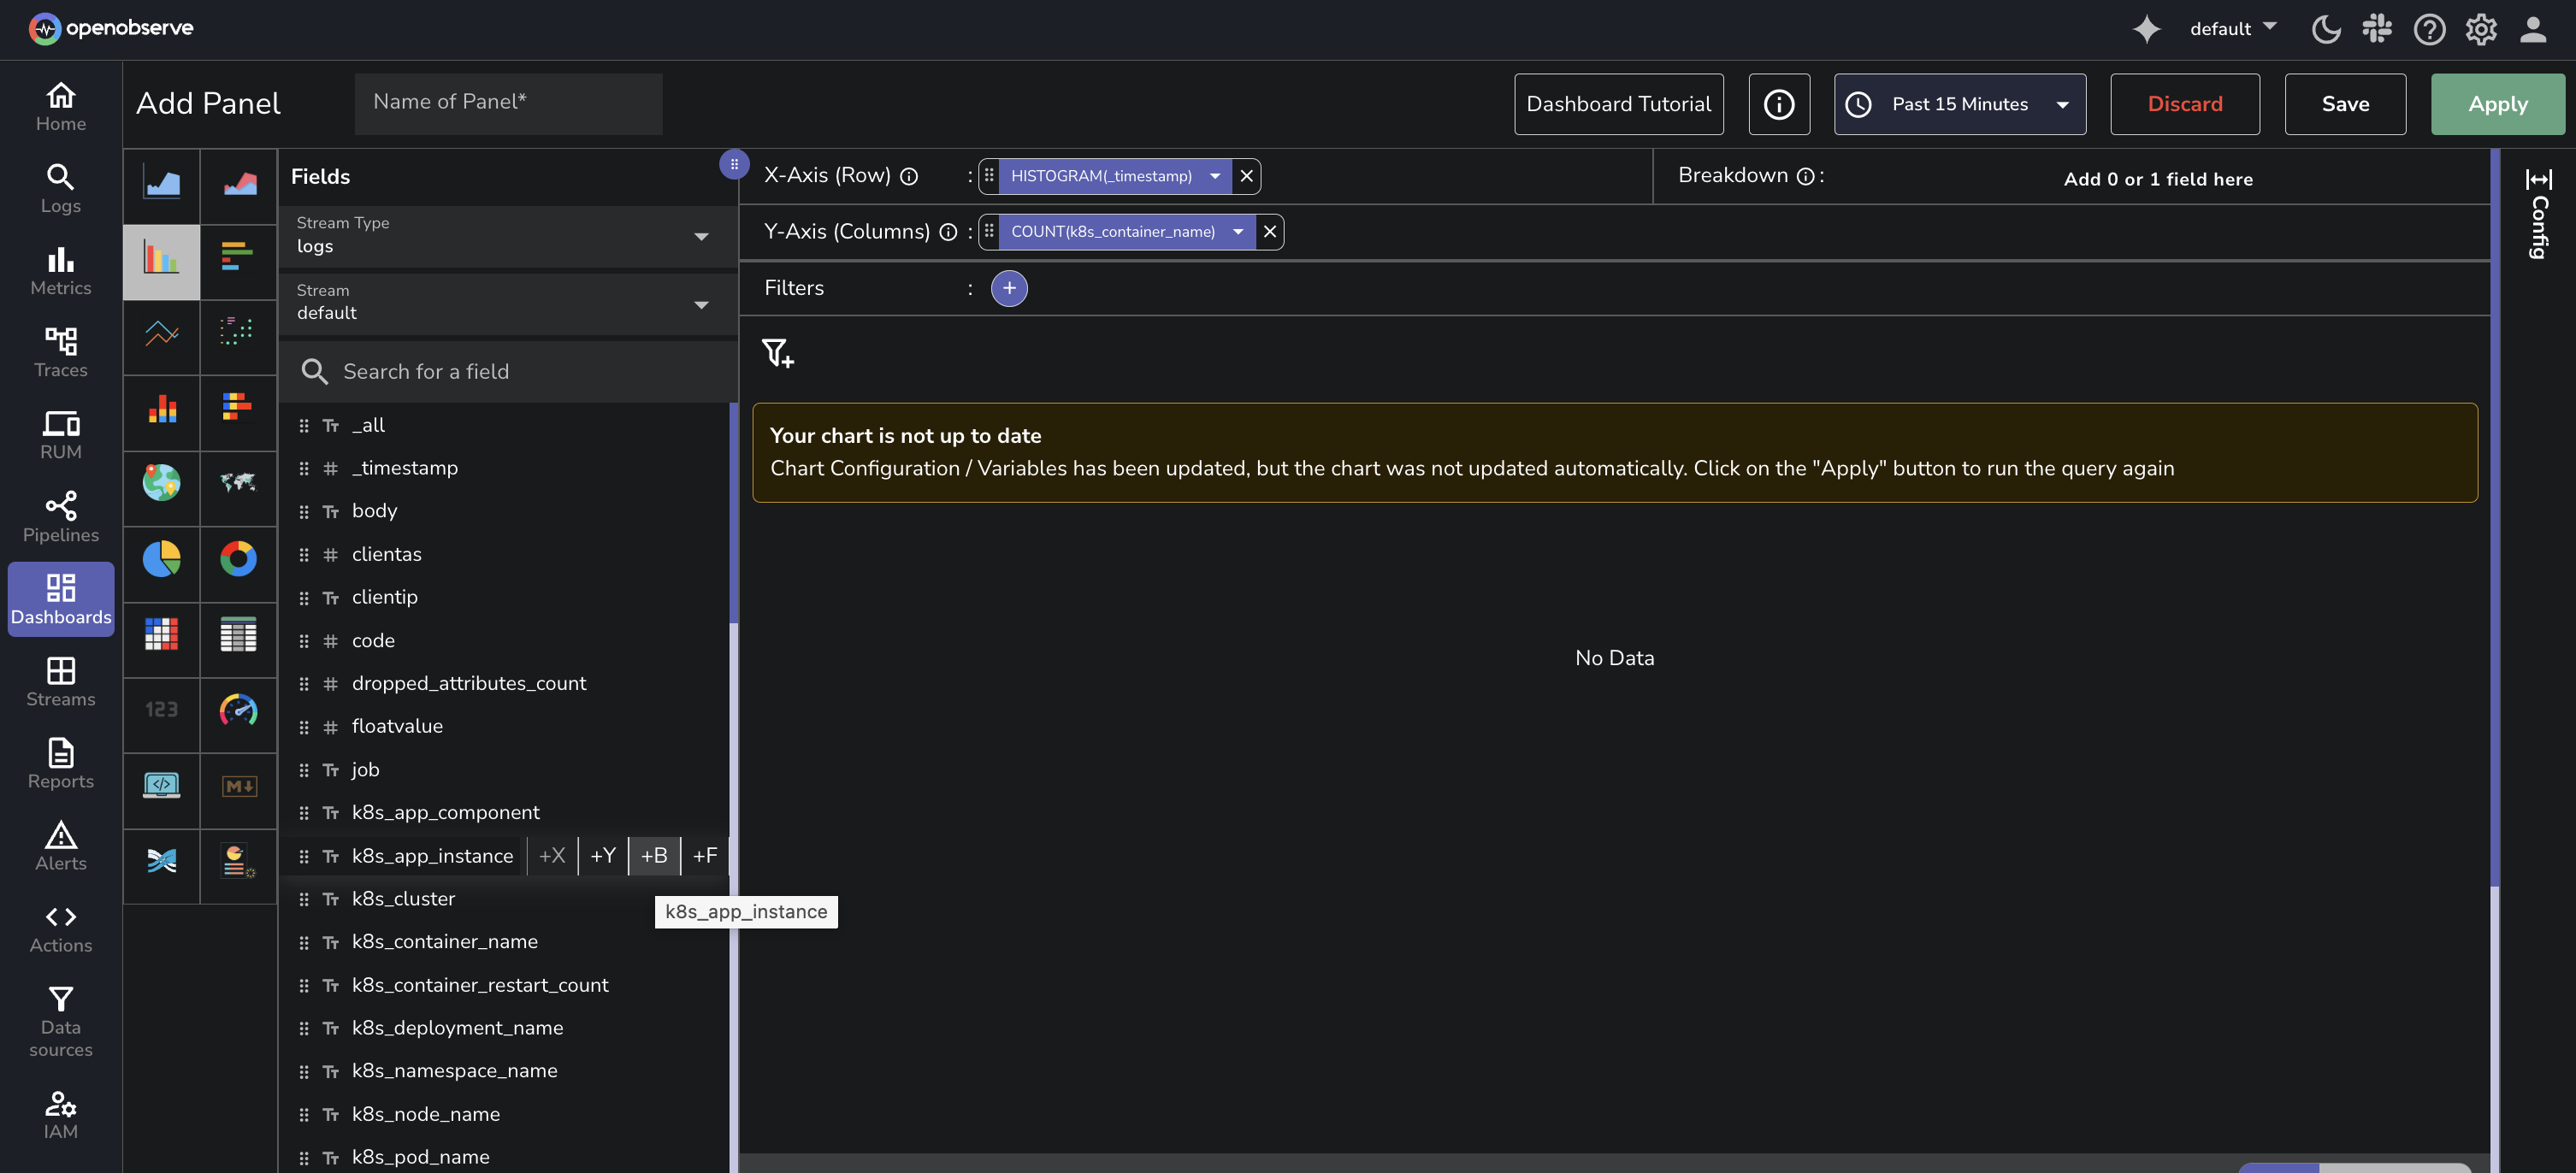
- To select a **Breakdown** field, hover over a field and click the **+B** icon.
Choose a groupable field. For example, `k8s_app_instance`.
This enables the **Trellis Layout** configuration options in the **Config** tab.
6. Click the **Config** tab, to configure **Trellis Layout**.
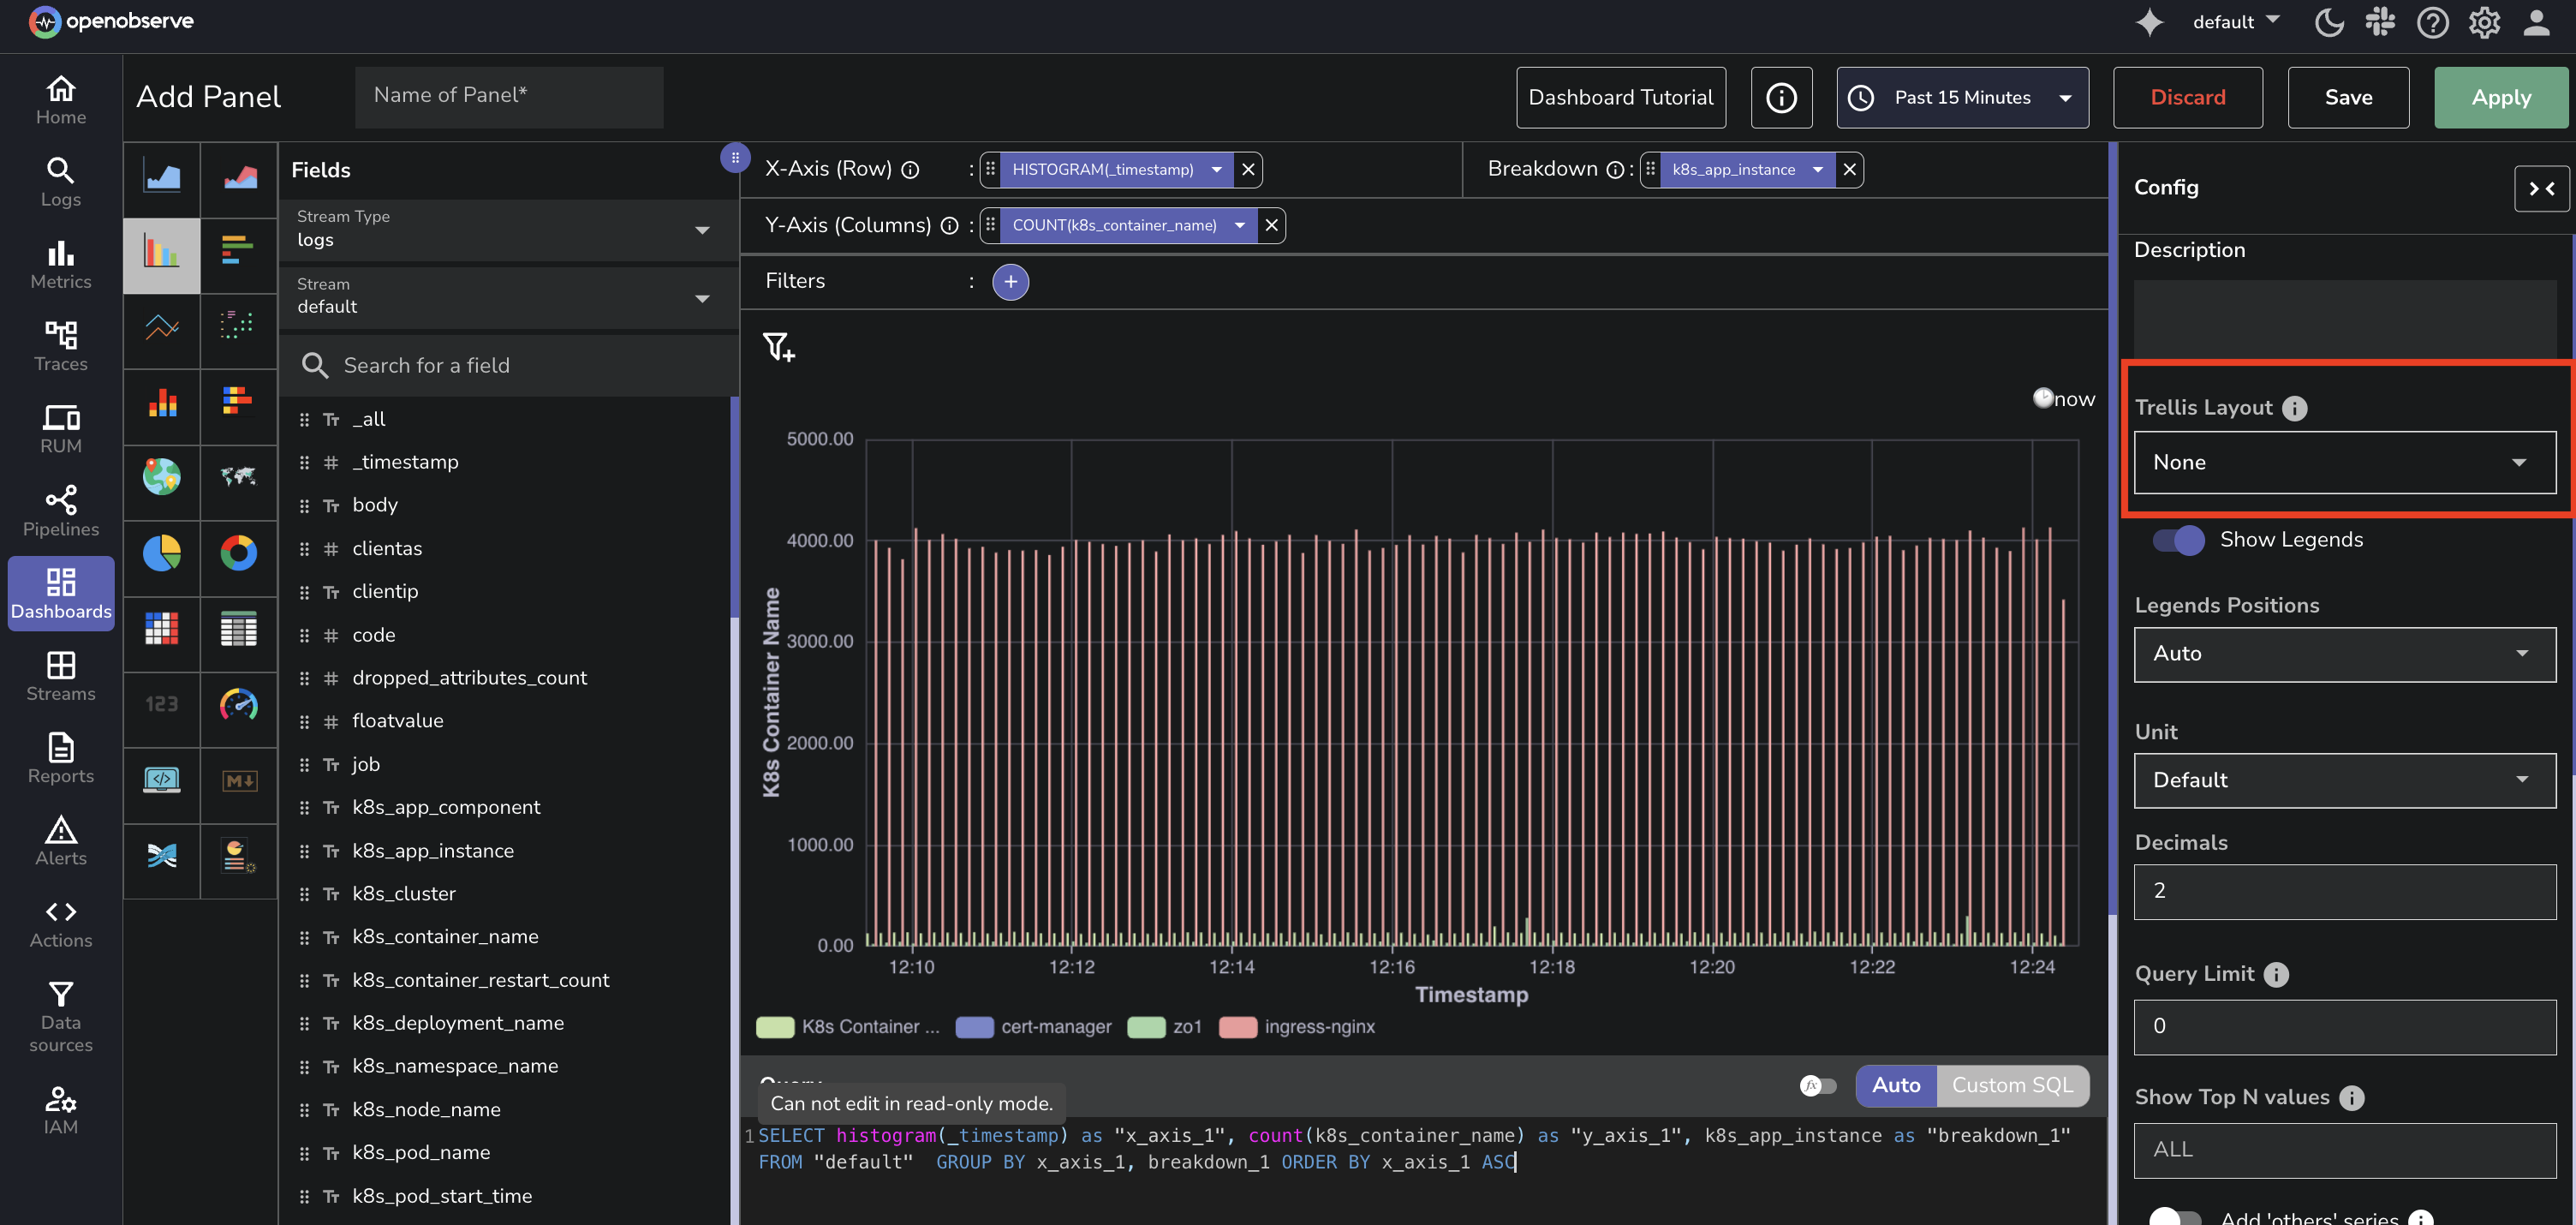
7. Under **Trellis Layout**, choose how panels should be arranged:
- **None**: No panel splitting
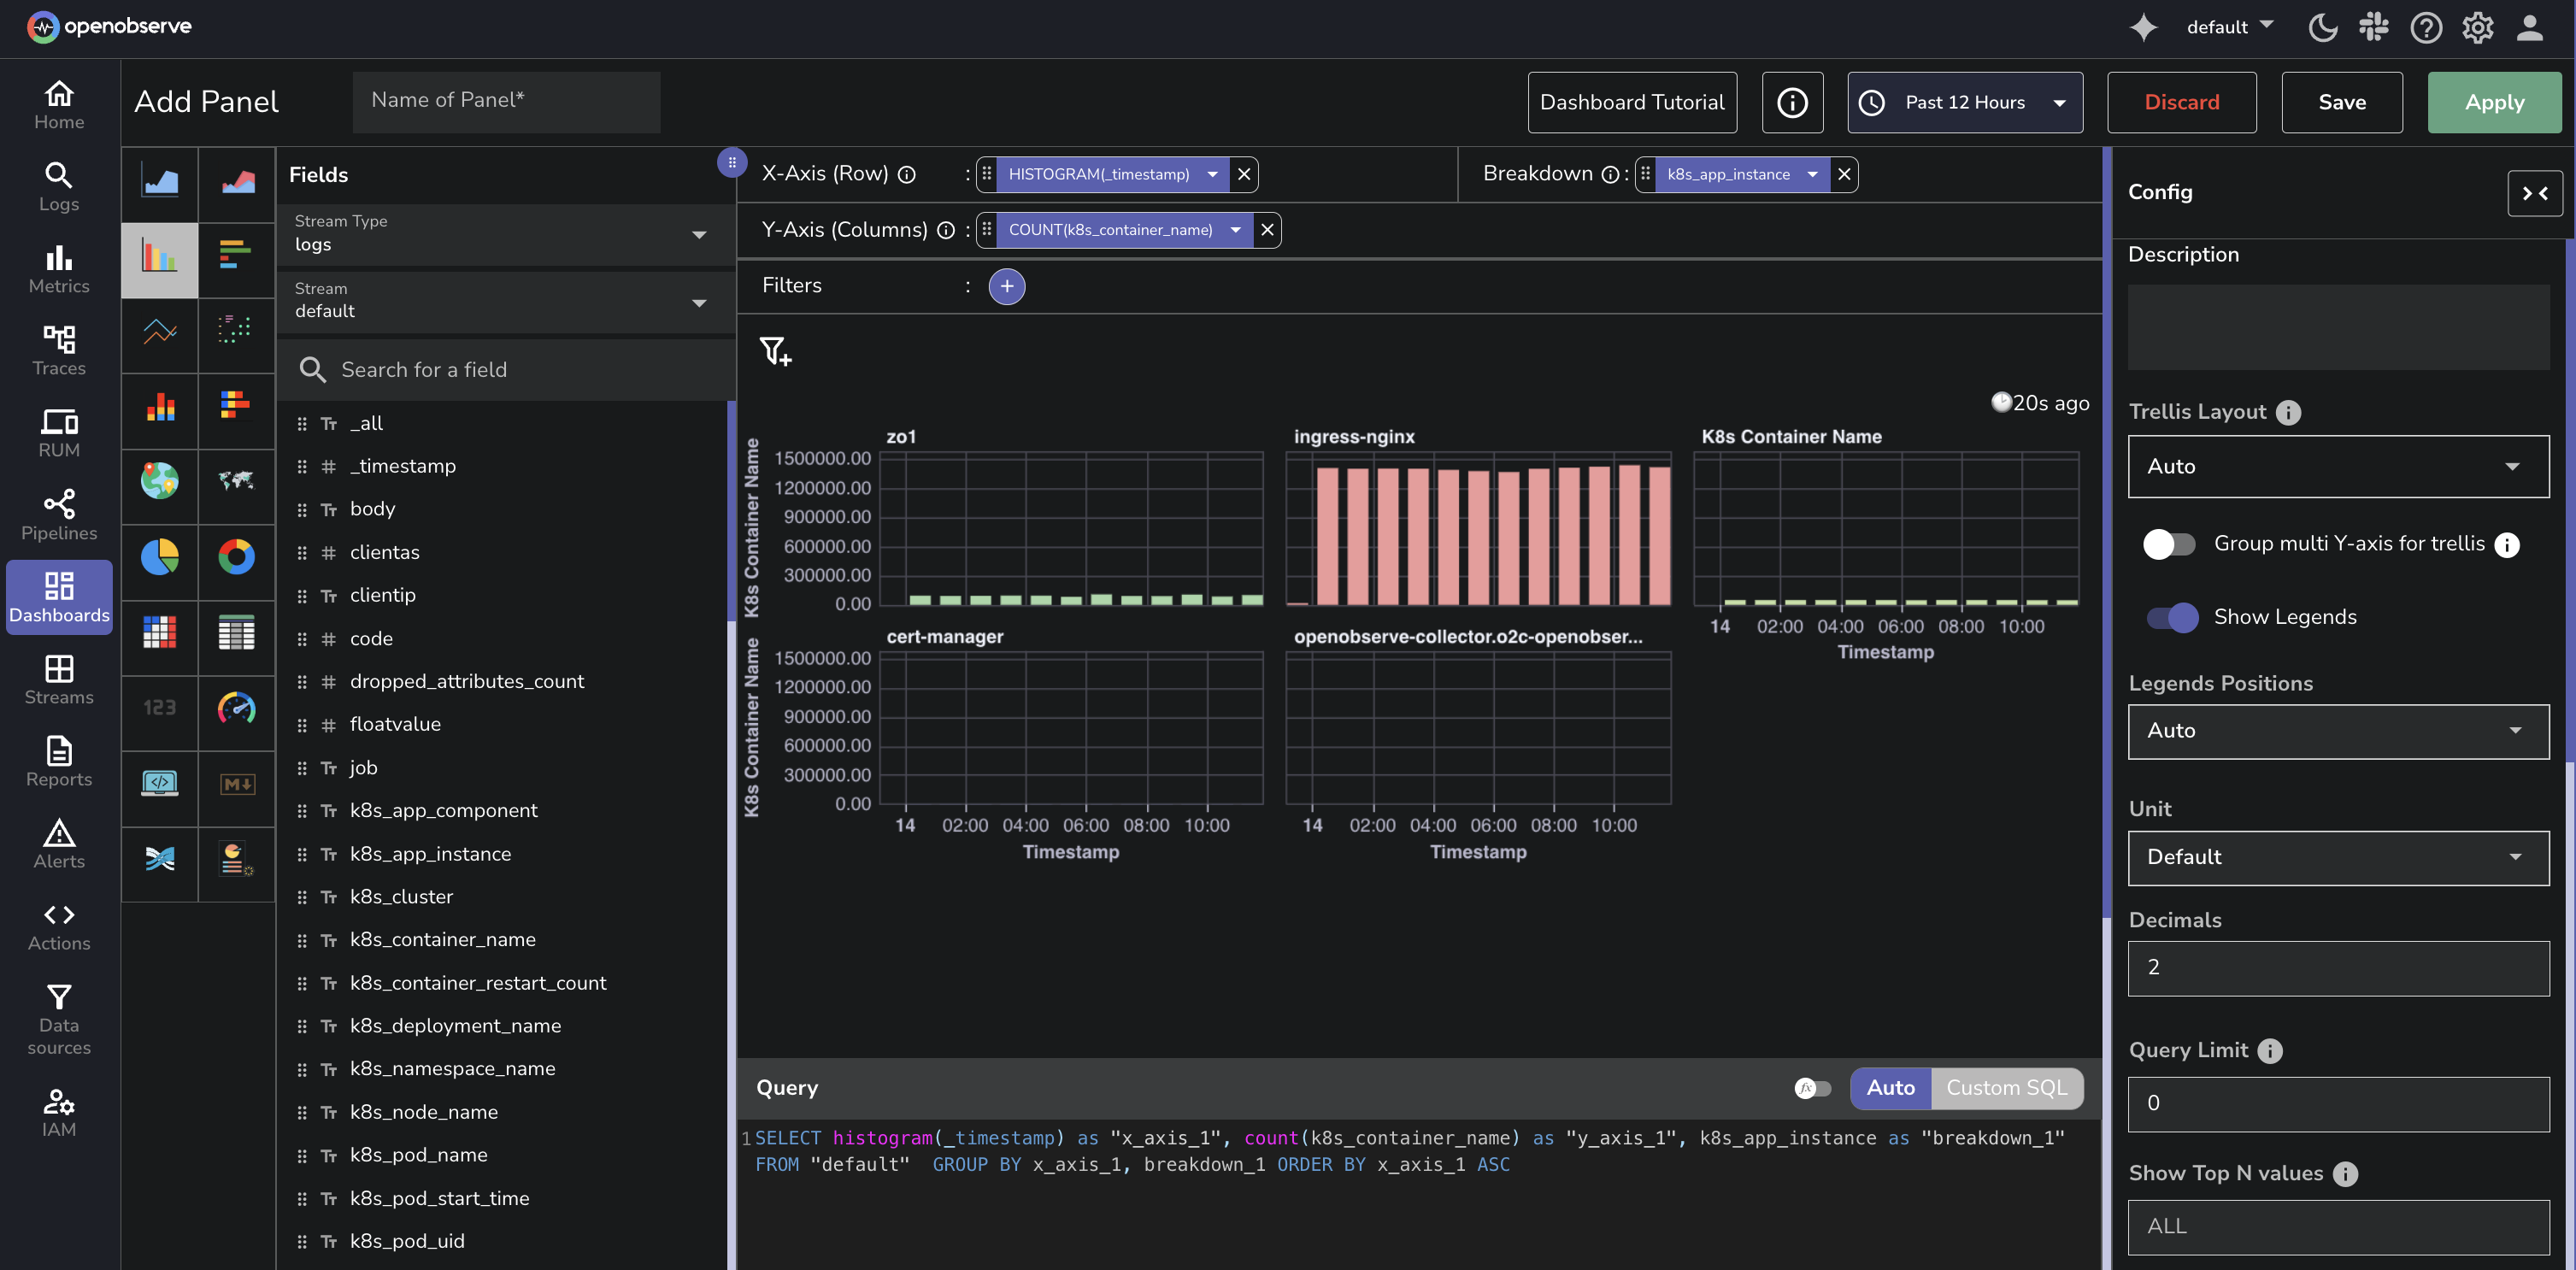
- **Auto**: Automatically arranges the layout
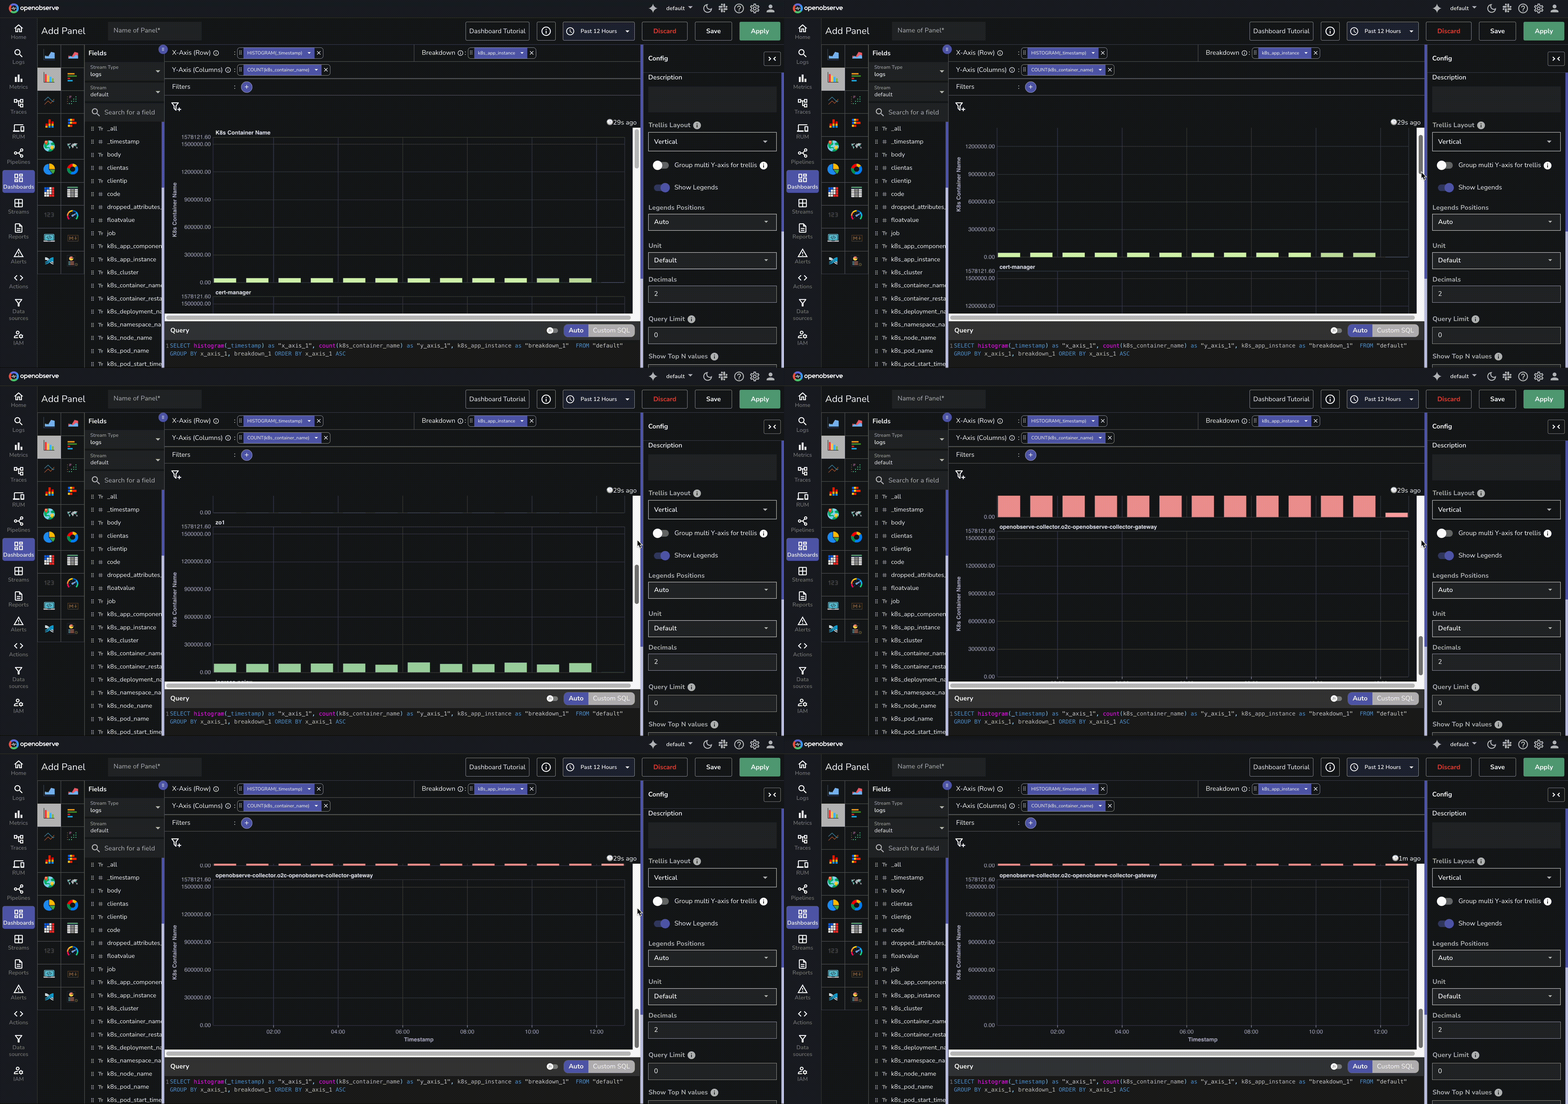
- **Vertical**: Stacks panels vertically
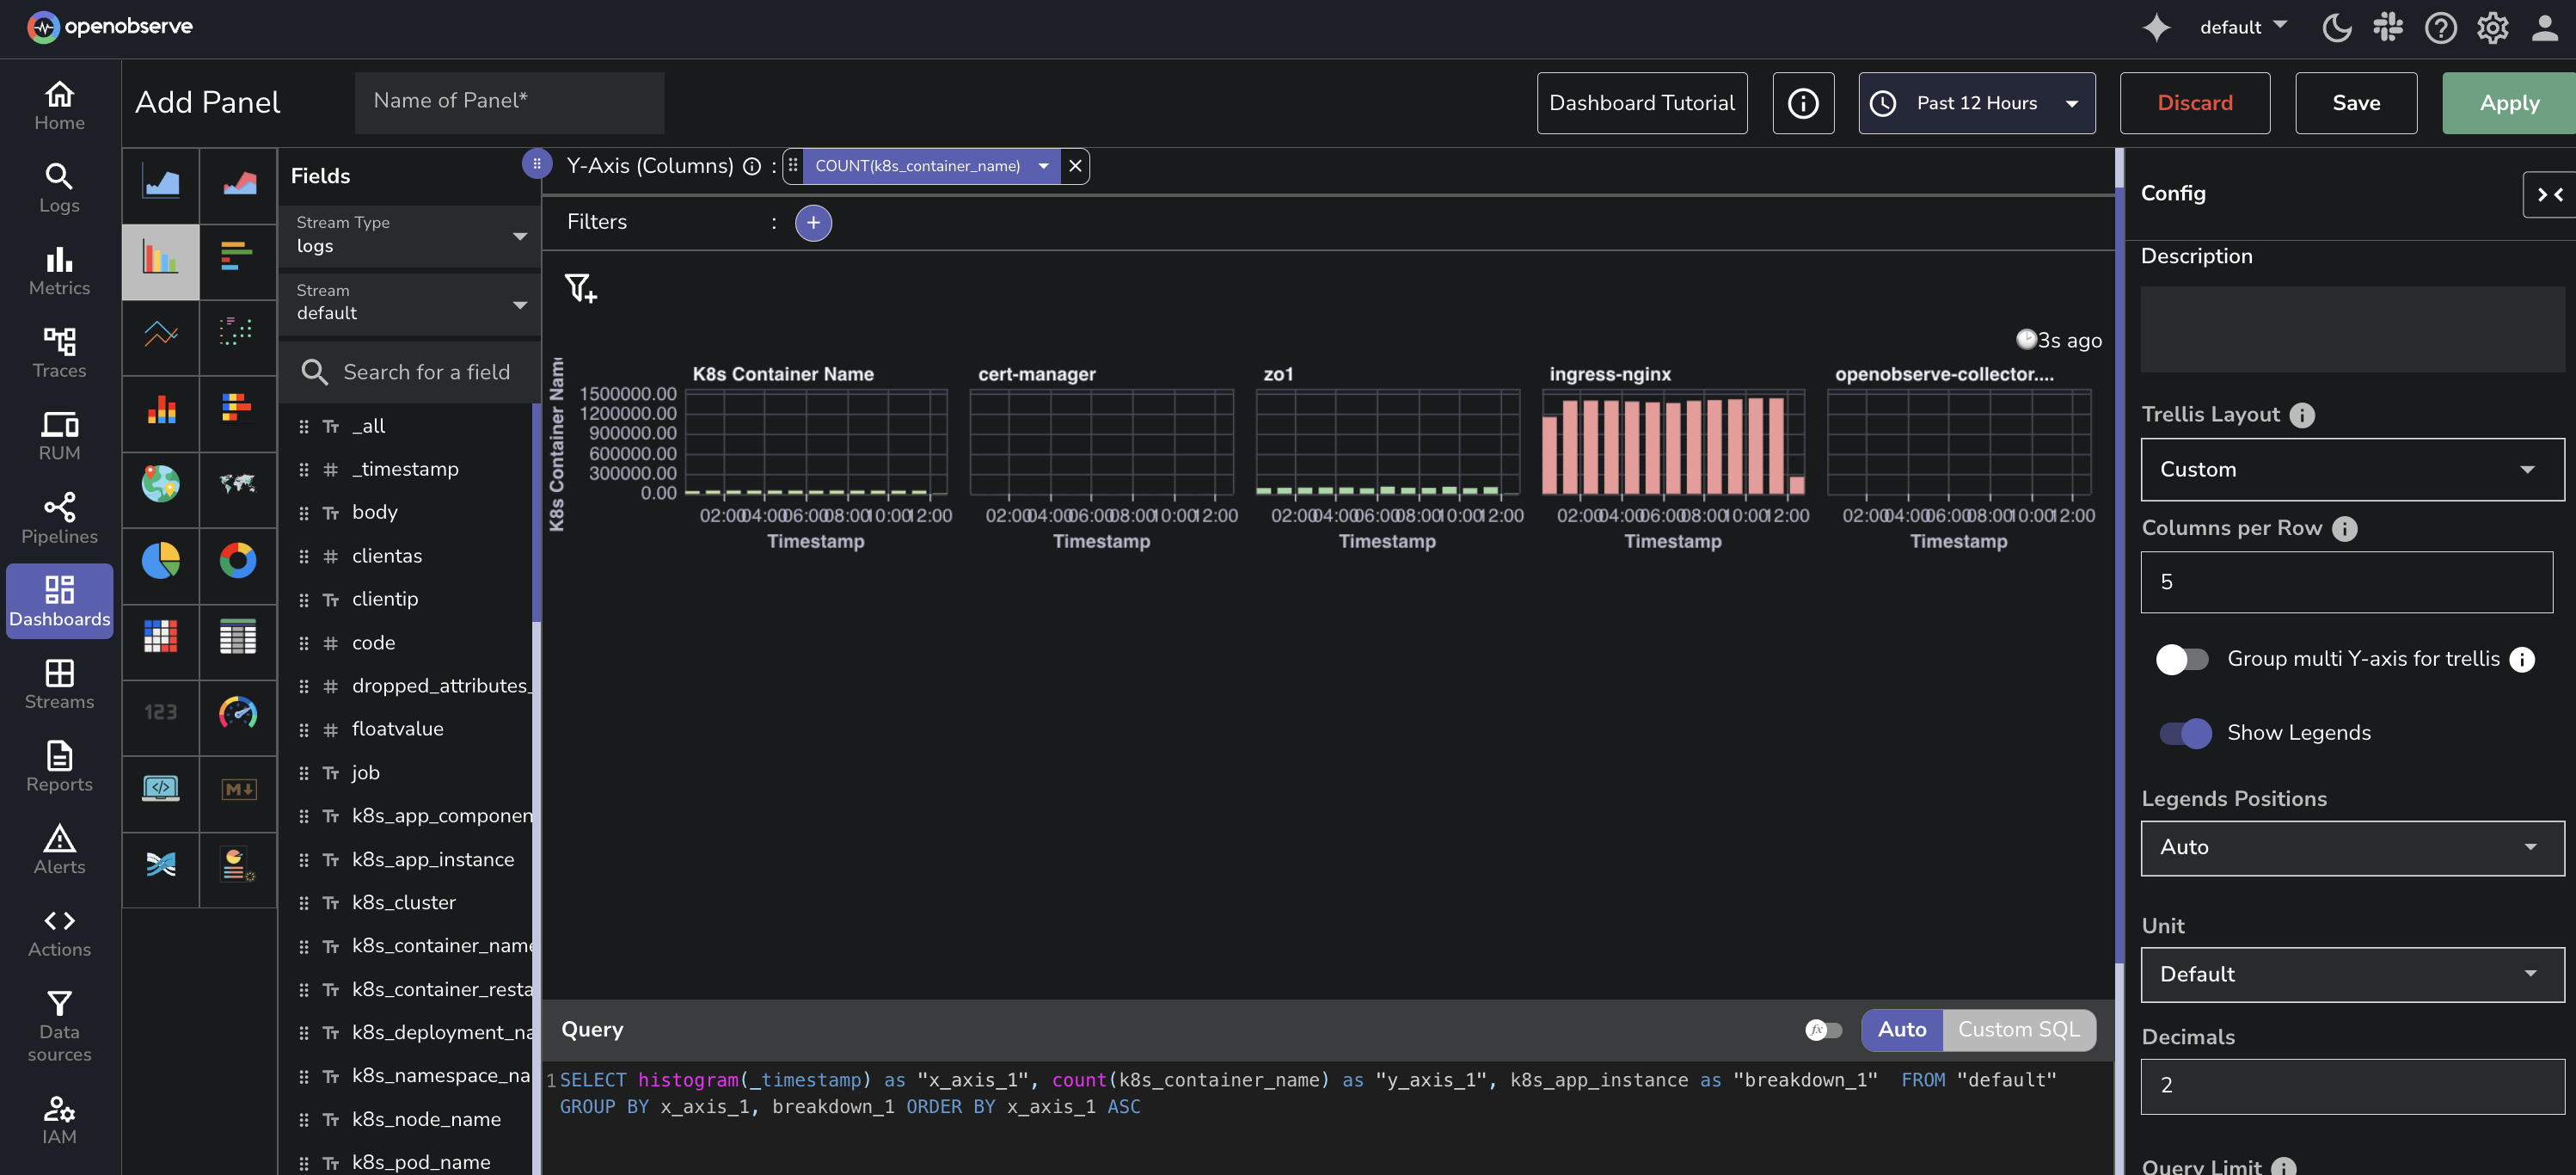
- **Custom**: Allows you to specify the number of panels per row
8. If you choose **Custom**, enter a number in the **Columns Per Row** field to control how many charts appear in each row.
9. Click **Apply** to view the updated layout.
10. Click **Save** to preserve the changes.
## Multiple Y-axis Grouping
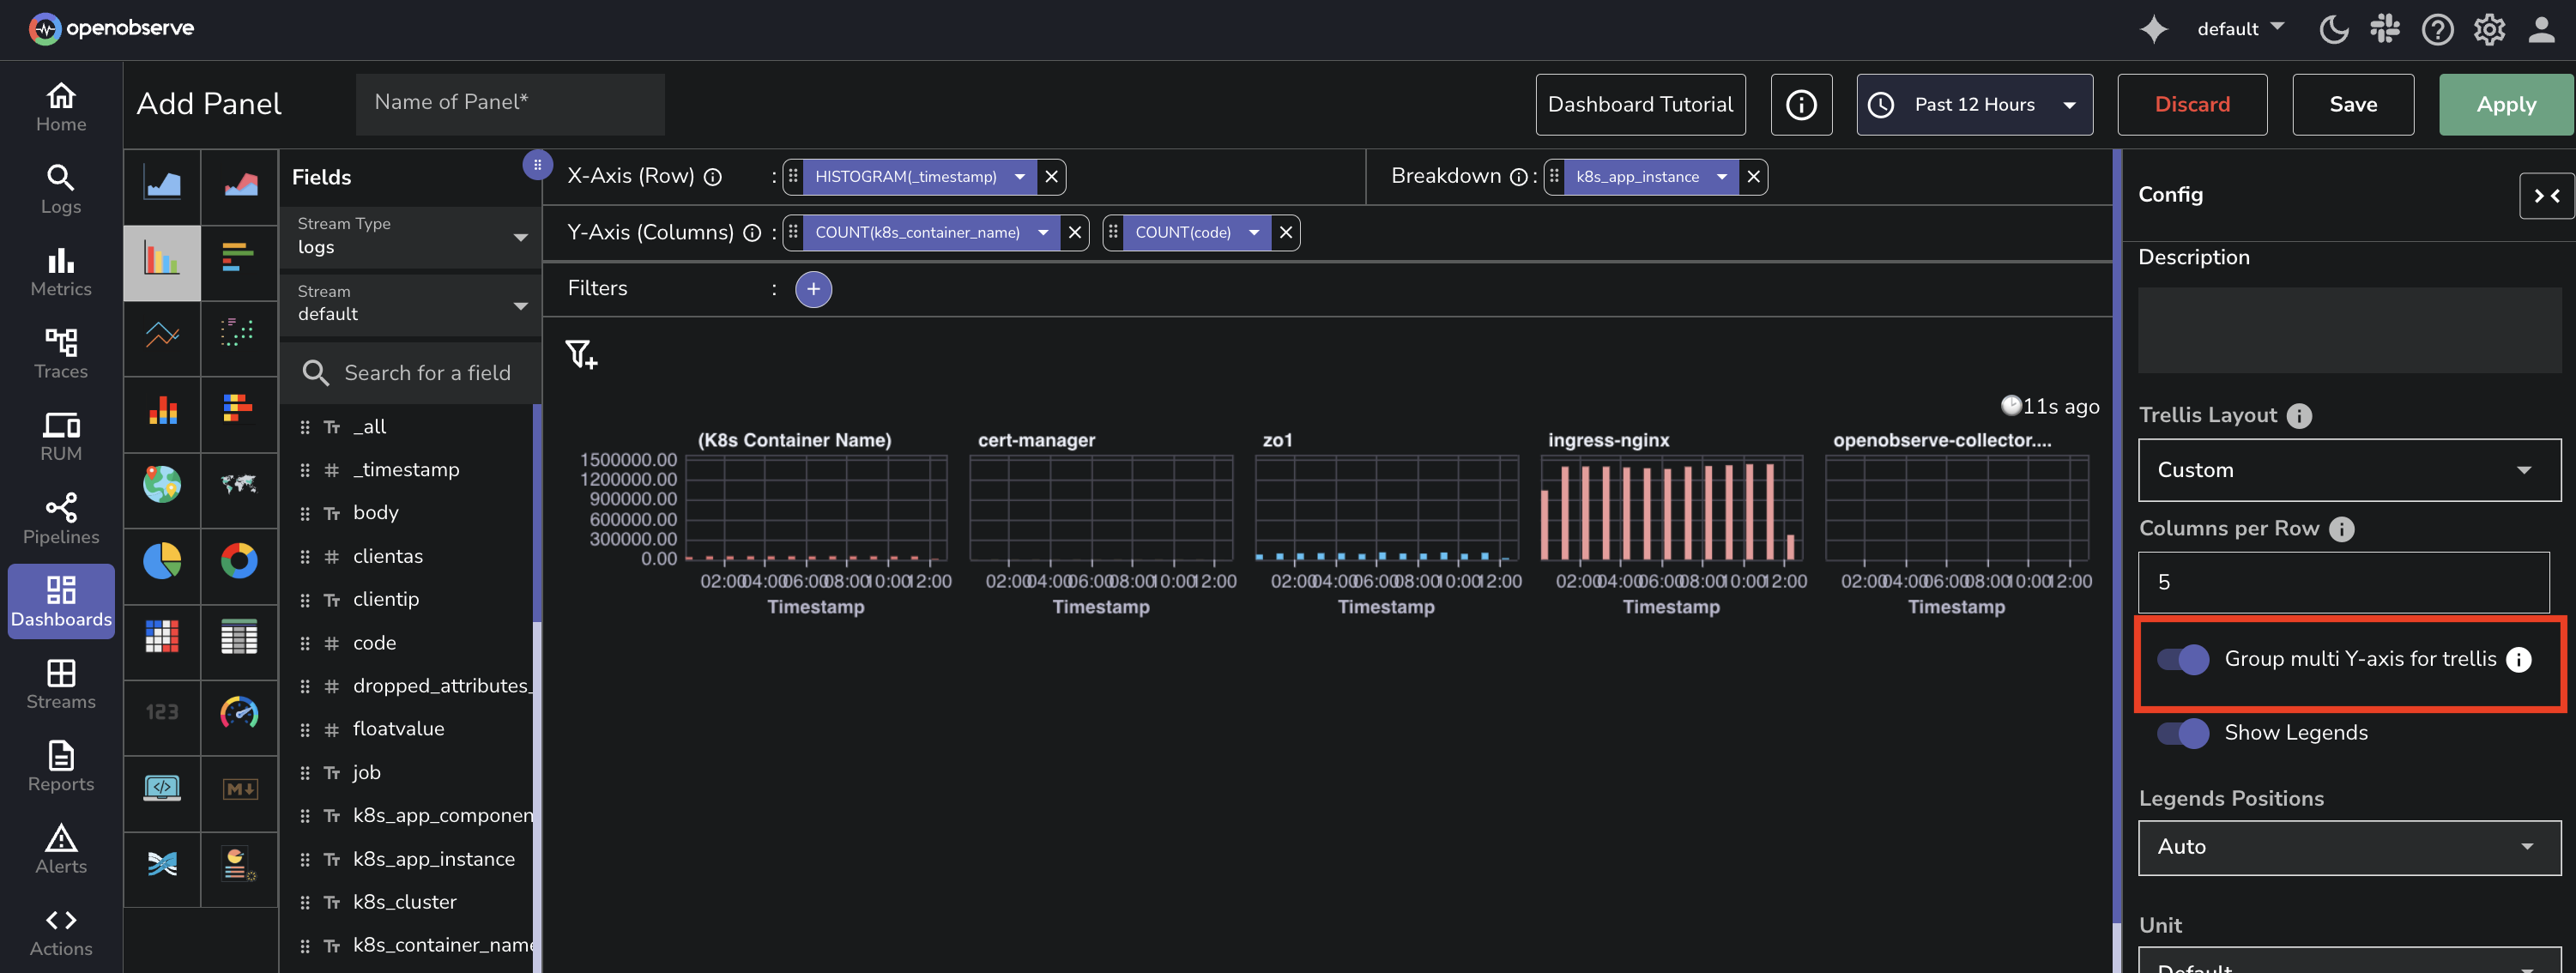
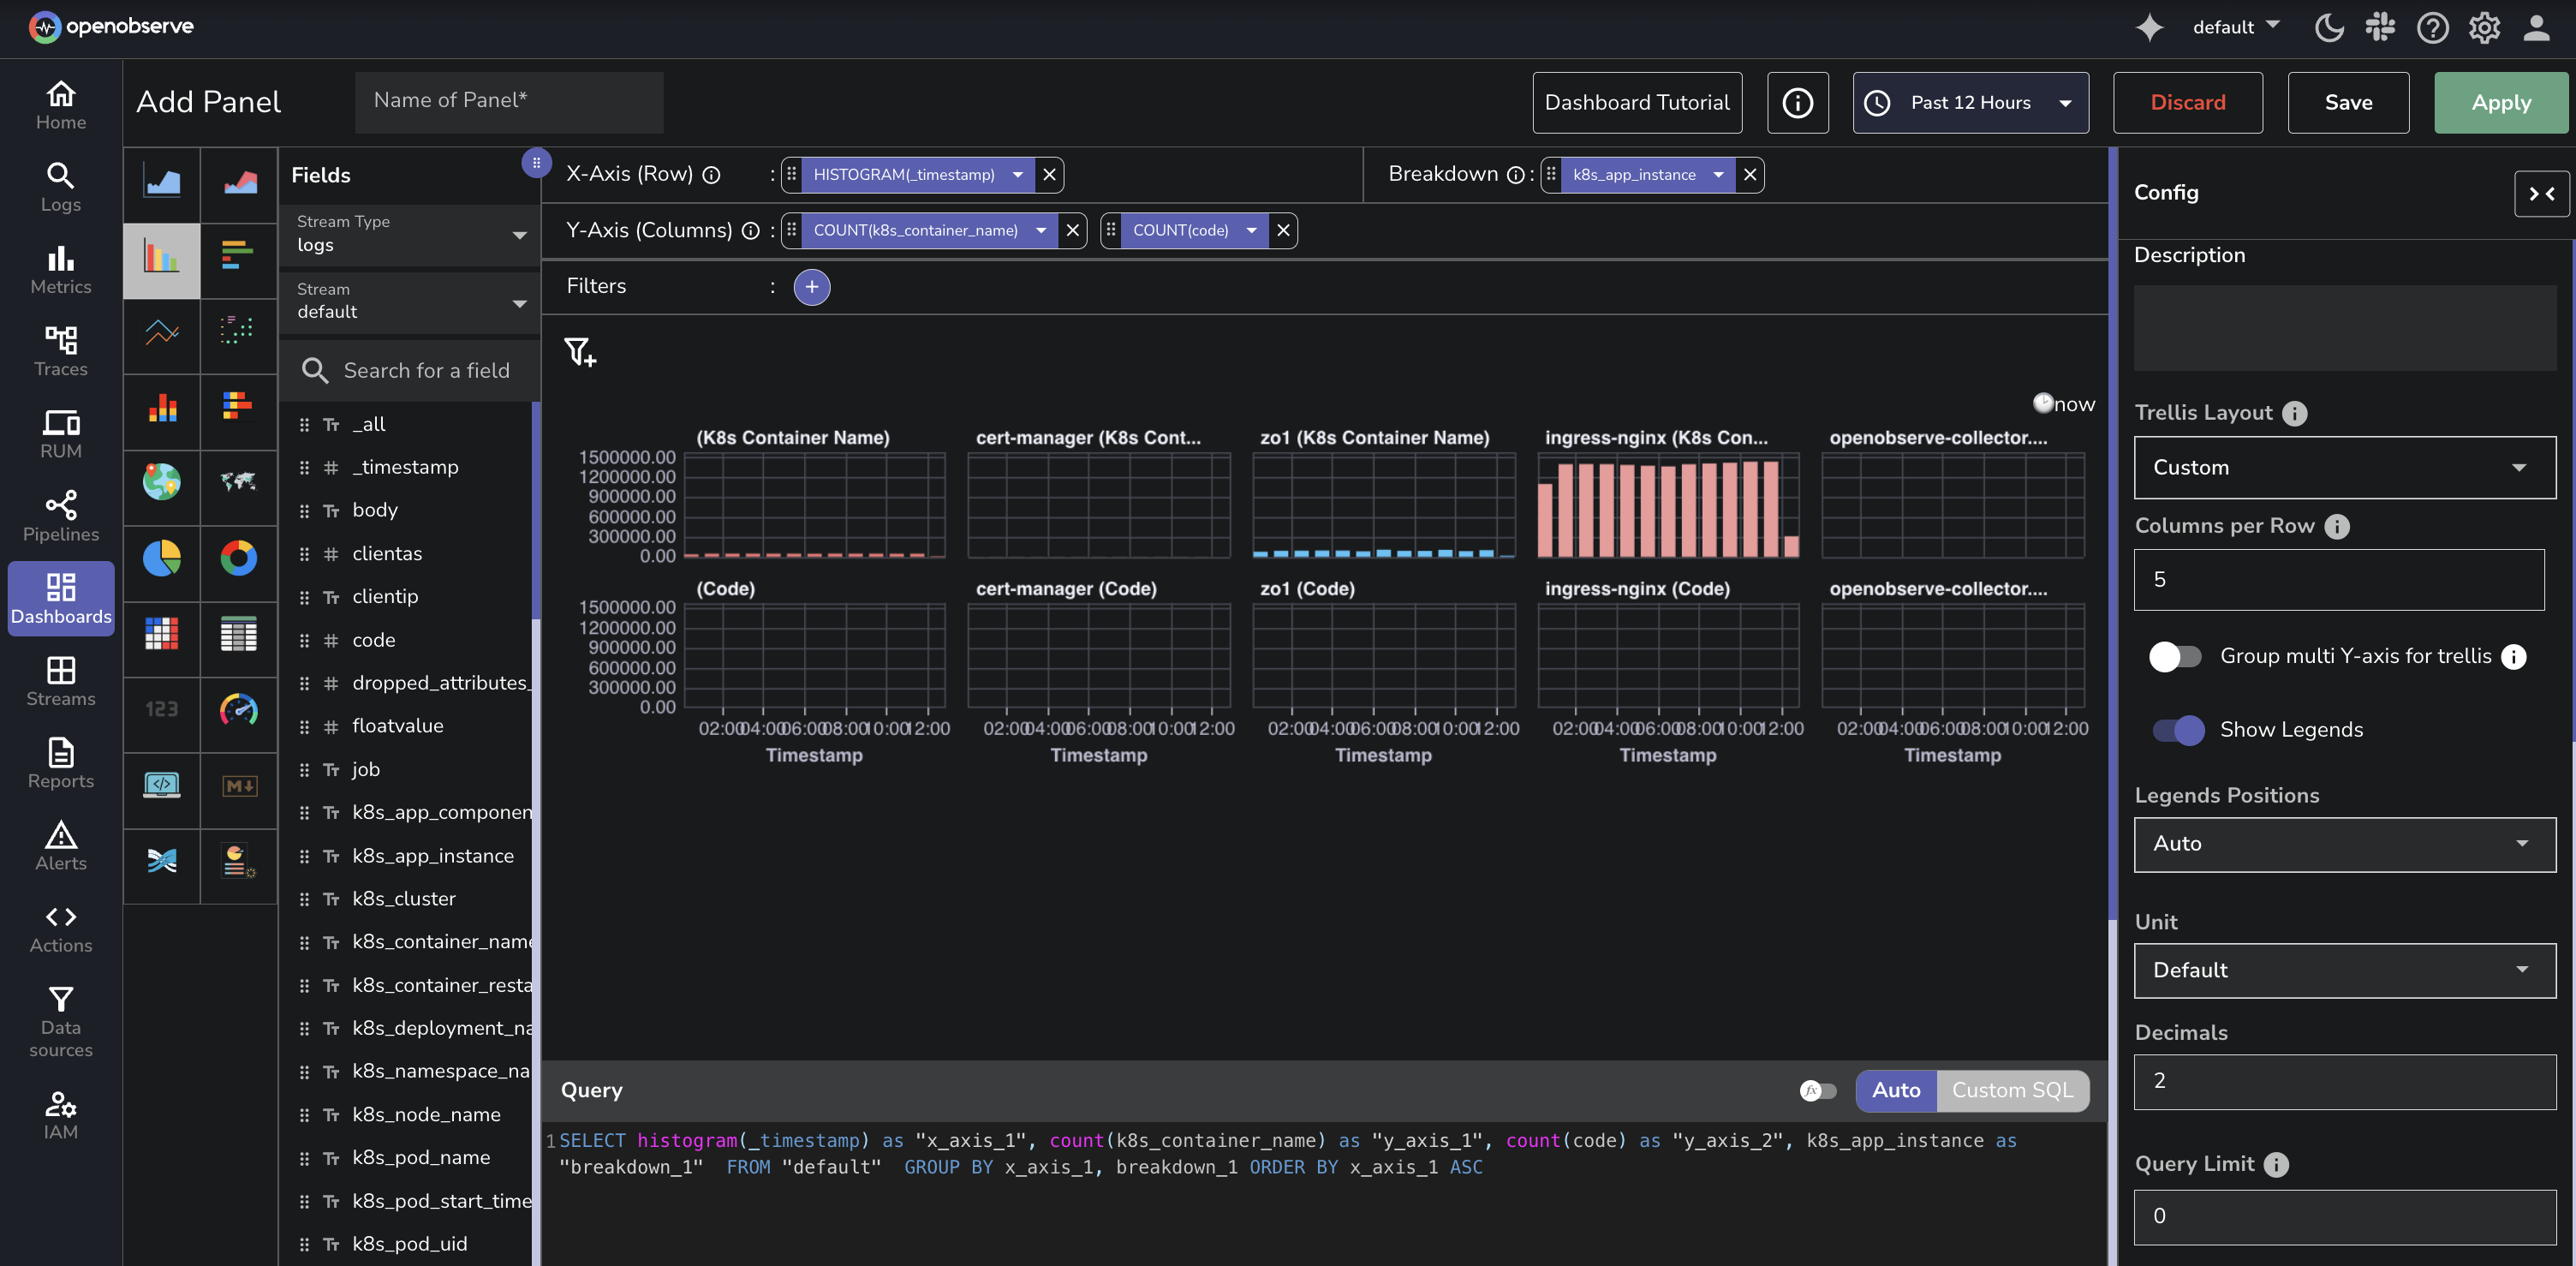
If your panel includes multiple Y-axis fields and a **Breakdown** field, use the **Group multi Y-axis for trellis** toggle to control how panels are created:
**Disabled**: Creates separate panels for each combination of Y-axis field and breakdown value.
**Enabled**: Creates one panel per breakdown value, showing multiple Y-axis series in each panel.