---
title: Manage Panels
description: Manage dashboard panels with toolbar controls for full screen, refresh, edit layout, resize, duplicate, move, query inspector, CSV/JSON export, and annotations.
---
This guide explains how to use and manage panels in the dashboard. It includes features available in the panel toolbar, step-by-step instructions, and troubleshooting tips for common issues.
The panel toolbar offers the following controls to adjust, organize, and customize your panels:
## Viewing and Refresh Controls
### Full Screen Mode
Maximizes the panel to cover the entire display, providing an expanded view.
**How to Use**:
- To expand the view, click the **Full Screen Mode** button in the panel toolbar.
- To exit **Full Screen Mode**, press **Escape** on your keyboard.
### Information Icon
The information icon on panel shows the description of the panel.
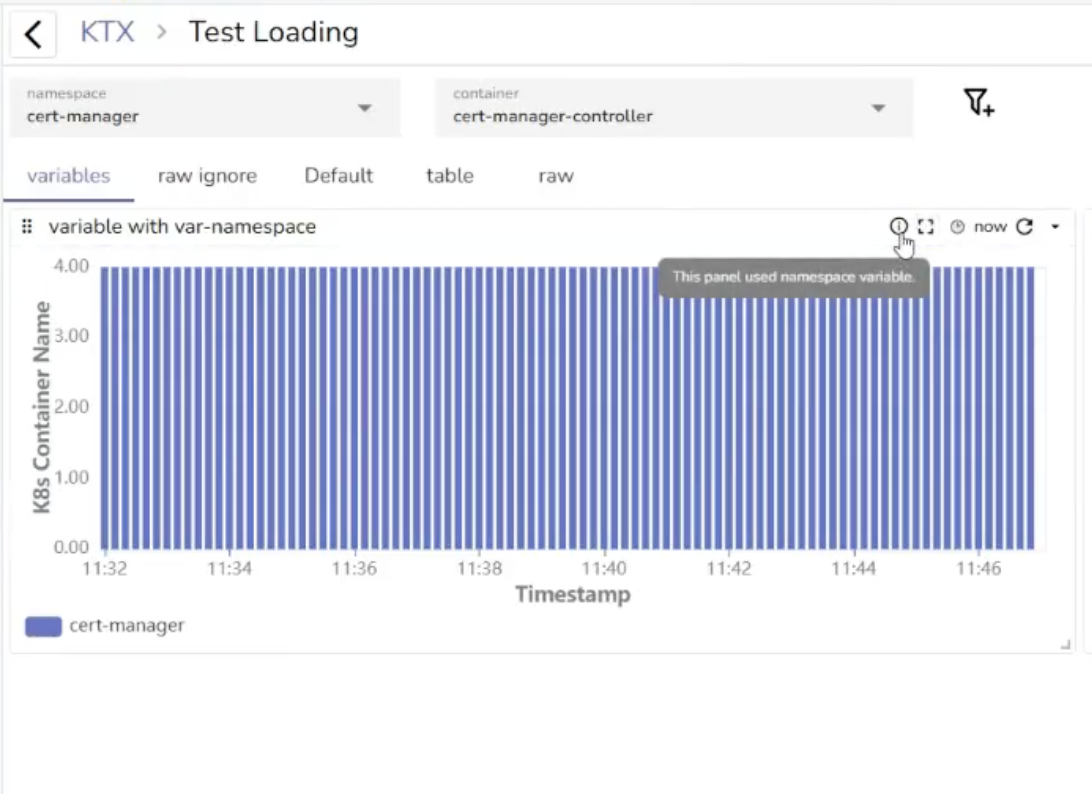
**To add, edit, or remove a panel description:**
1. In the panel toolbar, open the dropdown menu and select **Edit Panel**.
2. On the right side of the screen, select the **Config** tab.
3. Under **Description**, enter, update, or delete the panel description as needed.
4. Select **Apply** to save your changes.
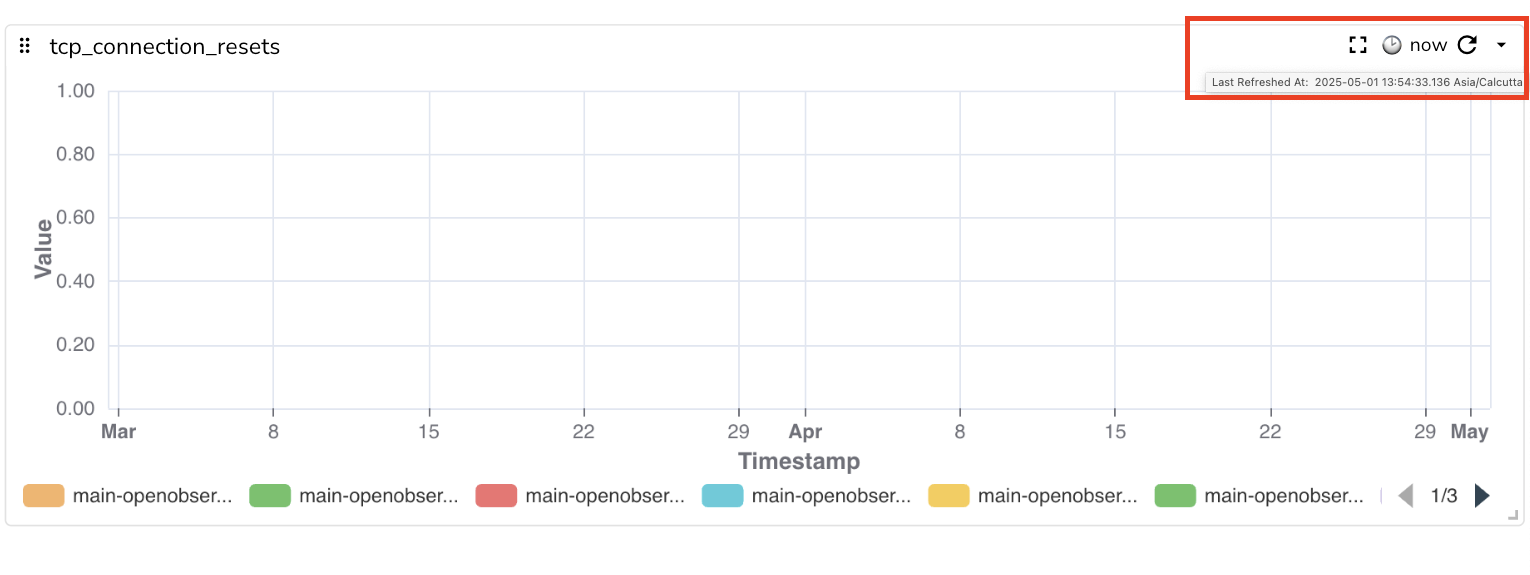
### Last Refreshed At
Displays the timestamp of when the panel’s data was last updated.
**How to Use:** Hover over the timestamp icon to view the time when the panel was last refreshed.
### Refresh
Reloads the panel to display the most recent data.
**How to Use:** Click the **Refresh** icon in the panel toolbar to reload the data.
### Cached Data Warning
Alerts the user that the displayed data is not up-to-date with the selected time range, and the data may need to be refreshed for accuracy.
To view the most up-to-date data, click **Refresh** to reload the panel.
## Panel Configuration and Layout
### Edit Panel
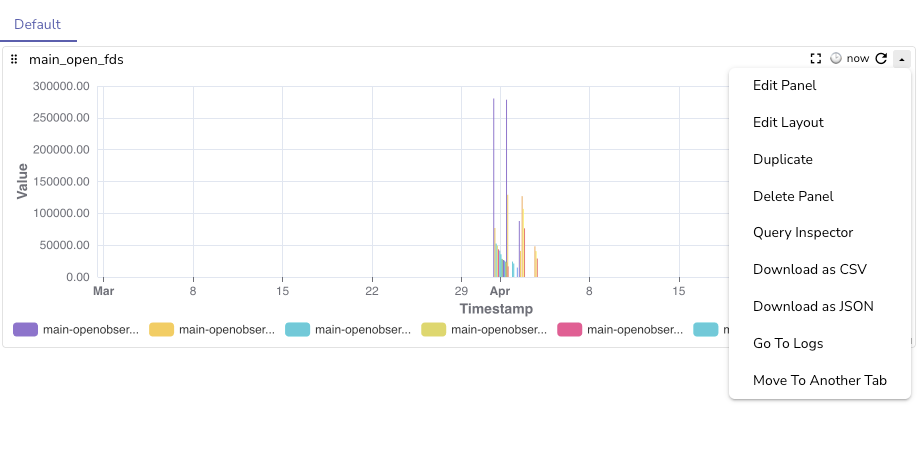
Allows you to modify the panel’s data, configuration settings, filters, query, and the chart.
### Edit Layout
Allows you to modify the height of the panel.
**How to Use:**
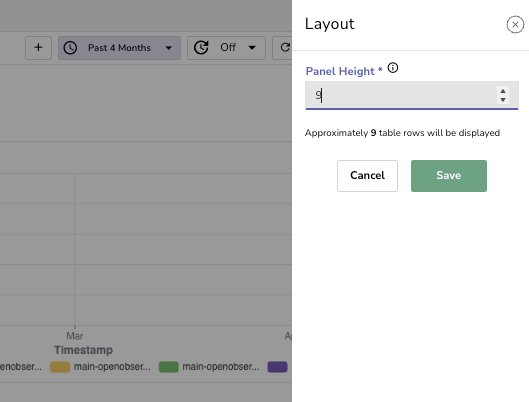
1. Click **Edit Layout** to open the layout configuration option.
2. Adjust the **Panel Height** as required.
3. Click **Save** to apply the changes.
### Adjust Size and Position
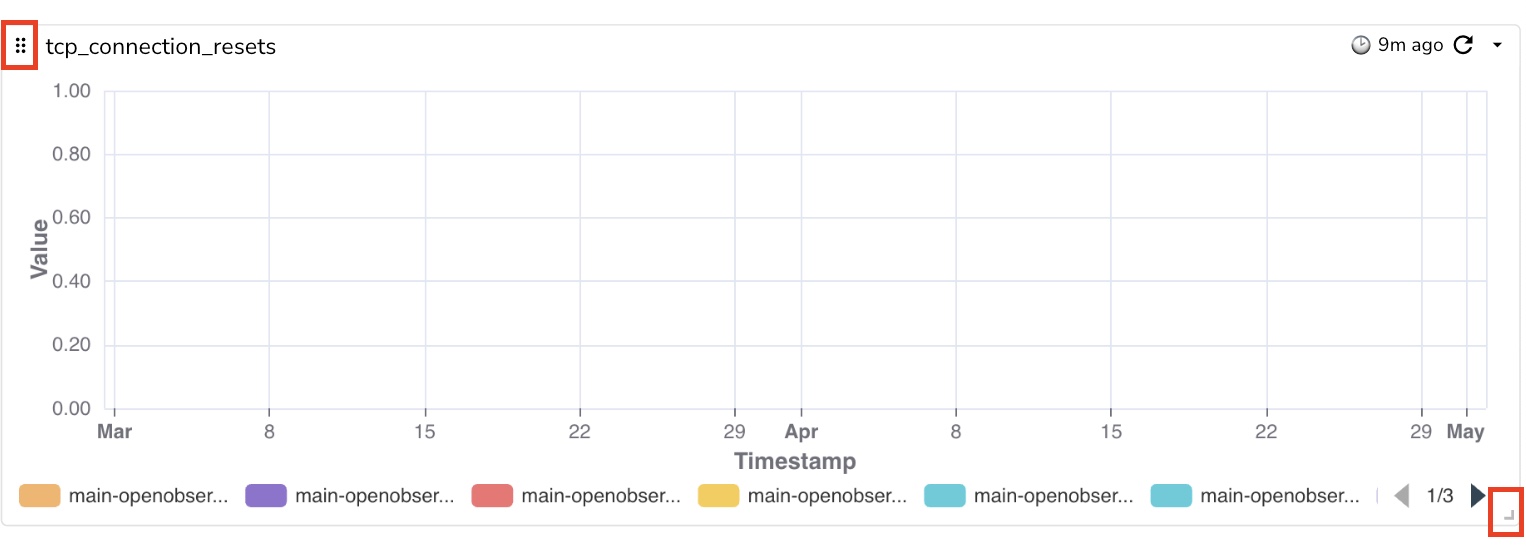
Allows you to resize and reposition the panel using the available drag handles.
**How to Use:**
- To adjust the position, click and drag the option at the top left corner of the panel.
- To resize the panel, click and drag the arrow at the bottom right corner to adjust the panel’s height and width.
## Panel Lifecycle Management
### Duplicate
Creates another version of the panel for parallel usage or testing.
### Delete Panel
Removes the panel from your dashboard.
### Move to Another Tab
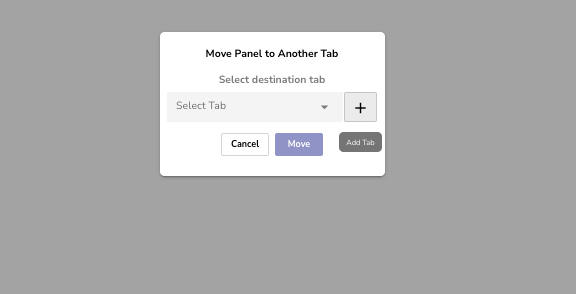
Moves the panel to a different tab.
**How to Use:** Click **Move to Another Tab**, select or create a new tab for the panel, and click **Move**.
## Data Analysis and Export
### Query Inspector
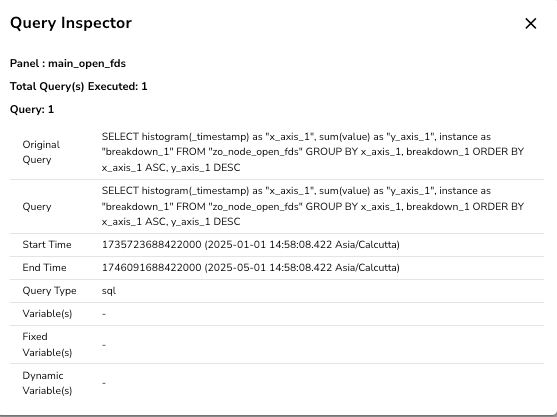
Allows you to view the query, its start and end time, query type, and variables. To modify the query, select the **Edit Panel** option.
## Download as CSV
Exports the panel’s data to a CSV file.
### Download as JSON
Exports the panel’s data to a JSON file.
### Go to Logs
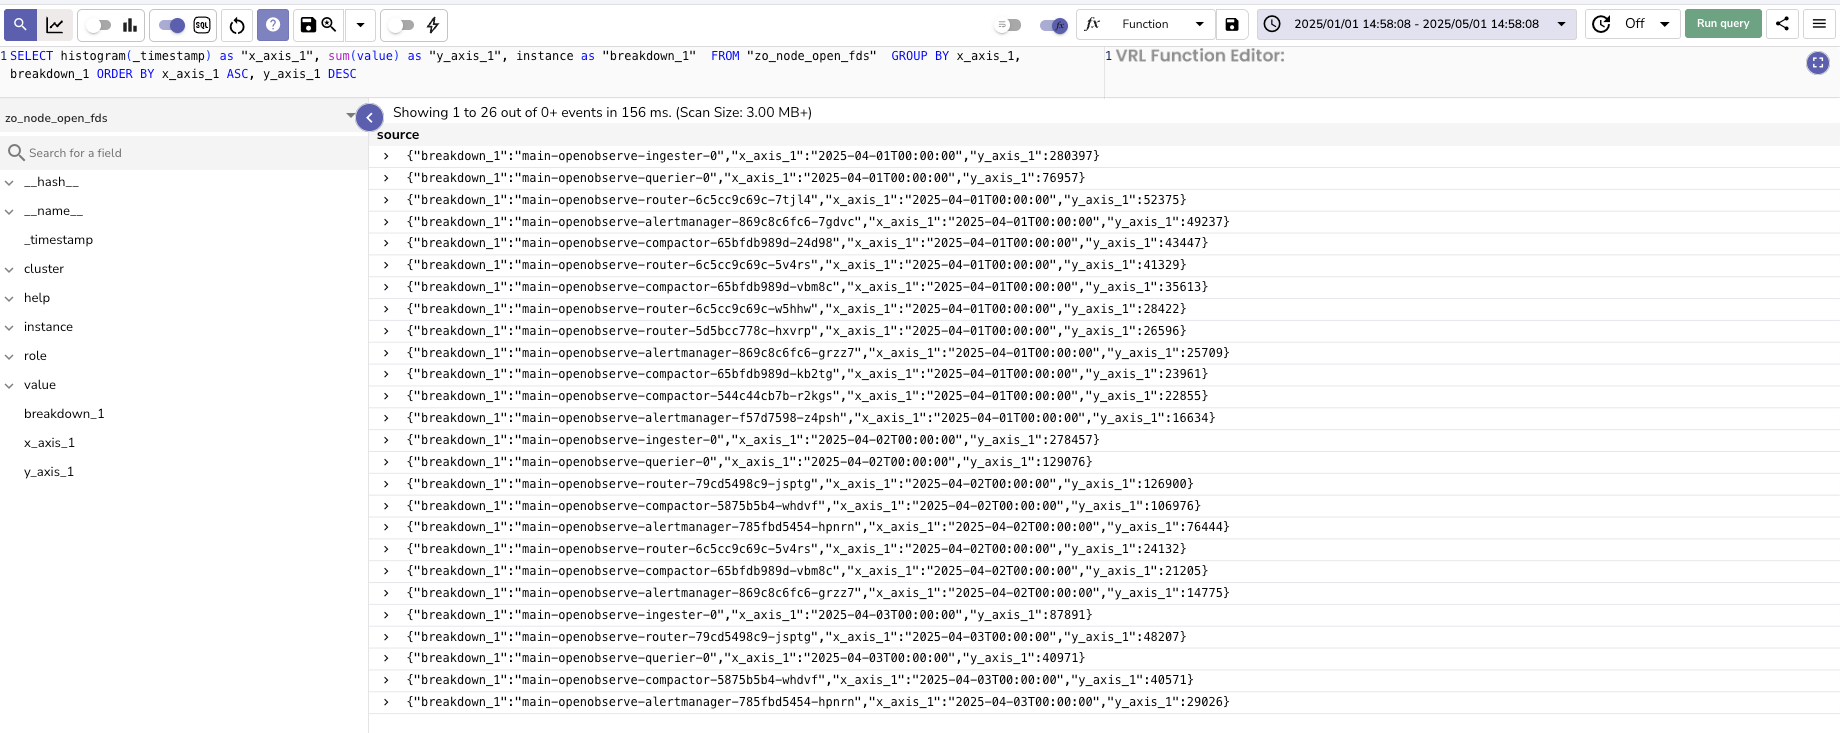
Opens the logs related to the panel’s data.
## Annotations
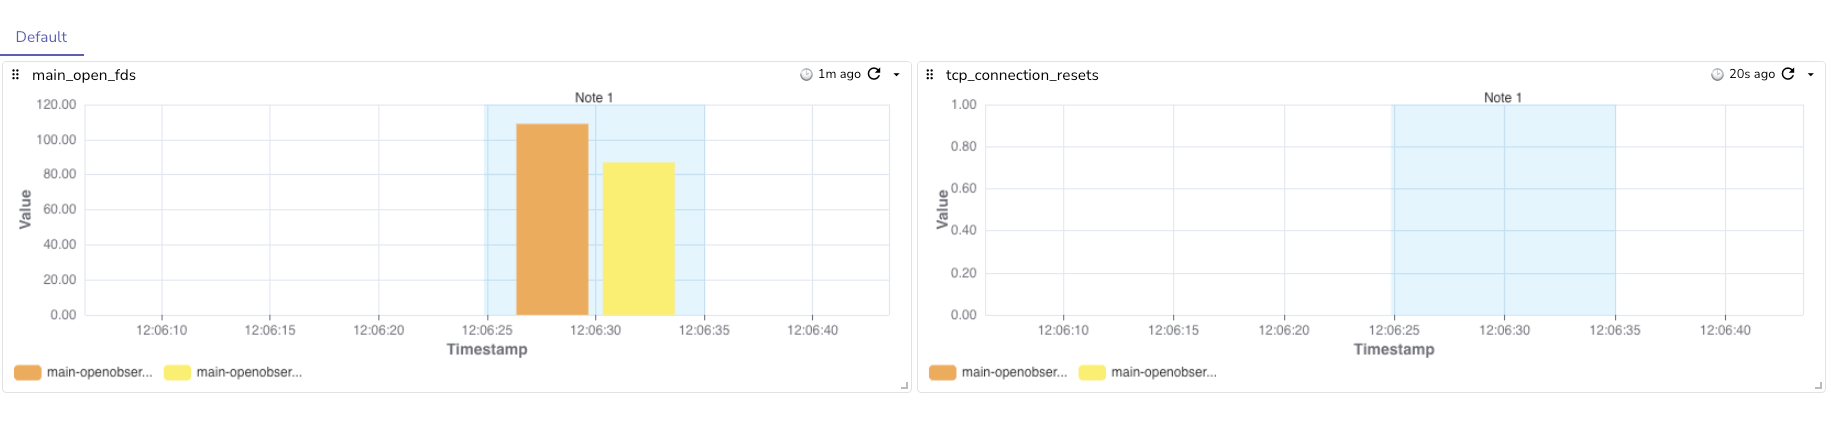
Allows you to add notes to selected data points or time ranges across multiple panels. This helps you highlight key insights or events in your data.
### Add Annotations
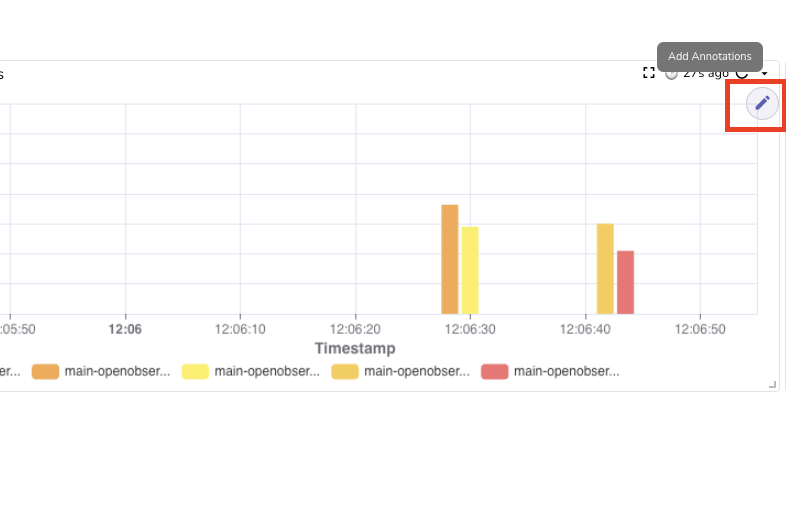
1. **Enable Annotation Mode:**
- The annotation button will appear when the panel contains time-series data.
- Click the annotation button to enter **Annotation Mode.**
2. **Select Data Points or Time Ranges:**
- Click a single data point to place the annotation at that specific point.
- Select a range of data points to apply the annotation across the entire selected range.
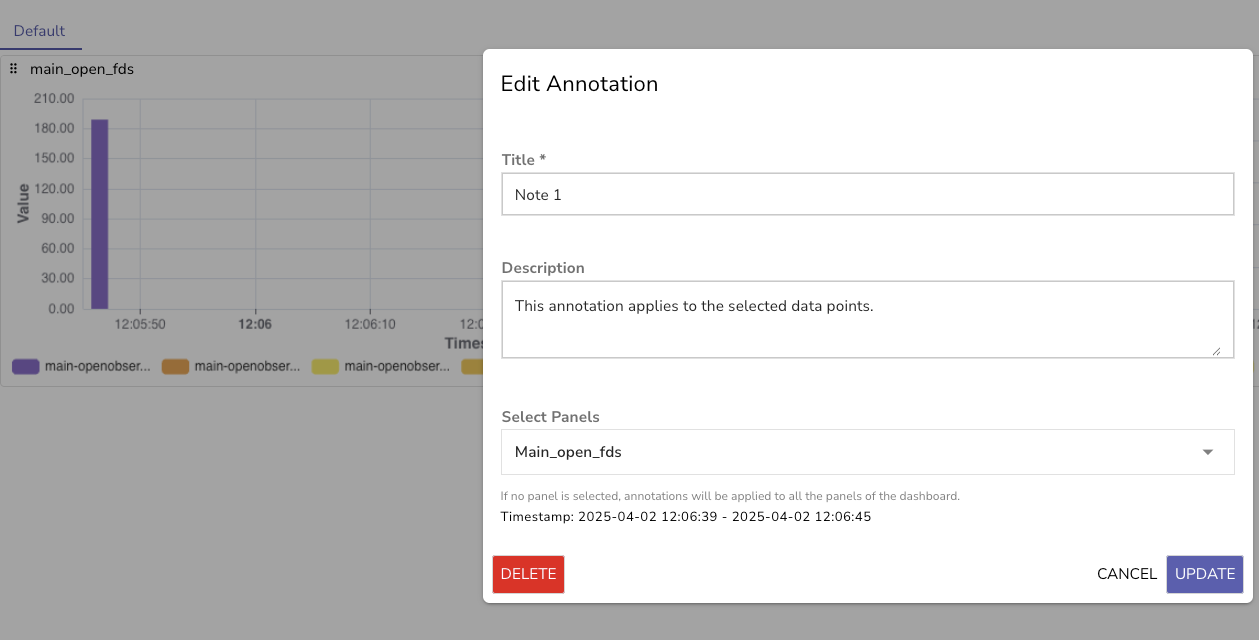
3. **Edit the Annotation:**
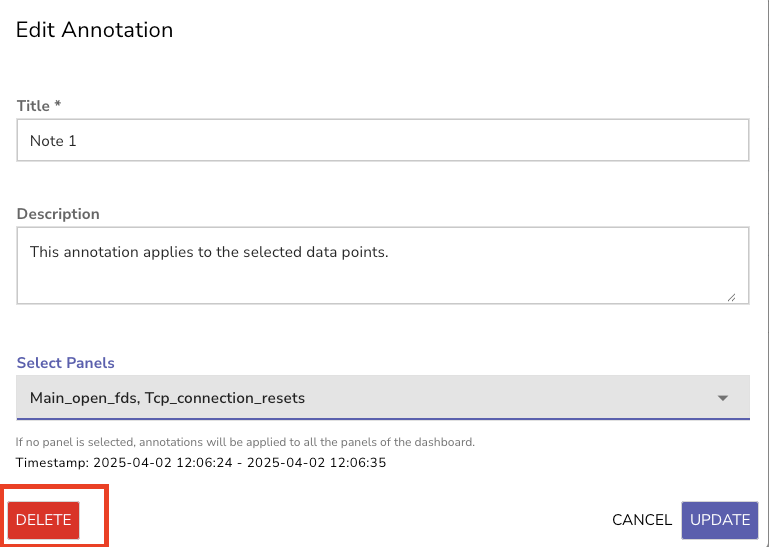
- In the **Edit Annotation** popup, provide a title (mandatory) and a description (optional) for your annotation.
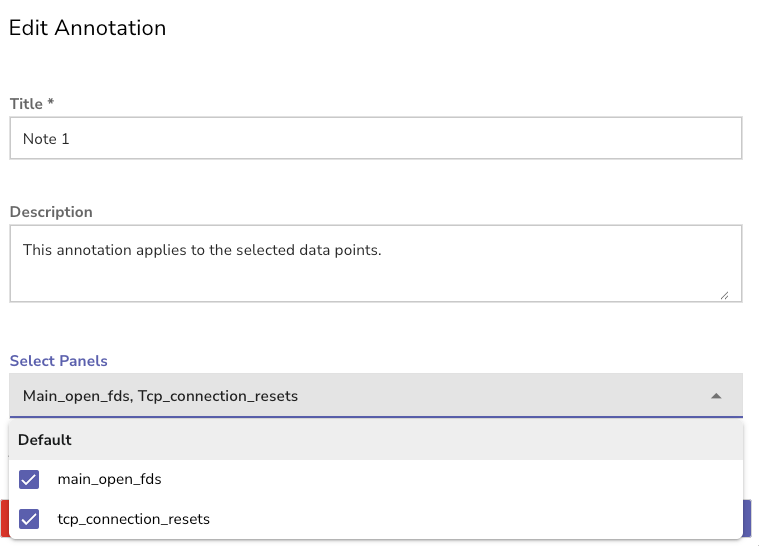
4. **Select Panels:**
- Use the dropdown menu to select panels. You can apply annotations across multiple panels based on your selection.
- If you do not select any panel, the annotation applies to all panels for the selected time range, within the dashboard by default.
5. **Save Annotation.**
### Delete Annotations
1. Enable **Annotation Mode.**
2. Select the annotation in the panel.
3. In the **Edit Annotation** pop-up, click **Delete** and confirm.