
Architecture & Terminology
Architecture: LGTM vs OpenObserve
Before — LGTM Stack
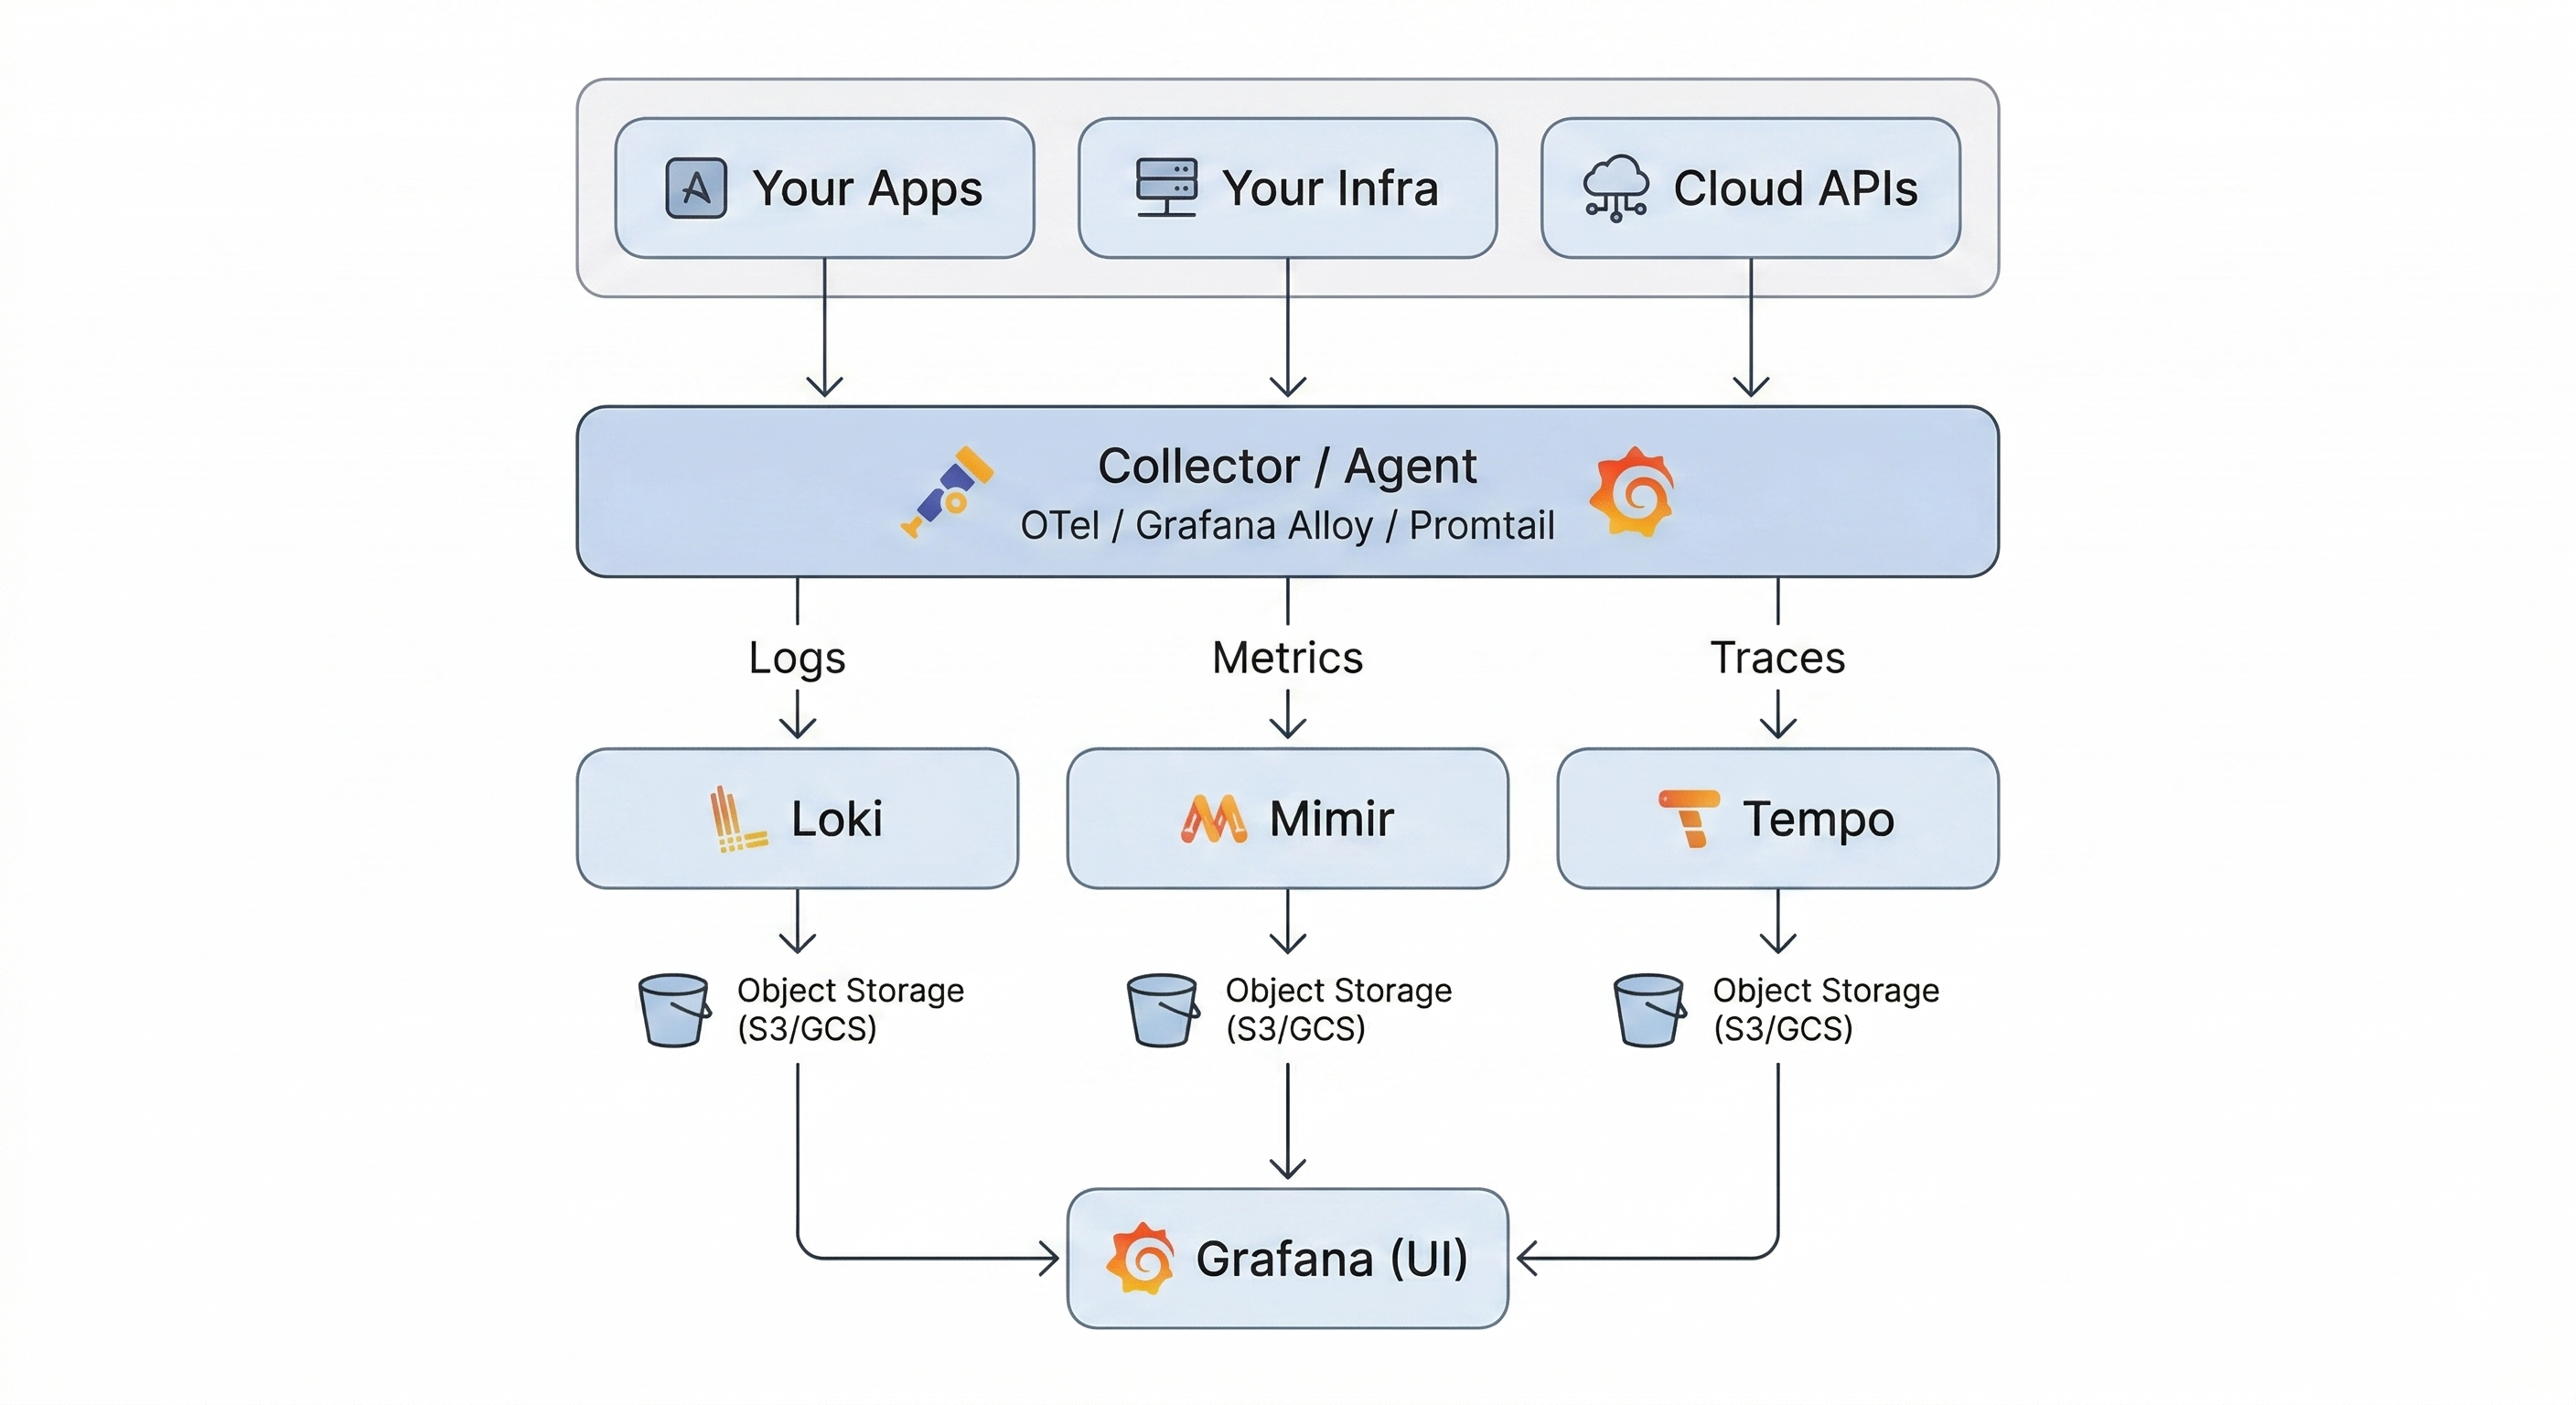
Components to operate: 6+ — Collector + Loki + Mimir + Tempo + Grafana + object storage (often with MinIO, RustFS, or separate S3 buckets per component). Each has its own Helm chart, config format, scaling knobs, and upgrade path.
After — OpenObserve
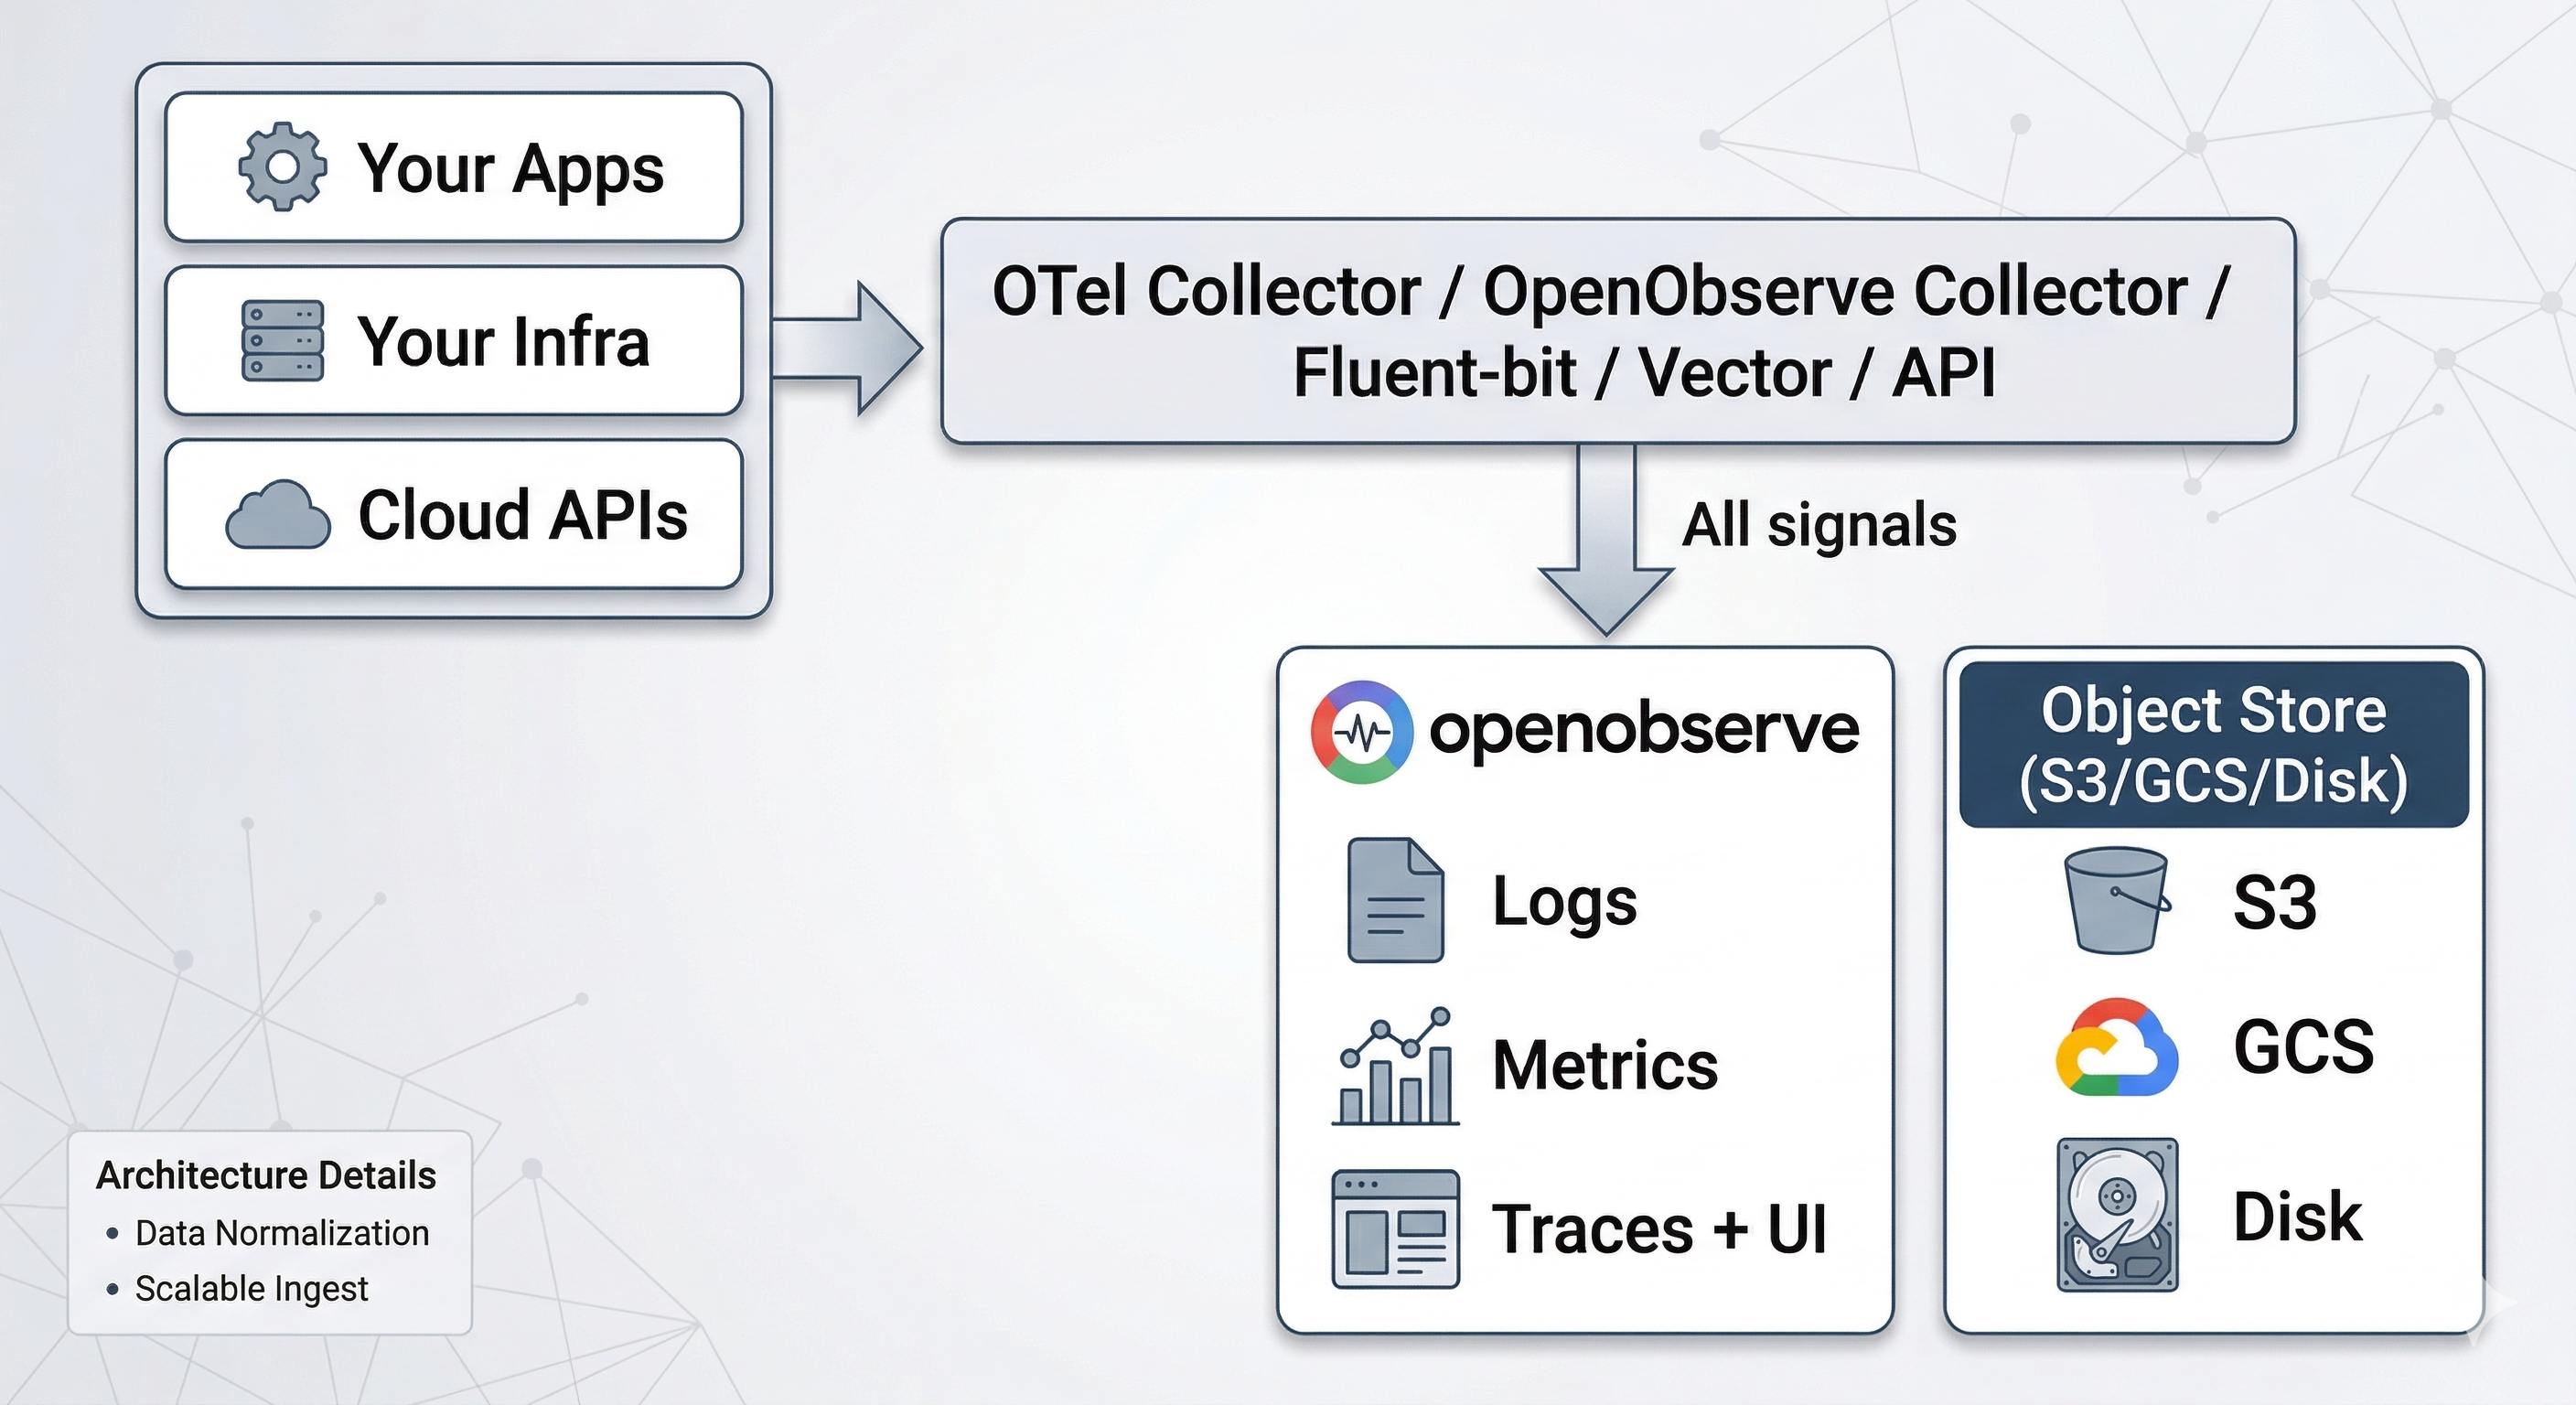
Components to operate: 2 — Collector + OpenObserve. One Helm chart, one config, one storage backend, one upgrade path.
What Changes and What Doesn't
The important thing to understand: your data collection layer stays the same. The applications, exporters, and agents that generate telemetry don't know or care whether the data ends up in Loki or OpenObserve. Only the destination endpoints change.
| Layer | Changes? | Details |
|---|---|---|
| Applications (your code) | No | OTel SDKs, Prometheus client libraries — unchanged |
| Exporters (node_exporter, cAdvisor, etc.) | No | They expose metrics, they don't care who scrapes |
| Collector (OTel Collector, Alloy, Telegraf) | Config only | Swap exporter endpoints, same receivers and processors |
| Backend (Loki/Mimir/Tempo) | Replaced | By OpenObserve |
| Visualization (Grafana) | Replaced | By OpenObserve's built-in UI |
Terminology Mapping
If you're coming from the LGTM stack, most concepts have direct equivalents in OpenObserve. The mapping isn't always 1
— some things are simpler in OpenObserve because there's less to name when everything lives in one system.Concepts
| LGTM Stack Concept | OpenObserve Equivalent | Notes |
|---|---|---|
| Data Source | Data Source | Same concept — where telemetry originates (apps, infra, cloud) |
| Loki (log backend) | Logs (built-in) | Logs are a stream type in OpenObserve, not a separate system |
| Mimir (metrics backend) | Metrics (built-in) | Metrics are a stream type in OpenObserve |
| Tempo (trace backend) | Traces (built-in) | Traces are a stream type in OpenObserve |
| Grafana (visualization) | OpenObserve UI (built-in) | Dashboards, exploration, alerting — all in one UI |
| Stream (Loki log stream) | Stream | Same concept — a named flow of data. OpenObserve uses streams for logs, metrics, and traces |
| Label (Loki/Prometheus) | Field / Column | In Loki, labels are indexed keys. In OpenObserve, every field is queryable via SQL |
| LogQL | SQL | OpenObserve uses SQL for log queries (with functions like match_all(), re_match()) |
| PromQL | PromQL | Same — OpenObserve supports PromQL for metrics queries |
| TraceQL | SQL | OpenObserve uses SQL for trace queries |
| Alertmanager | OpenObserve Alerts | Built-in alerting with Slack, email, PagerDuty, webhook support |
| Tenant / Org (Mimir multi-tenancy) | Organization | OpenObserve uses orgs for multi-tenancy (default org is default) |
| Grafana Agent / Alloy | OpenObserve Collector (optional) | OTel-based collector optimized for OpenObserve. Or keep using any OTel-compatible collector |
| Promtail | No equivalent needed | Replace with OTel Collector or Fluent Bit — Promtail is Loki-specific |
| Chunk Store (Loki) | Apache Parquet files | OpenObserve stores data as columnar Parquet files in object storage |
| TSDB blocks (Mimir) | Apache Parquet files | Same — unified columnar storage for all signal types |
| Grafana Dashboard | OpenObserve Dashboard | Built-in drag-and-drop dashboard builder with 18+ chart types |
Protocol Compatibility
The key insight for migration: OpenObserve speaks the same ingestion protocols your data sources already use. You're not changing how data is collected — just where it's sent.
| Protocol | LGTM Endpoint | OpenObserve Endpoint |
|---|---|---|
| Prometheus Remote Write | http://mimir:9009/api/v1/push | http://openobserve:5080/api/default/prometheus/api/v1/write |
| OTLP HTTP | http://tempo:4318 | http://openobserve:5080/api/default/ |
| OTLP gRPC | tempo:4317 | openobserve:5081 |
| Loki Push API | http://loki:3100/loki/api/v1/push | http://openobserve:5080/api/{org}/loki/api/v1/push |
| JSON over HTTP | N/A | http://openobserve:5080/api/default/<stream>/_json |
Next Steps
- Migrating Metrics — start with metrics, the simplest endpoint swap
- Migrating Traces — usually the easiest signal since most setups already use OTLP
- Migrating Logs — migrate log sources from Loki
Back to Overview | Next: Migrating Metrics
Last updated on
Overview
Migrate from the LGTM stack (Loki, Grafana, Tempo, Mimir) to OpenObserve. Replace four systems with one platform for metrics, traces, and logs.
Migrating Metrics
Migrate Prometheus and Mimir metrics to OpenObserve: remote write, OTel Collector, kube-prometheus-stack, Grafana Alloy, Telegraf, and CloudWatch.