Getting Started with OpenObserve - Observability Platform Setup
Get started with OpenObserve observability platform for logs, metrics, and traces monitoring. This guide helps you set up OpenObserve for complete observability. You can choose between OpenObserve Cloud (recommended) or a self-hosted installation for your observability needs.
Choose Your Installation Method
OpenObserve Cloud is the fastest way to get started and is recommended for most users because:
- Zero maintenance: No need to set up, operate, or upgrade infrastructure. We handle it all for you.
- Effortless scaling: Easily handle growing data volumes without worrying about capacity planning or scaling issues.
- Always up-to-date: Get the latest features, improvements, and security patches automatically.
OpenObserve Cloud Setup
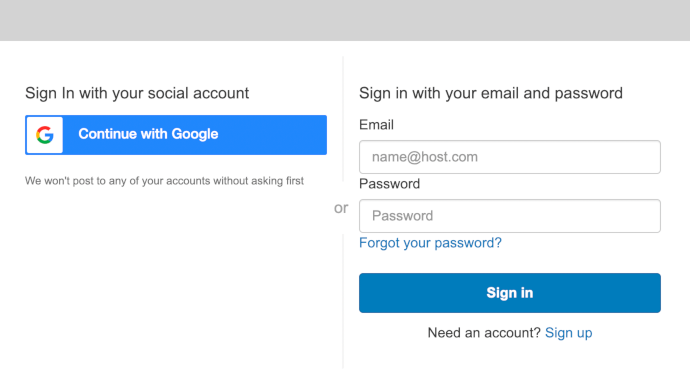
Step 1: Create Your Account
-
Navigate to https://cloud.openobserve.ai
-
Sign up using social login or create a new account
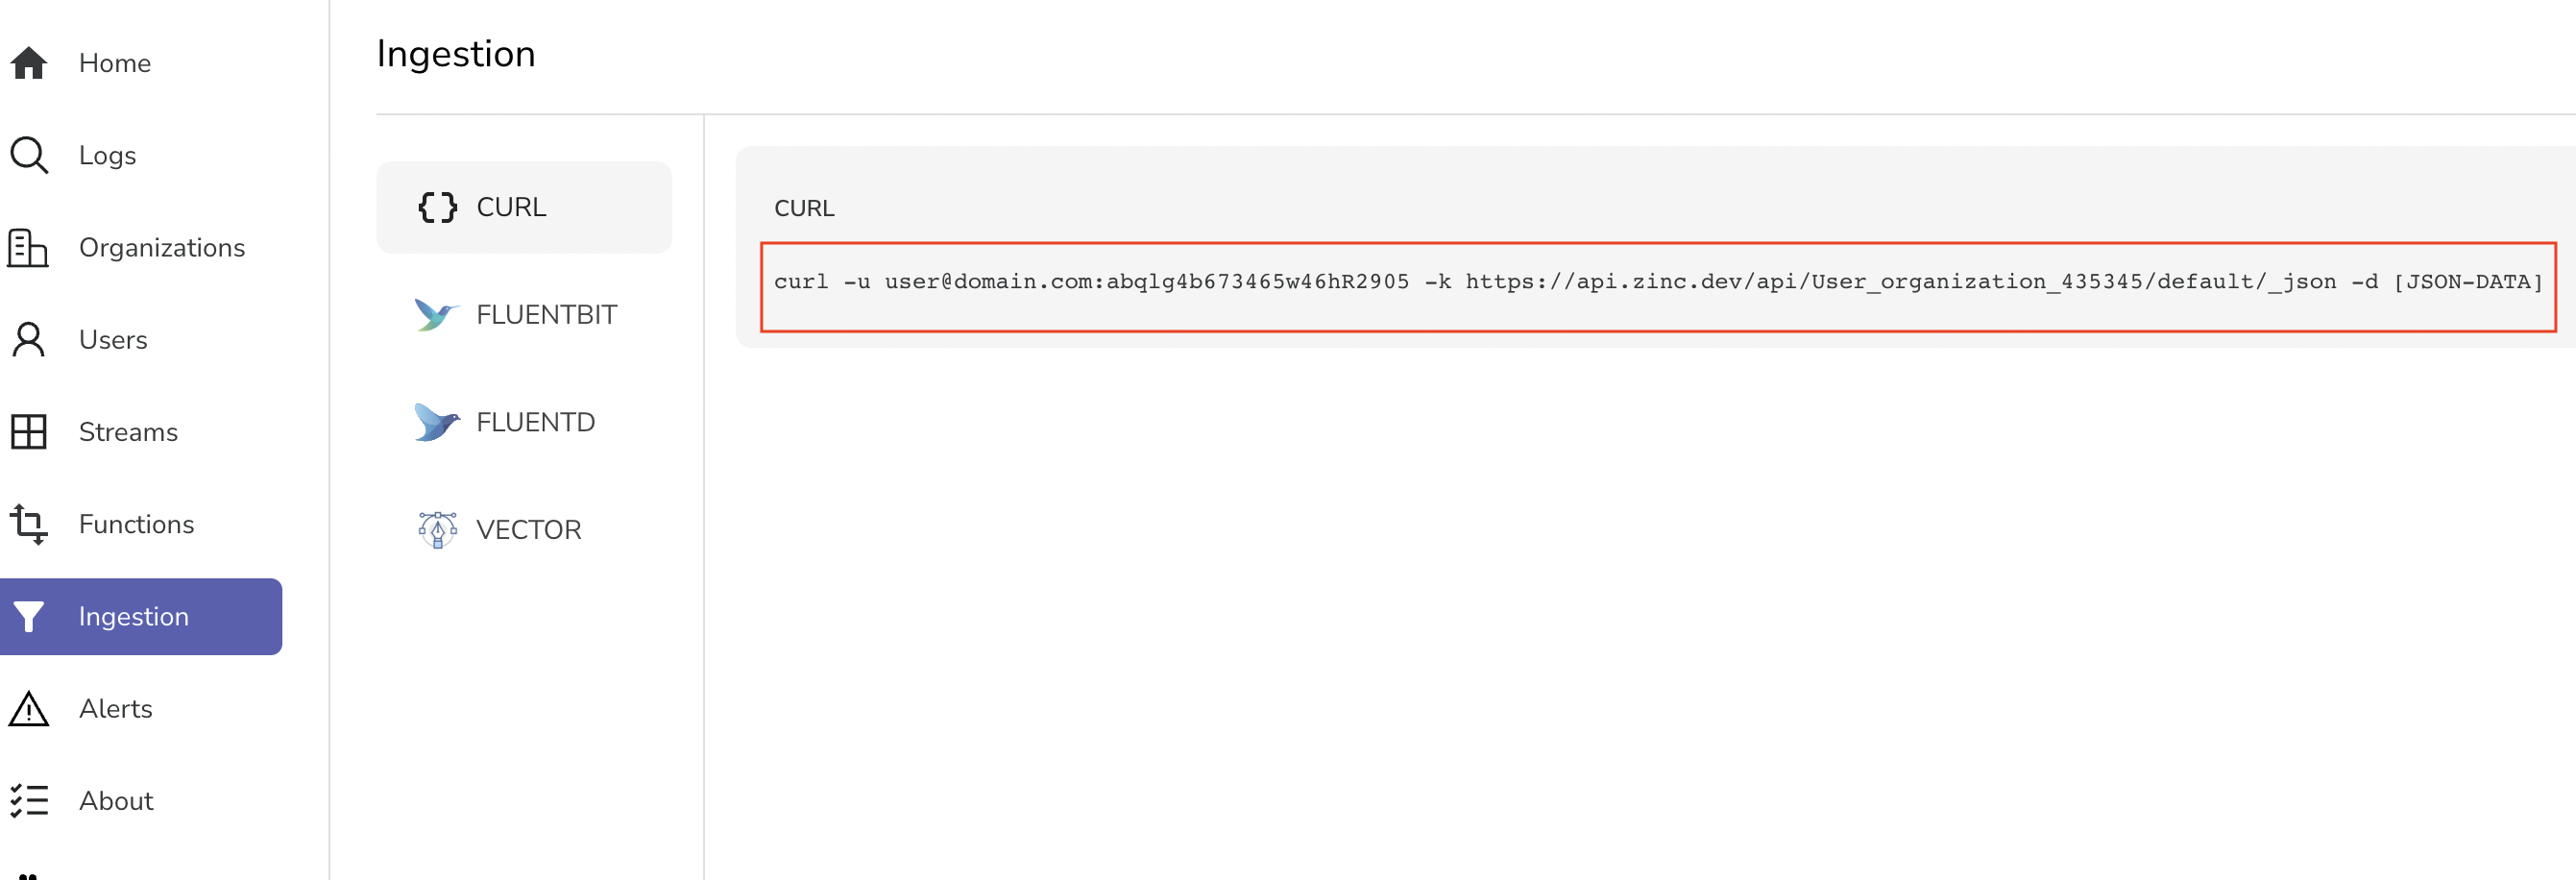
Step 2: Get Your Ingestion Credentials
-
After logging in, navigate to the Data Sources section in the sidebar
-
Copy the provided cURL command - it contains your unique credentials
-
Your endpoint will look like:
https://api.openobserve.ai/api/[YOUR_ORG]/default/_json
You are ready to ingest data. Now head over to Load sample data section.
Choose self-hosted if you need:
- Full control over your data and infrastructure
- Custom configurations or integrations
- On-premises deployment requirements
Self-Hosted Installation
Important: These instructions are for single-node installations. For production high-availability setups, see our HA deployment guide.
You'll need to set root user credentials (ZO_ROOT_USER_EMAIL and ZO_ROOT_USER_PASSWORD) on first startup only. They are not required for subsequent runs.
Download and Install
- Download Binaries from downloads page
- Open Command Prompt or PowerShell as Administrator
- Run the following commands:
#command prompt
set ZO_ROOT_USER_EMAIL=root@example.com
set ZO_ROOT_USER_PASSWORD=Complexpass#123
openobserve.exe
#powershell
$env:ZO_ROOT_USER_EMAIL="root@example.com"
$env:ZO_ROOT_USER_PASSWORD="Complexpass#123"
.\openobserve.exeNote
You can set email and password based on your preference
- Download the appropriate binary from our downloads page
- Make it executable:
chmod +x openobserve - Run with environment variables as shown:
# Run OpenObserve
ZO_ROOT_USER_EMAIL="root@example.com" ZO_ROOT_USER_PASSWORD="Complexpass#123" ./openobserve
Note
If you see an error like version GLIBC_2.27 not found, download the musl binary instead:
- Look for files ending in
-linux-musl.tar.gzon the releases page - musl binaries have slightly lower performance but no external dependencies
Prerequisites: Ensure Docker is installed and running on your system.
Docker images are available at:
- Enterprise: https://gallery.ecr.aws/zinclabs/openobserve-enterprise
- OSS : https://gallery.ecr.aws/zinclabs/openobserve
Linux/macOS:
docker run -v $PWD/data:/data -e ZO_DATA_DIR="/data" -p 5080:5080 -e ZO_ROOT_USER_EMAIL="root@example.com" -e ZO_ROOT_USER_PASSWORD="Complexpass#123" o2cr.ai/openobserve/openobserve-enterprise:latestWindows:
# Windows Command Prompt
docker run -d --name openobserve -v %cd%/openobserve-data:/data -e ZO_DATA_DIR="/data" -e ZO_ROOT_USER_EMAIL="root@example.com" -e ZO_ROOT_USER_PASSWORD="Complexpass#123" -p 5080:5080 o2cr.ai/openobserve/openobserve-enterprise:latest
Docker Image Options:
latest: Compatible with most environmentslatest-simd: Optimized for systems with AVX512 (Intel) or NEON (ARM) for better performance
Troubleshooting
If you encounter AWS ECR login issues:
aws ecr-public get-login-password --region us-east-1 | docker login --username AWS --password-stdin public.ecr.awsPrerequisites: Ensure kubectl is configured and you have cluster access.
-
Create namespace:
kubectl create namespace openobserve -
Deploy OpenObserve:
kubectl apply -f https://raw.githubusercontent.com/zinclabs/openobserve/main/deploy/k8s/statefulset.yaml -
Access the service:
kubectl -n openobserve port-forward svc/openobserve 5080:5080
Verify Installation
After installation, verify OpenObserve is running:
-
Open your browser and navigate to:
- Self-hosted: http://localhost
- Cloud: https://cloud.openobserve.ai
-
Log in with your credentials:
- Self-hosted: Use the email/password you set in environment variables
- Cloud: Use your account credentials
-
You should see the OpenObserve dashboard
Load Sample Data
Let's load some real-world log data to explore OpenObserve's features.
Step 1: Download Sample Data
# Download and extract sample Kubernetes logs
curl -L https://zinc-public-data.s3.us-west-2.amazonaws.com/zinc-enl/sample-k8s-logs/k8slog_json.json.zip -o k8slog_json.json.zip
unzip k8slog_json.json.zip
What's in the sample data: This file contains real Kubernetes application logs with various log levels (info, warning, error) and structured JSON fields.
Step 2: Load Data into OpenObserve
For OpenObserve Cloud:
# Use the cURL command from your Ingestion page
curl -u your-email@domain.com:your-password \
-H "Content-Type: application/json" \
https://api.openobserve.ai/api/YOUR_ORG/default/_json \
-d "@k8slog_json.json"
For Self-Hosted Installation:
curl -u "root@example.com:Complexpass#123" \
-H "Content-Type: application/json" \
http://localhost:5080/api/default/default/_json \
-d "@k8slog_json.json"
Step 3: Verify Data Upload
You should see output similar to:
{"code":200,"status":"ok","records":1000}If you see errors, check:
- Your credentials are correct
- The JSON file was downloaded completely
- OpenObserve is running and accessible
Search Your Data
Now let's explore the data you just loaded.
Step 1: Access the Logs Interface
- Navigate to your OpenObserve instance
- Click on Logs in the left sidebar
- Select default from the stream dropdown (top-left)
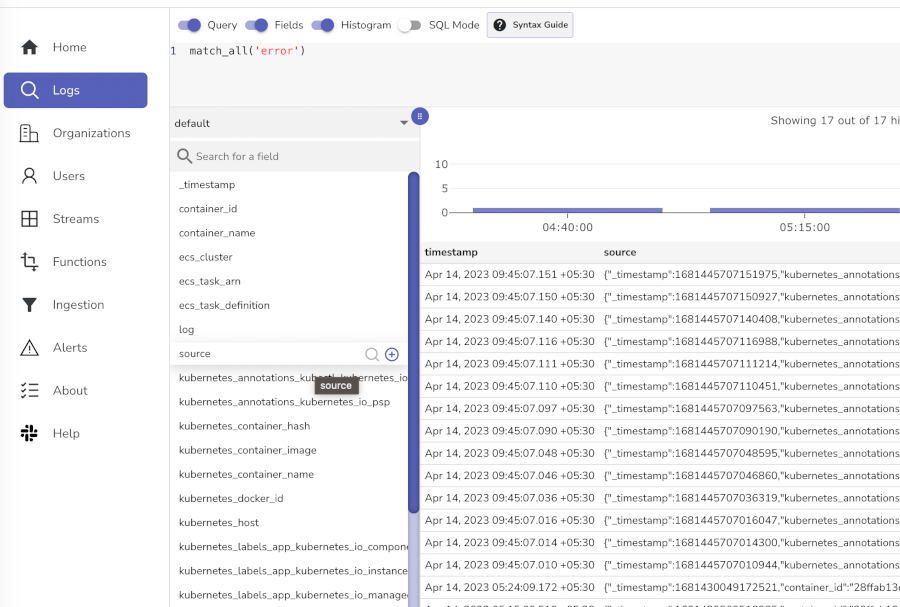
Step 2: Try These Sample Searches
Basic searches (click the Run Query button after each):
- View all logs: Leave search box empty and click search
- Find errors:
level='error'ormatch_all('error')
Congratulations! You now have OpenObserve running with sample data.
Next Steps - Send Your Own Data
- Application logs: Use our logging libraries for your applications
- Metrics: Set up Prometheus integration
- Traces: Configure OpenTelemetry for distributed tracing
Troubleshooting Common Issues
Can't access OpenObserve web interface
- Check if the process is running
- Verify port 5080 is not blocked by firewall
- For Docker: ensure port mapping is correct (
-p 5080:5080)
Authentication errors
- Verify your email/password combination
- For self-hosted: ensure environment variables were set correctly
- For cloud: check your account credentials
Data not appearing
- Verify the curl command returned success (200 status)
- Check the time range in the web interface
- Ensure you selected the correct stream/index
Performance issues
- Consider using the SIMD Docker image for better performance
- Check available memory and CPU resources
- For large datasets, consider the high-availability deployment
Need some help?
- Join our Community Slack
- Or Contact support
Last updated on
Architecture
How OpenObserve is structured: single-node and HA deployment modes, the role of each component, how data flows through the system, and how durability works.
Overview
Install OpenObserve Enterprise Edition. Choose HA on EKS / AKS / GKE, review licensing tiers, and explore enterprise features.