
Manage Pipelines
This page describes how to manage real-time and scheduled pipelines in OpenObserve.
Pipeline management options
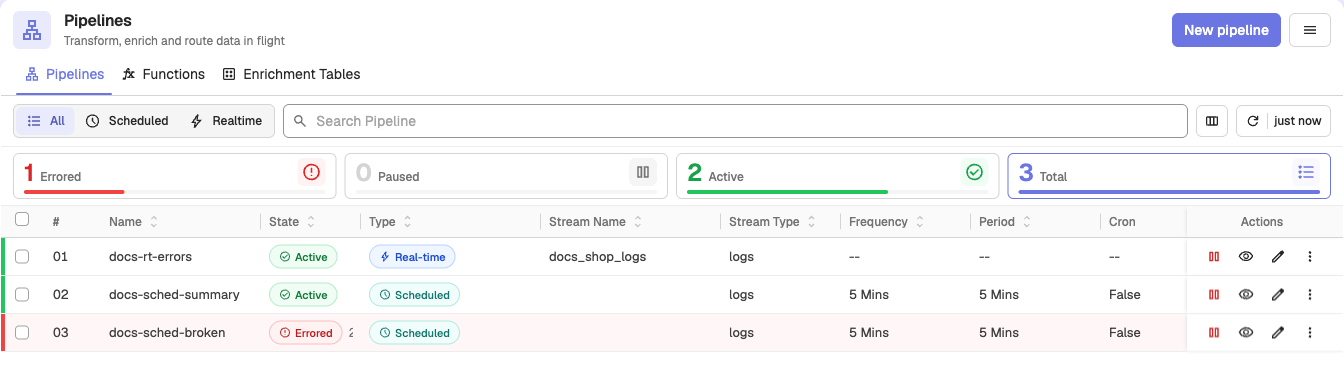
Go to Data > Pipelines. You can filter, search, view, edit, pause, resume, export, or delete pipelines from a single interface.
Filter pipelines
Filter pipelines
Use the filter options All, Scheduled, and Realtime to view only the type of pipelines you want to work with.
The summary strip above the table shows how many pipelines are Errored, Paused, Active, and in Total. Click a count to show only the pipelines in that state.

Search pipelines
Search pipelines
Use the Search Pipeline box to locate pipelines by name or attributes.

Pipeline list view
Pipeline list view
The pipeline list displays key information for each pipeline.

- Name: Identifies the pipeline.
- State: Shows whether the pipeline is Active, Paused, or Errored.
- Type: Indicates whether the pipeline is real-time or scheduled.
- Stream Name: Shows the associated source stream.
- Stream Type: Indicates the type of data in the source stream such as logs, metrics, or traces.
- Frequency: Displays how often the scheduled pipeline runs.
- Period: Shows the time duration used for each execution window of a scheduled pipeline.
- Cron: Indicates whether the pipeline is configured using a cron expression.
Actions tab
Actions tab
Each pipeline row includes the following actions. Start/Pause, View, and Edit are icons in the row; the others are in the More actions (⋮) menu.
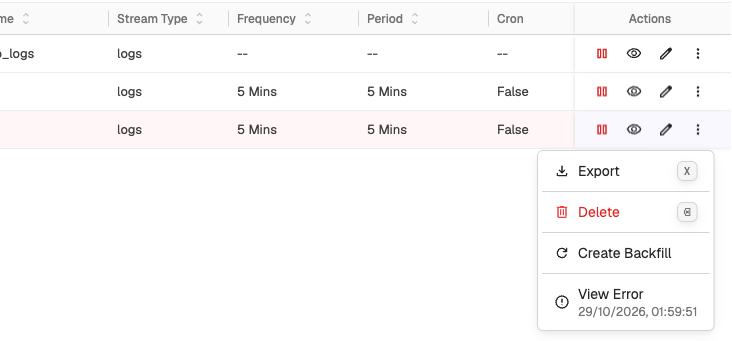
- Start or pause pipeline
- View pipeline
- Edit pipeline
- Export pipeline configuration
- Delete pipeline
- Create Backfill (scheduled pipelines, Enterprise Edition): reprocess a past time range
- View Error (only when the pipeline has an error)
To act on several pipelines at once, select their rows. The selection bar offers Export, Pause, Resume, and Delete.
Pause and resume pipelines
You can pause both real-time and scheduled pipelines.
Pausing a pipeline:
- When paused, the pipeline stops executing on its scheduled intervals.
- The system preserves the exact timestamp when the pause occurred.
- Pipeline configuration and state are maintained during the pause.
Resuming a real-time pipeline:
- Real-time pipelines resume instantly with one click.
- No dialog or additional options are shown.
- Processing continues from the current moment.
Resuming a scheduled pipeline:
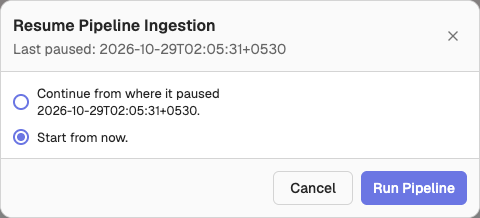
Scheduled pipelines display a Resume Pipeline Ingestion dialog with two options.
-
Continue from where it paused:
- Processes all data from the pause timestamp to the current time.
- Maintains complete data continuity with no gaps.
- May consume significant system resources for long pause periods.
Note: Use the Continue from where it paused option, when data completeness is critical.
-
Start from now:
- Begins processing from the current timestamp.
- Creates a data gap between the pause and resume timestamps.
- Provides immediate resumption with minimal resource usage.
Note: Use the Start from now option, when data gaps are acceptable.
Pipeline error
If a pipeline encounters an error, its State shows Errored and the More actions (⋮) menu shows View Error.
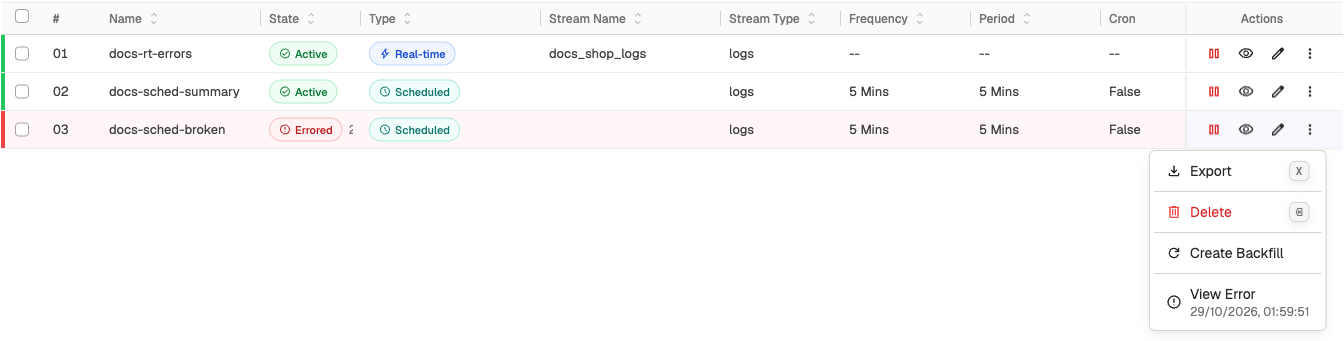 Selecting View Error opens a dialog that displays the Error Summary and any Node Errors.
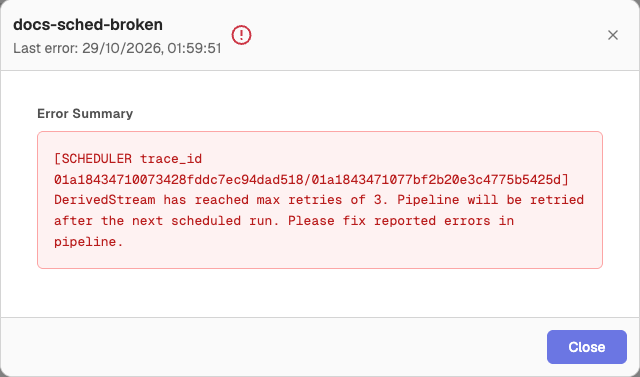
Pipeline history
Pipeline history
You can view past executions, errors, and performance statistics in the Pipeline History page. To open it, open the More actions menu (☰) at the top right of the Pipelines page and select Pipeline History.
The Pipeline History page provides a complete timeline of runs with detailed execution information.
Import and export pipelines
Import and export pipelines
You can export any pipeline and import pipeline configurations through the Import and Export options. For more details, see Import and export pipelines.
Sort columns
Sort columns

You can sort the Pipelines table by selecting any column header. The table supports ascending, descending, and alphabetical sorting depending on the data in that column.
Related links
Import and Export Pipelines
Import and export pipelines in OpenObserve to move configurations across environments easily using JSON files, URLs, or direct input.
Pipeline History
Pipeline History in OpenObserve tracks every pipeline run with execution time, status, duration, retries, and error details to help monitor and debug failures.