
Integration with Cribl
Cribl Stream is a data engine designed to manage the flow of observability and security data. It allows you to route, filter, enrich, and transform data before forwarding it to your observability backend.
Overview
OpenObserve is a high-performance, open-source observability platform built for real-time log and trace analytics. By integrating Cribl with OpenObserve, you can optimize data ingestion while reducing costs and improving monitoring.
Steps to Integrate
Prerequisites
- Running Cribl Stream instance with access to the UI
- OpenObserve account (Cloud or Self-Hosted)
Step 1: Configure an Internal Source in Cribl
First configure an internal Cribl source to generate sample logs.
-
Open Cribl Stream UI → navigate to Worker Group → Routing → QuickConnect.

-
Select Sources from the left menu → Add Source.

-
Choose System → Internal as the source type, and select Cribl Internal.

-
Provide a name (e.g.,
cribl) → Save & Start.

At this point, Cribl will generate test logs.
Step 2: Configure a Webhook Destination in Cribl
-
In the Cribl UI, go to Destinations → Add Destination.Select Webhook.

-
Configure the webhook:
- Name:
OpenObserve_Webhook - Webhook URL:
http://<OPENOBSERVE_HOST>/api/<org_id>/cribl/_json - HTTP Method:
POST
- Authentication:
- Type: Basic
- Username: your OpenObserve user email
- Password: your ingestion token (both are in Data > Data sources > Other > Cribl, Base64-encoded as the Access Key)

- Name:
-
Save and activate the destination.
Step 3: Route Source Data to OpenObserve
- In Cribl, create a Route.
- Connect the Internal Source (cribl) → Webhook Destination (OpenObserve_Webhook).
- Use Passthru for a simple route, then save.

You can test the setup by sending sample logs. A success message indicates that OpenObserve received the data.

Step 4: Monitor Data in OpenObserve
-
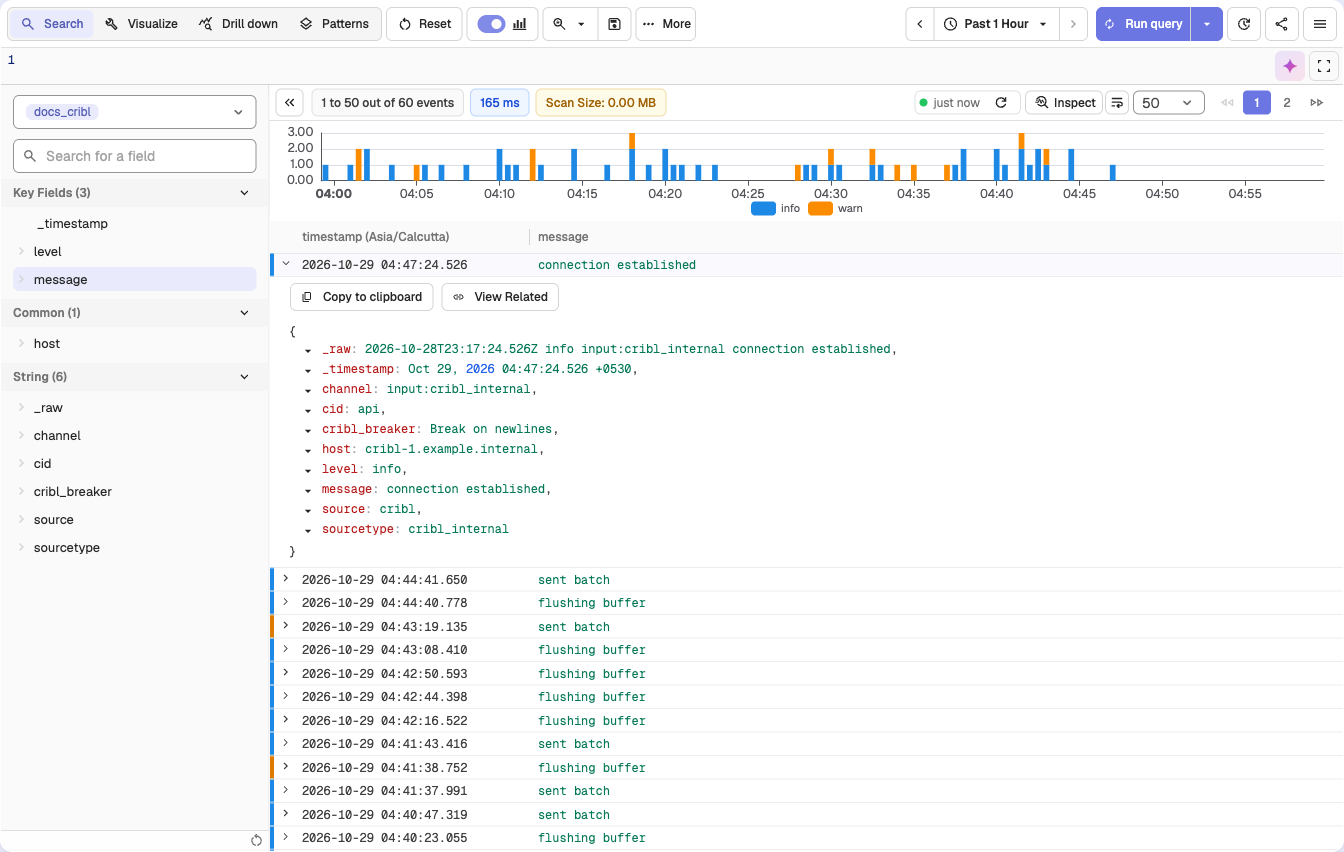
Query Logs
- Go to Logs and select the
criblstream. You should see logs ingested from Cribl.
- Go to Logs and select the
-
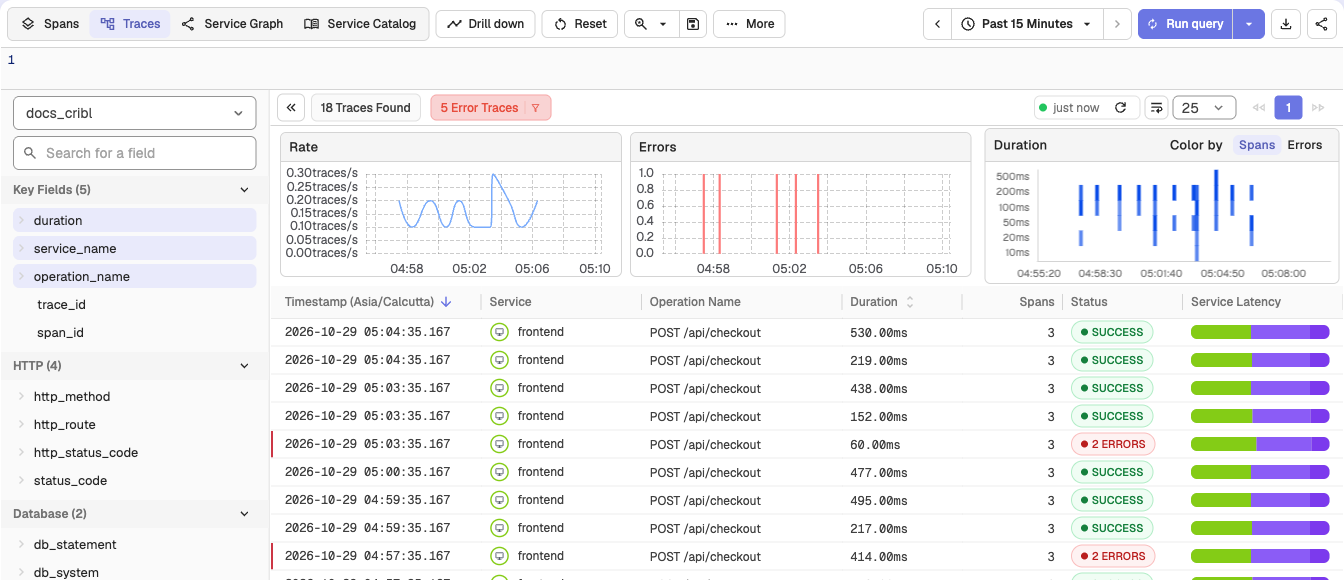
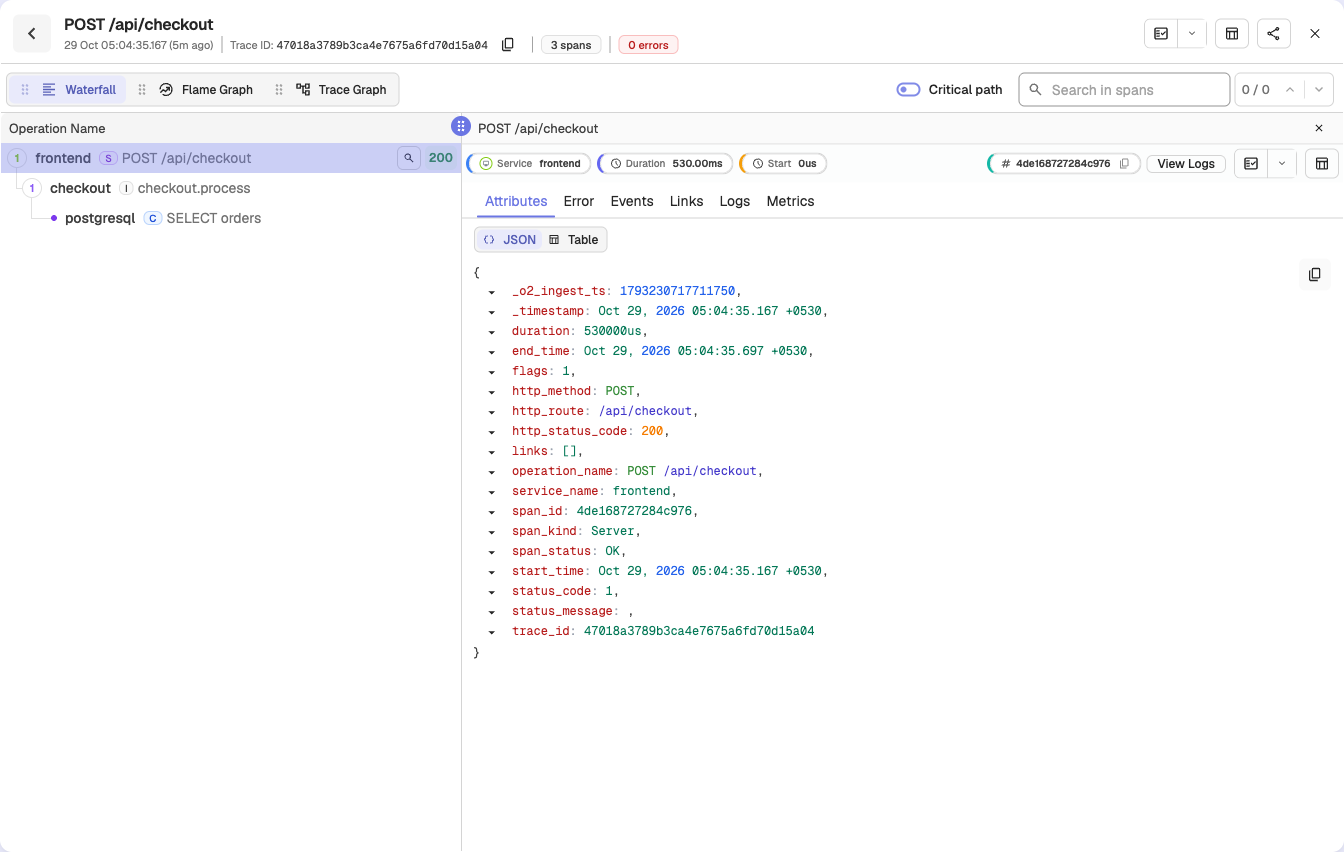
Query Traces
- If you also send traces from Cribl to an OTLP endpoint, go to Traces and select the
criblstream. The webhook above sends logs only.
- If you also send traces from Cribl to an OTLP endpoint, go to Traces and select the
Troubleshooting
No data appearing in OpenObserve
- Verify the Route in Cribl is active and connected to the Webhook destination.
- Double-check the Webhook URL format:
http://<OPENOBSERVE_HOST>/api/<org_id>/cribl/_json - Ensure the correct stream name (
cribl) is set in the URL.
Authentication failures (401 Unauthorized)
- Confirm the username (email) and password (ingestion token) are correct.
- Check if the user has ingest permissions in OpenObserve.
Connection errors / timeouts
- Make sure the OpenObserve host is reachable from Cribl.
- If using OpenObserve Cloud, ensure your firewall/VPC rules allow outbound connections.
Logs are ingested but not parsed correctly
- Confirm you’re using the
_jsonendpoint in the Webhook URL. - Check if the incoming data structure matches what OpenObserve expects (JSON payload).
Integration with Apache Airflow
Collect and monitor Apache Airflow logs and metrics with OpenTelemetry Collector and visualize them in OpenObserve.
Integrating MuleSoft AMC Logs with OpenObserve
Fetch logs from the MuleSoft Anypoint Monitoring Console and stream them into OpenObserve. Covers authentication, the AMC API, and automating the workflow.