
Prometheus Metrics - Monitoring & Observability
Prometheus is a leading open-source monitoring system for collecting and storing time-series metrics. Use Prometheus remote write to send metrics to OpenObserve for Kubernetes monitoring, infrastructure monitoring, and application performance monitoring with powerful SQL and PromQL query capabilities.
You can ingest metrics using prometheus remote write in OpenObserve.
You could use below configuration for collecting metrics
url: https://api.openobserve.ai/api/org_name/prometheus/api/v1/write
queue_config:
  max_samples_per_send: 10000
basic_auth:
  username: root@example.com
  password: password
Replace api.openobserve.ai with your self hosted OpenObserve instance if you are hosting it yourself.
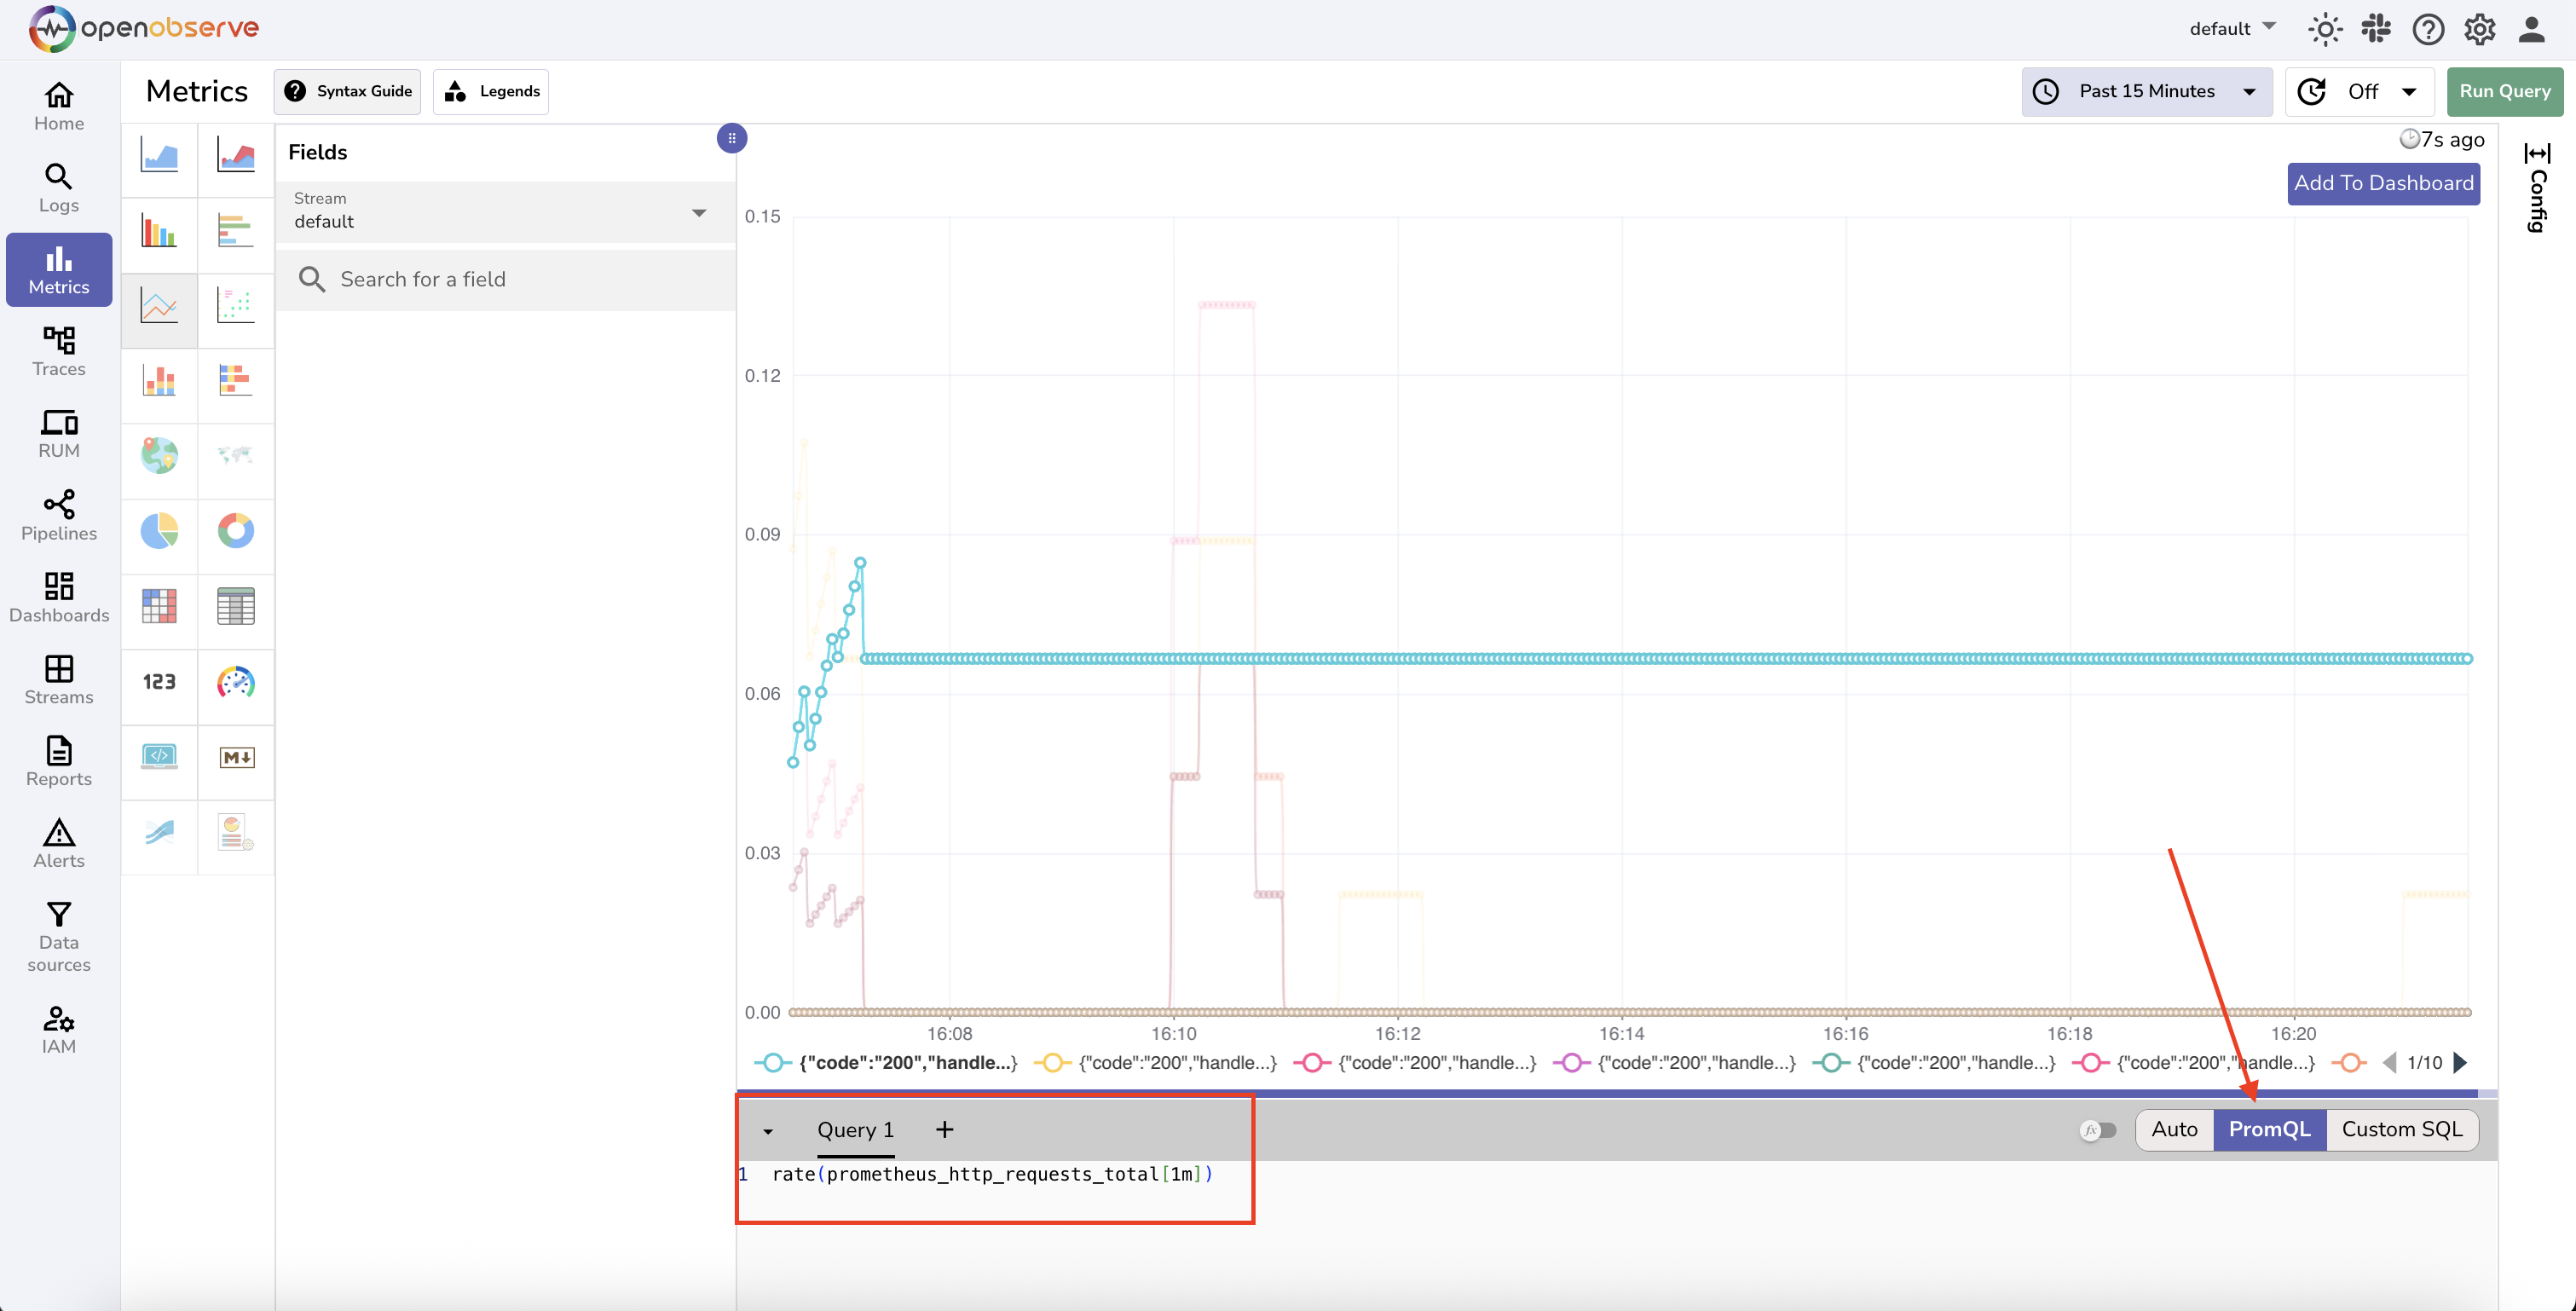
You will then be able to explore the metrics on the Metrics page and build dashboards by querying using SQL or PromQL
Was this page helpful?