

Zero-Code Traces & Metrics with OBI (eBPF)
OpenTelemetry eBPF Instrumentation (OBI) is an eBPF-based agent that automatically captures application traces and RED metrics (Rate, Errors, Duration) with no code changes and no SDK. It attaches kernel-level eBPF probes to your running processes, reconstructs web and RPC transactions at the syscall and network layer, and exports the resulting telemetry to OpenObserve over OTLP/HTTP.
Use OBI when you want application-level observability for services you cannot (or do not want to) instrument manually. It works across languages — Java (JDK 8+), .NET, Go, Python, Ruby, Node.js, C, C++, and Rust.
How it works
- eBPF, not SDKs. OBI loads eBPF programs into the kernel to observe process activity. Your application binaries are left untouched.
- Two signals from one agent. OBI emits both distributed traces and metrics for the requests it observes, and propagates trace context across services automatically.
- Encrypted traffic, no decryption. OBI observes transactions over TLS/SSL without decrypting them, so HTTPS calls are captured too.
- Direct OTLP export. OBI sends OTLP/HTTP straight to OpenObserve — no OpenTelemetry Collector is required in between (though you can still route through a Collector if you prefer).
What OBI captures
- Application protocols: HTTP/S, HTTP2, gRPC, gRPC-Web, JSON-RPC, MQTT, NATS, AMQP 1.0, and Memcached.
- Databases: PostgreSQL, MySQL, MSSQL, MongoDB, Redis, and Couchbase.
- GenAI/LLM calls: OpenAI, Anthropic (Claude), Google AI Studio (Gemini), AWS Bedrock, and MCP over JSON-RPC.
- Distributed traces: request spans with automatic context propagation across services.
- RED metrics: low-cardinality, Prometheus-compatible request Rate, Errors, and Duration histograms per service.
- Network metrics: TCP-level network flows with round-trip-time (RTT) statistics and failed-connection counts.
Prerequisites
- An OpenObserve instance (Cloud or self-hosted) and your login credentials.
- A Linux host on
amd64orarm64with kernel 5.8+ (or RHEL-family4.18+with eBPF backports) and BTF (BPF Type Format) enabled. A few advanced features, such as network-level context propagation, need kernel 5.17+. - Privileges to load eBPF programs. The simplest option is running privileged (
--privileged/securityContext.privileged: true), as shown below. OBI can also run unprivileged with only the specific Linux capabilities it needs.
Ingestion endpoints
OBI exports each signal to a per-signal OTLP/HTTP endpoint. Point traces and metrics at:
https://<your-openobserve-host>/api/<your-org>/v1/traces
https://<your-openobserve-host>/api/<your-org>/v1/metrics
For a self-hosted instance on the default port, the host is http://localhost:5080.
Include the /v1/traces and /v1/metrics path
OBI uses these per-signal endpoints verbatim — it does not auto-append /v1/traces or /v1/metrics. If you point OBI at the bare /api/<your-org> base URL, OpenObserve rejects the request with a 403. Always include the full signal path (as shown above), or set the common base URL only via OTEL_EXPORTER_OTLP_ENDPOINT, which does get the signal path appended.
Authentication and target stream
Send credentials and the destination stream as OTLP headers:
Authorization: Basic <base64(email:password)>— your OpenObserve credentials.stream-name: <stream>— the OpenObserve stream telemetry lands in (e.g.default).
Generate the Authorization value from your credentials:
echo -n 'root@example.com:Complexpass#123' | base64
# -> cm9vdEBleGFtcGxlLmNvbTpDb21wbGV4cGFzcyMxMjM=
You can also copy a ready-made endpoint and Authorization header from Data Sources → Custom → Traces (and Metrics) in the OpenObserve UI.
Deploy on Kubernetes (DaemonSet via Helm)
This is the recommended way to instrument a whole cluster. OBI runs one privileged pod per node and instruments every workload on that node.
1. Create the credentials Secret
OBI reads OTLP headers from an environment variable. Store them in a Secret as a single comma-separated string. Save as secret.yaml:
apiVersion: v1
kind: Secret
metadata:
  name: obi-openobserve
  namespace: obi
type: Opaque
stringData:
  # Comma-separated key=value pairs consumed as OTEL_EXPORTER_OTLP_HEADERS.
  #   Authorization=Basic <base64 email:password>  -> OpenObserve auth
  #   stream-name=default                           -> target OpenObserve stream
  otlp-headers: "Authorization=Basic cm9vdEBleGFtcGxlLmNvbTpDb21wbGV4cGFzcyMxMjM=,stream-name=default"
2. Create the Helm values
Save as values.yaml. These override the official OBI chart to instrument everything on the node, decorate telemetry with Kubernetes metadata, and export both signals to OpenObserve:
image:
  registry: ghcr.io
  repository: open-telemetry/opentelemetry-ebpf-instrumentation/ebpf-instrument
  tag: "v0.9.0"
  pullPolicy: IfNotPresent

# RBAC + ServiceAccount for Kubernetes metadata decoration.
serviceAccount:
  create: true
rbac:
  create: true

# eBPF probe installation needs elevated privileges.
securityContext:
  privileged: true

# OBI export config (rendered into the chart's ConfigMap).
config:
  create: true
  data:
    otel_traces_export:
      endpoint: https://<your-openobserve-host>/api/<your-org>/v1/traces
      protocol: http/protobuf
      instrumentations:
        - "*"
    otel_metrics_export:
      endpoint: https://<your-openobserve-host>/api/<your-org>/v1/metrics
      protocol: http/protobuf
      instrumentations:
        - "*"

# Instrument every executable + decorate with Kubernetes metadata.
env:
  OTEL_EBPF_AUTO_TARGET_EXE: "*"
  OTEL_EBPF_KUBE_METADATA_ENABLE: "true"
  # Stamp telemetry with k8s.cluster.name (not auto-discoverable on EKS).
  OTEL_EBPF_KUBE_CLUSTER_NAME: "my-cluster"

# Mount the node's BPF filesystem so OBI can pin maps under /sys/fs/bpf.
# Without this, log enricher + profile correlation are silently disabled.
volumes:
  - name: bpffs
    hostPath:
      path: /sys/fs/bpf
      type: Directory
volumeMounts:
  - name: bpffs
    mountPath: /sys/fs/bpf
    mountPropagation: Bidirectional

# OpenObserve auth + stream-name headers, sourced from the Secret above.
envValueFrom:
  OTEL_EXPORTER_OTLP_HEADERS:
    secretKeyRef:
      name: obi-openobserve
      key: otlp-headers

# Run on every node, including tainted/control-plane nodes.
tolerations:
  - effect: NoSchedule
    operator: Exists
  - effect: NoExecute
    operator: Exists
3. Install
helm repo add open-telemetry https://open-telemetry.github.io/opentelemetry-helm-charts
helm repo update

# Namespace + credential Secret must exist before the release references it.
kubectl create namespace obi --dry-run=client -o yaml | kubectl apply -f -
kubectl apply -f secret.yaml

helm upgrade --install obi -n obi \
  open-telemetry/opentelemetry-ebpf-instrumentation \
  -f values.yaml

# Validate without applying:
helm upgrade --install obi -n obi \
  open-telemetry/opentelemetry-ebpf-instrumentation \
  -f values.yaml --dry-run
Check the agent is running on every node:
Deploy on a single host (Docker)
To instrument workloads on one machine, run OBI as a privileged container that shares the host PID namespace (--pid=host) so it can see the target processes. This example instruments the service listening on port 8443 and exports both signals to OpenObserve:
docker run --rm --privileged --pid=host \
  -v /sys/fs/bpf:/sys/fs/bpf:rw \
  -e OTEL_EBPF_OPEN_PORT="8443" \
  -e OTEL_EXPORTER_OTLP_TRACES_ENDPOINT="https://<your-openobserve-host>/api/<your-org>/v1/traces" \
  -e OTEL_EXPORTER_OTLP_METRICS_ENDPOINT="https://<your-openobserve-host>/api/<your-org>/v1/metrics" \
  -e OTEL_EXPORTER_OTLP_PROTOCOL="http/protobuf" \
  -e OTEL_EXPORTER_OTLP_HEADERS="Authorization=Basic cm9vdEBleGFtcGxlLmNvbTpDb21wbGV4cGFzcyMxMjM=,stream-name=default" \
  ghcr.io/open-telemetry/opentelemetry-ebpf-instrumentation/ebpf-instrument:v0.9.0
The image is also published to Docker Hub as otel/ebpf-instrument:v0.9.0, but pulling from ghcr.io (as above) avoids Docker Hub's anonymous pull rate limits, which can intermittently break deployments.
Choose which processes to instrument with one of these (they can be combined):
OTEL_EBPF_OPEN_PORT— match by listening port, e.g.8443or a range like8000-8999.OTEL_EBPF_AUTO_TARGET_EXE— match by executable path, e.g./opt/app/server; use*to instrument everything.
To sanity-check locally before wiring up OpenObserve, add -e OTEL_EBPF_TRACE_PRINTER=text to print captured spans to the container logs.
Configuration reference
| Setting | Where | Purpose |
|---|---|---|
otel_traces_export.endpoint / OTEL_EXPORTER_OTLP_TRACES_ENDPOINT |
config / env | Full OTLP/HTTP traces URL, including /v1/traces. |
otel_metrics_export.endpoint / OTEL_EXPORTER_OTLP_METRICS_ENDPOINT |
config / env | Full OTLP/HTTP metrics URL, including /v1/metrics. |
protocol / OTEL_EXPORTER_OTLP_PROTOCOL |
config / env | Export encoding — use http/protobuf for OpenObserve. |
instrumentations: ["*"] |
config | Which instrumentations to enable (* = all). |
OTEL_EXPORTER_OTLP_HEADERS |
env | Comma-separated headers: Authorization=Basic <base64>,stream-name=<stream>. |
OTEL_EBPF_AUTO_TARGET_EXE |
env | Executable path/pattern to instrument (* = all). |
OTEL_EBPF_OPEN_PORT |
env | Instrument the process listening on this port or range (e.g. 8443, 8000-8999). |
OTEL_EBPF_KUBE_METADATA_ENABLE |
env | Decorate telemetry with Kubernetes pod/namespace metadata. |
OTEL_EBPF_KUBE_CLUSTER_NAME |
env | Stamp telemetry with k8s.cluster.name (set explicitly on EKS). |
Environment variables take priority over the YAML config file. See the full OBI configuration reference for every available option.
Required privileges
Running privileged (as in the examples above) is the quickest path. For least-privilege deployments, OBI can instead be granted only the specific Linux capabilities its enabled features need:
| Capability | Purpose |
|---|---|
CAP_BPF |
Load eBPF programs and maps (always required). |
CAP_PERFMON |
Trace context propagation, application observability, network flow monitoring. |
CAP_DAC_READ_SEARCH |
Read /proc/self/mem to detect kernel version and features. |
CAP_CHECKPOINT_RESTORE |
Resolve /proc symlinks for process/system info. |
CAP_SYS_PTRACE |
Read /proc/<pid>/exe and modules for symbol scanning. |
CAP_NET_RAW |
Create AF_PACKET raw sockets for network flow capture. |
CAP_NET_ADMIN |
Load TC (traffic control) programs; required for network-level context propagation. |
CAP_SYS_ADMIN |
Library-level Go trace-context propagation via bpf_probe_write_user(). |
CAP_SYS_RESOURCE |
Raise locked-memory limits (kernels < 5.11 only). |
See the OBI security and permissions guide for the exact capability set per feature.
Limitations
OBI complements, but does not replace, SDK-based instrumentation. Because it observes from eBPF probes rather than inside your code, it cannot emit custom spans, application-specific attributes, or business events. For that level of detail, combine OBI with the OpenTelemetry SDKs for the services that need it.
Verify in OpenObserve
Generate some traffic to your instrumented services, then:
- Open Traces in OpenObserve and filter by your service name to see captured spans.
- Open Metrics to explore the RED metrics OBI emits (request rate, error rate, and duration histograms) for the same services.
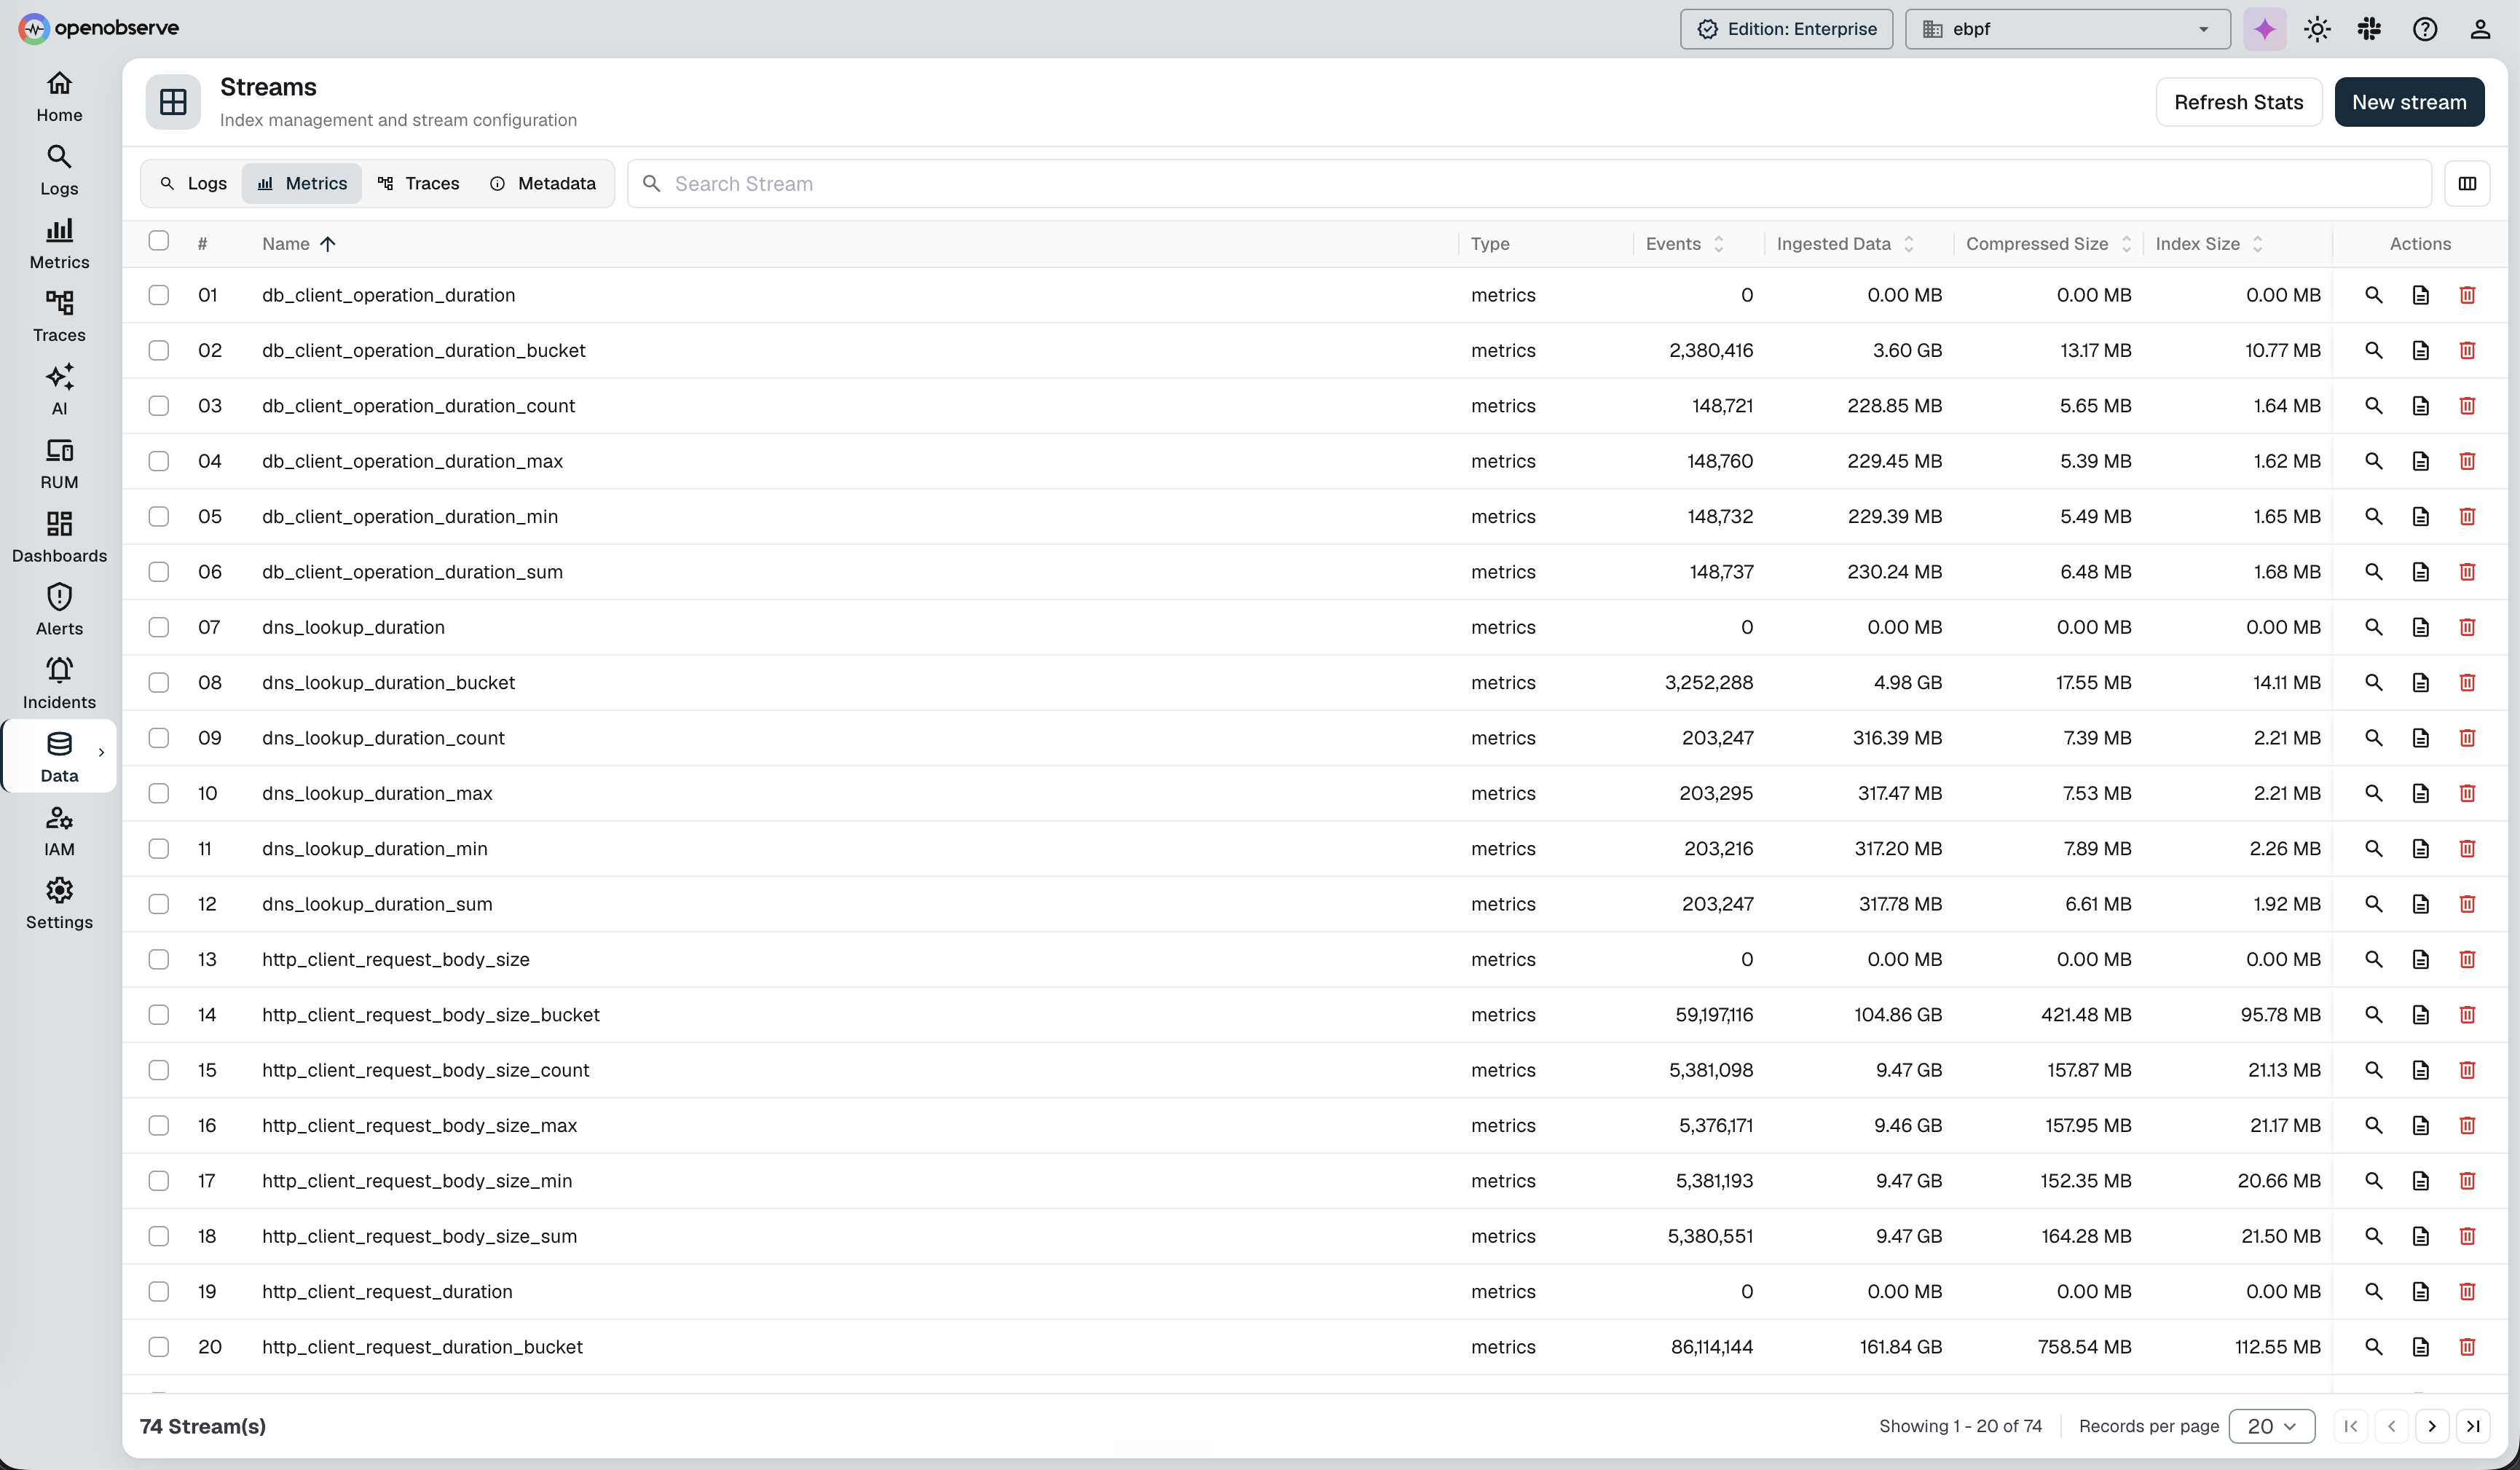
You can see the metric streams OBI creates under Data → Streams → Metrics — for example http_client_request_duration, db_client_operation_duration, and dns_lookup_duration, each with its histogram _bucket, _count, _sum, _min, and _max series:
If nothing appears, check kubectl -n obi logs ds/obi (or the Docker container logs) for auth or endpoint errors, and confirm the endpoints include the /v1/traces and /v1/metrics paths.
Notes and troubleshooting
403on ingest: the endpoint is missing the/v1/tracesor/v1/metricspath, or theAuthorization/stream-nameheaders are wrong. See the warning above.- No permissions to load eBPF: OBI needs privileges to load eBPF programs — run it privileged (
securityContext.privileged: trueon Kubernetes,--privilegedunder Docker) or grant the specific Linux capabilities it needs (at minimumCAP_BPF). - Missing BPF filesystem mount: without
/sys/fs/bpfmounted (Bidirectional propagation), OBI's log enricher and profile correlation are silently disabled. - Runtime image vs. build toolchain: deploy
ebpf-instrument(the runtime agent).obi-generatoris OBI's eBPF build toolchain, not the runtime agent.
Next steps
- OpenTelemetry Collector / OTLP: route logs, metrics, and traces through a Collector.
- Distributed tracing overview: all trace ingestion paths, including SDK-based instrumentation.
- Metrics ingestion: Prometheus, OTLP, and Telegraf.
- OBI documentation: upstream setup, configuration, and feature reference.
Need some help?
- Join our Community Slack
- Or Contact support