
Aerospike Integration with OpenObserve
This guide provides step-by-step instructions to collect and monitor Aerospike metrics using OpenTelemetry Collector and forward them to OpenObserve.
Overview
Aerospike is a high-performance, distributed database designed for low-latency, real-time data processing. By integrating Aerospike with OpenTelemetry and OpenObserve, you can:
- Detect performance bottlenecks
- Gain insights into resource usage
- Monitor database health and metrics in real time
Steps to Integrate
Prerequisites
- Running Aerospike instance(s)
- OpenObserve account (Cloud or Self-Hosted)
Step 1: Install OpenTelemetry Collector Contrib
Download and install the latest release of otelcol-contrib:
curl --proto '=https' --tlsv1.2 -fOL https://github.com/open-telemetry/opentelemetry-collector-releases/releases/download/v0.115.1/otelcol-contrib_0.115.1_darwin_arm64.tar.gz
tar -xvf otelcol-contrib_0.115.1_darwin_arm64.tar.gz
sudo mv otelcol-contrib /usr/local/bin/
otelcol-contrib --version
Replace
v0.115.1with the latest version for your OS/architecture.
Step 2: Configure the Collector
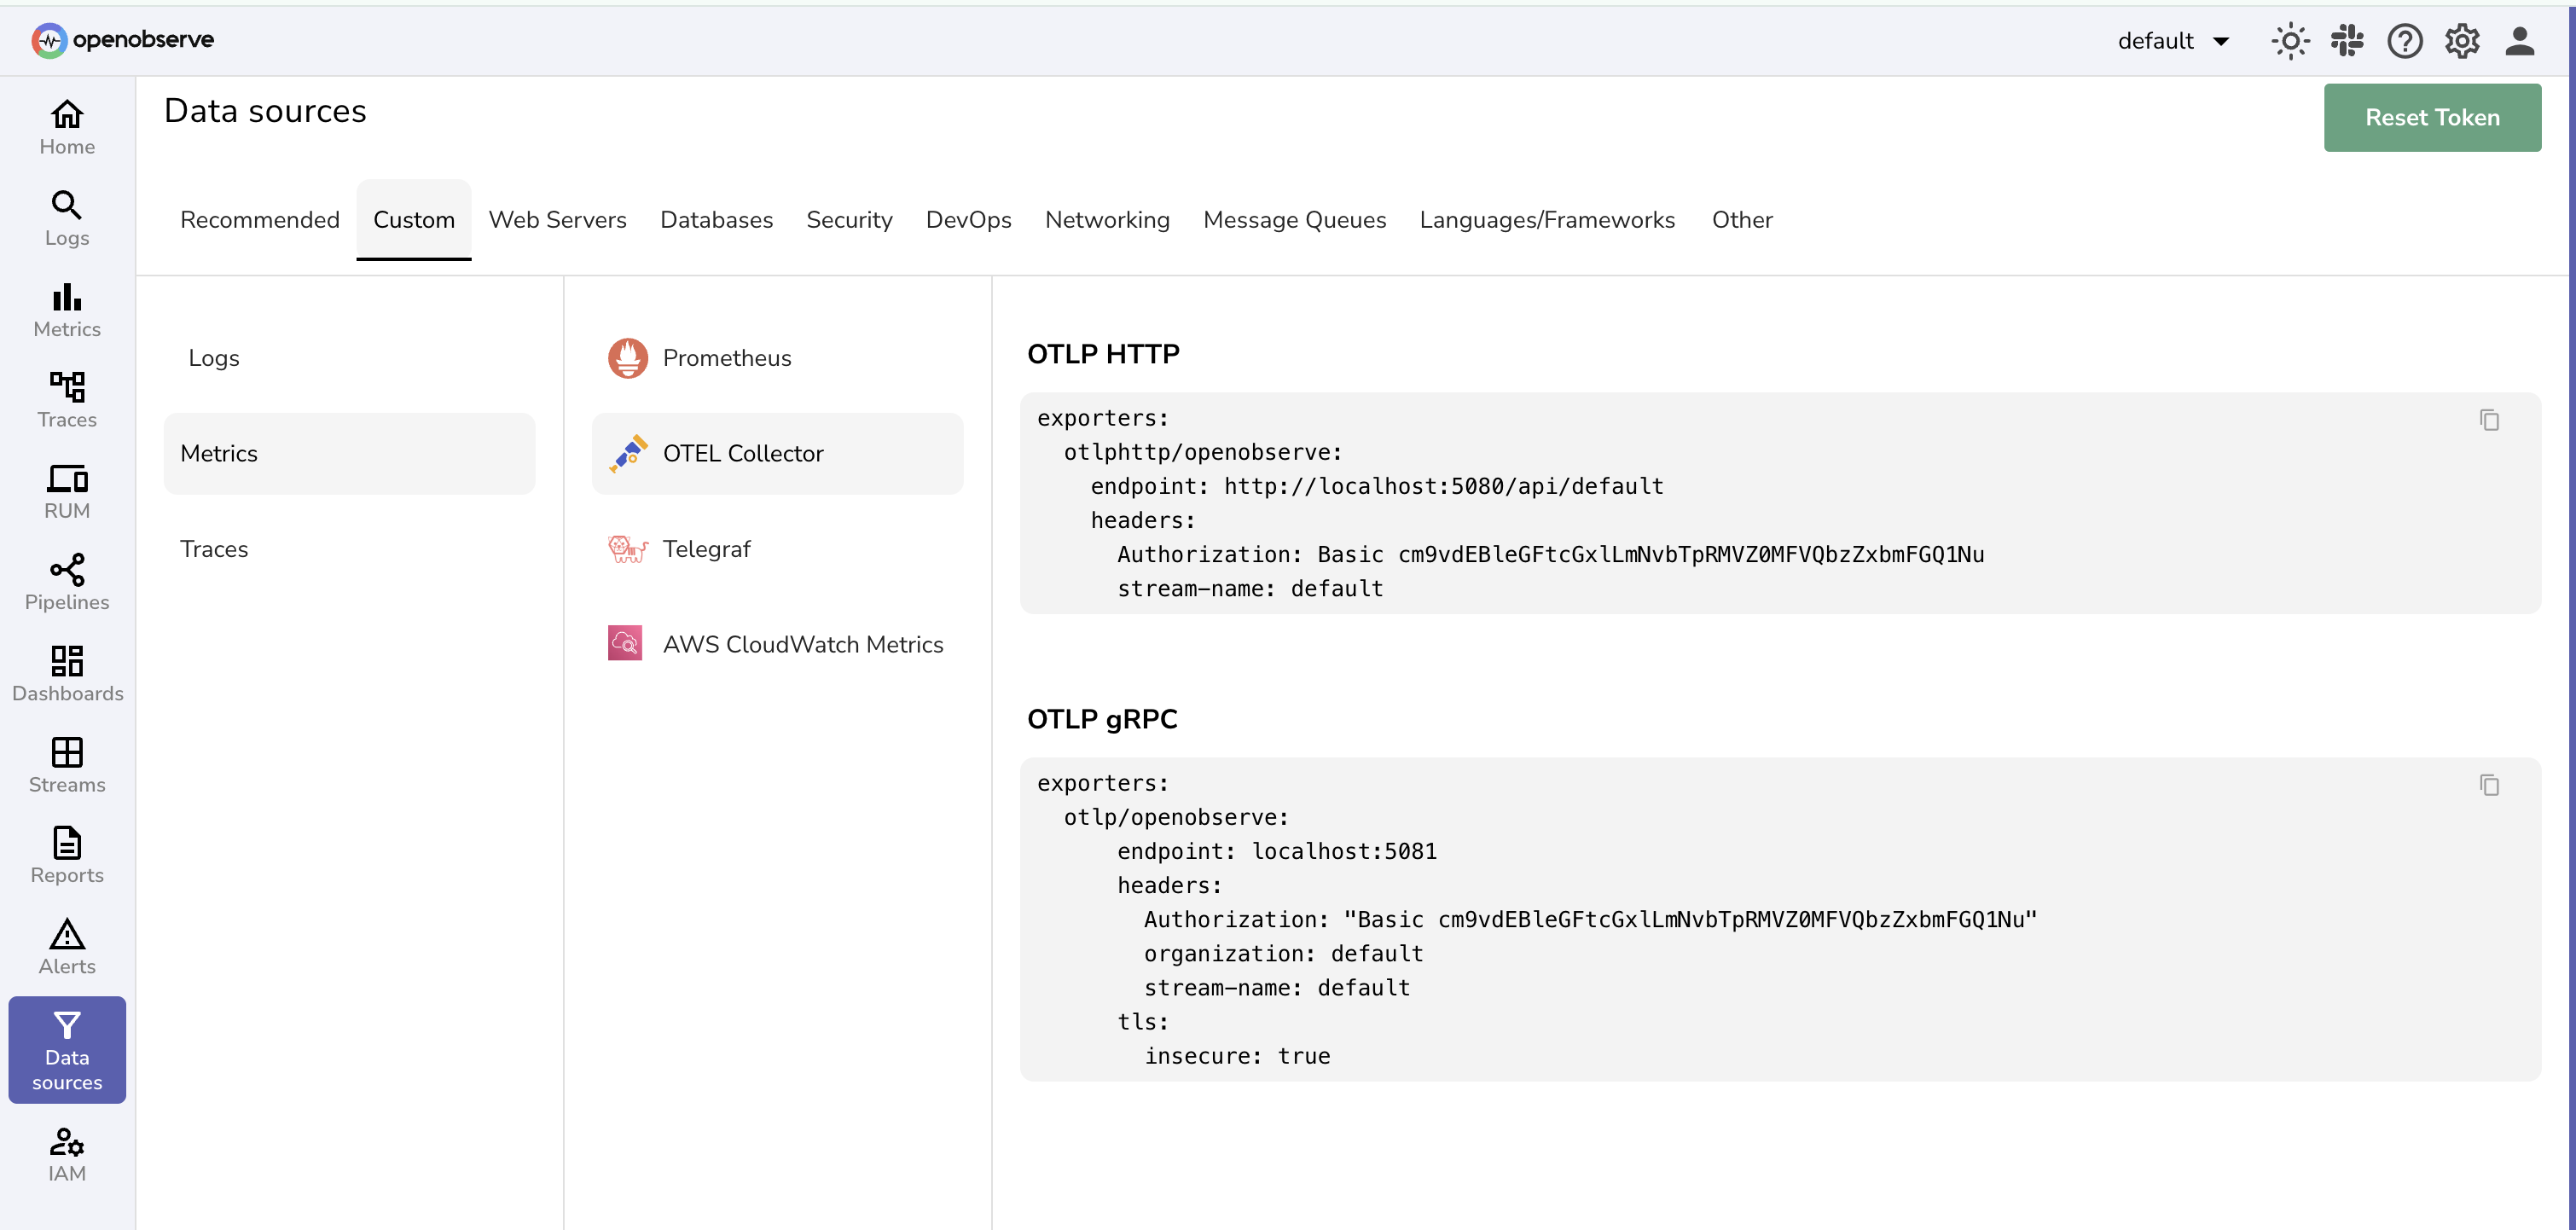
Create a file named config.yaml with the following configuration:
receivers:
  aerospike:
    endpoint: "localhost:3000"

processors:
  batch:
    send_batch_size: 10000
    send_batch_max_size: 11000
    timeout: 10s

exporters:
  otlphttp/openobserve:
    endpoint: https://<your-openobserve-endpoint>/api/default
    headers:
      Authorization: Basic <your_auth_token>
      stream-name: default

service:
  pipelines:
    metrics:
      receivers: [aerospike]
      processors: [batch]
      exporters: [otlphttp/openobserve]
Replace <your-openobserve-endpoint> and <your_auth_token> with your OpenObserve details.
Step 3: Run the Collector
Start the Collector with your configuration:
otelcol-contrib --config /path/to/config.yaml
Step 4: Visualize in OpenObserve
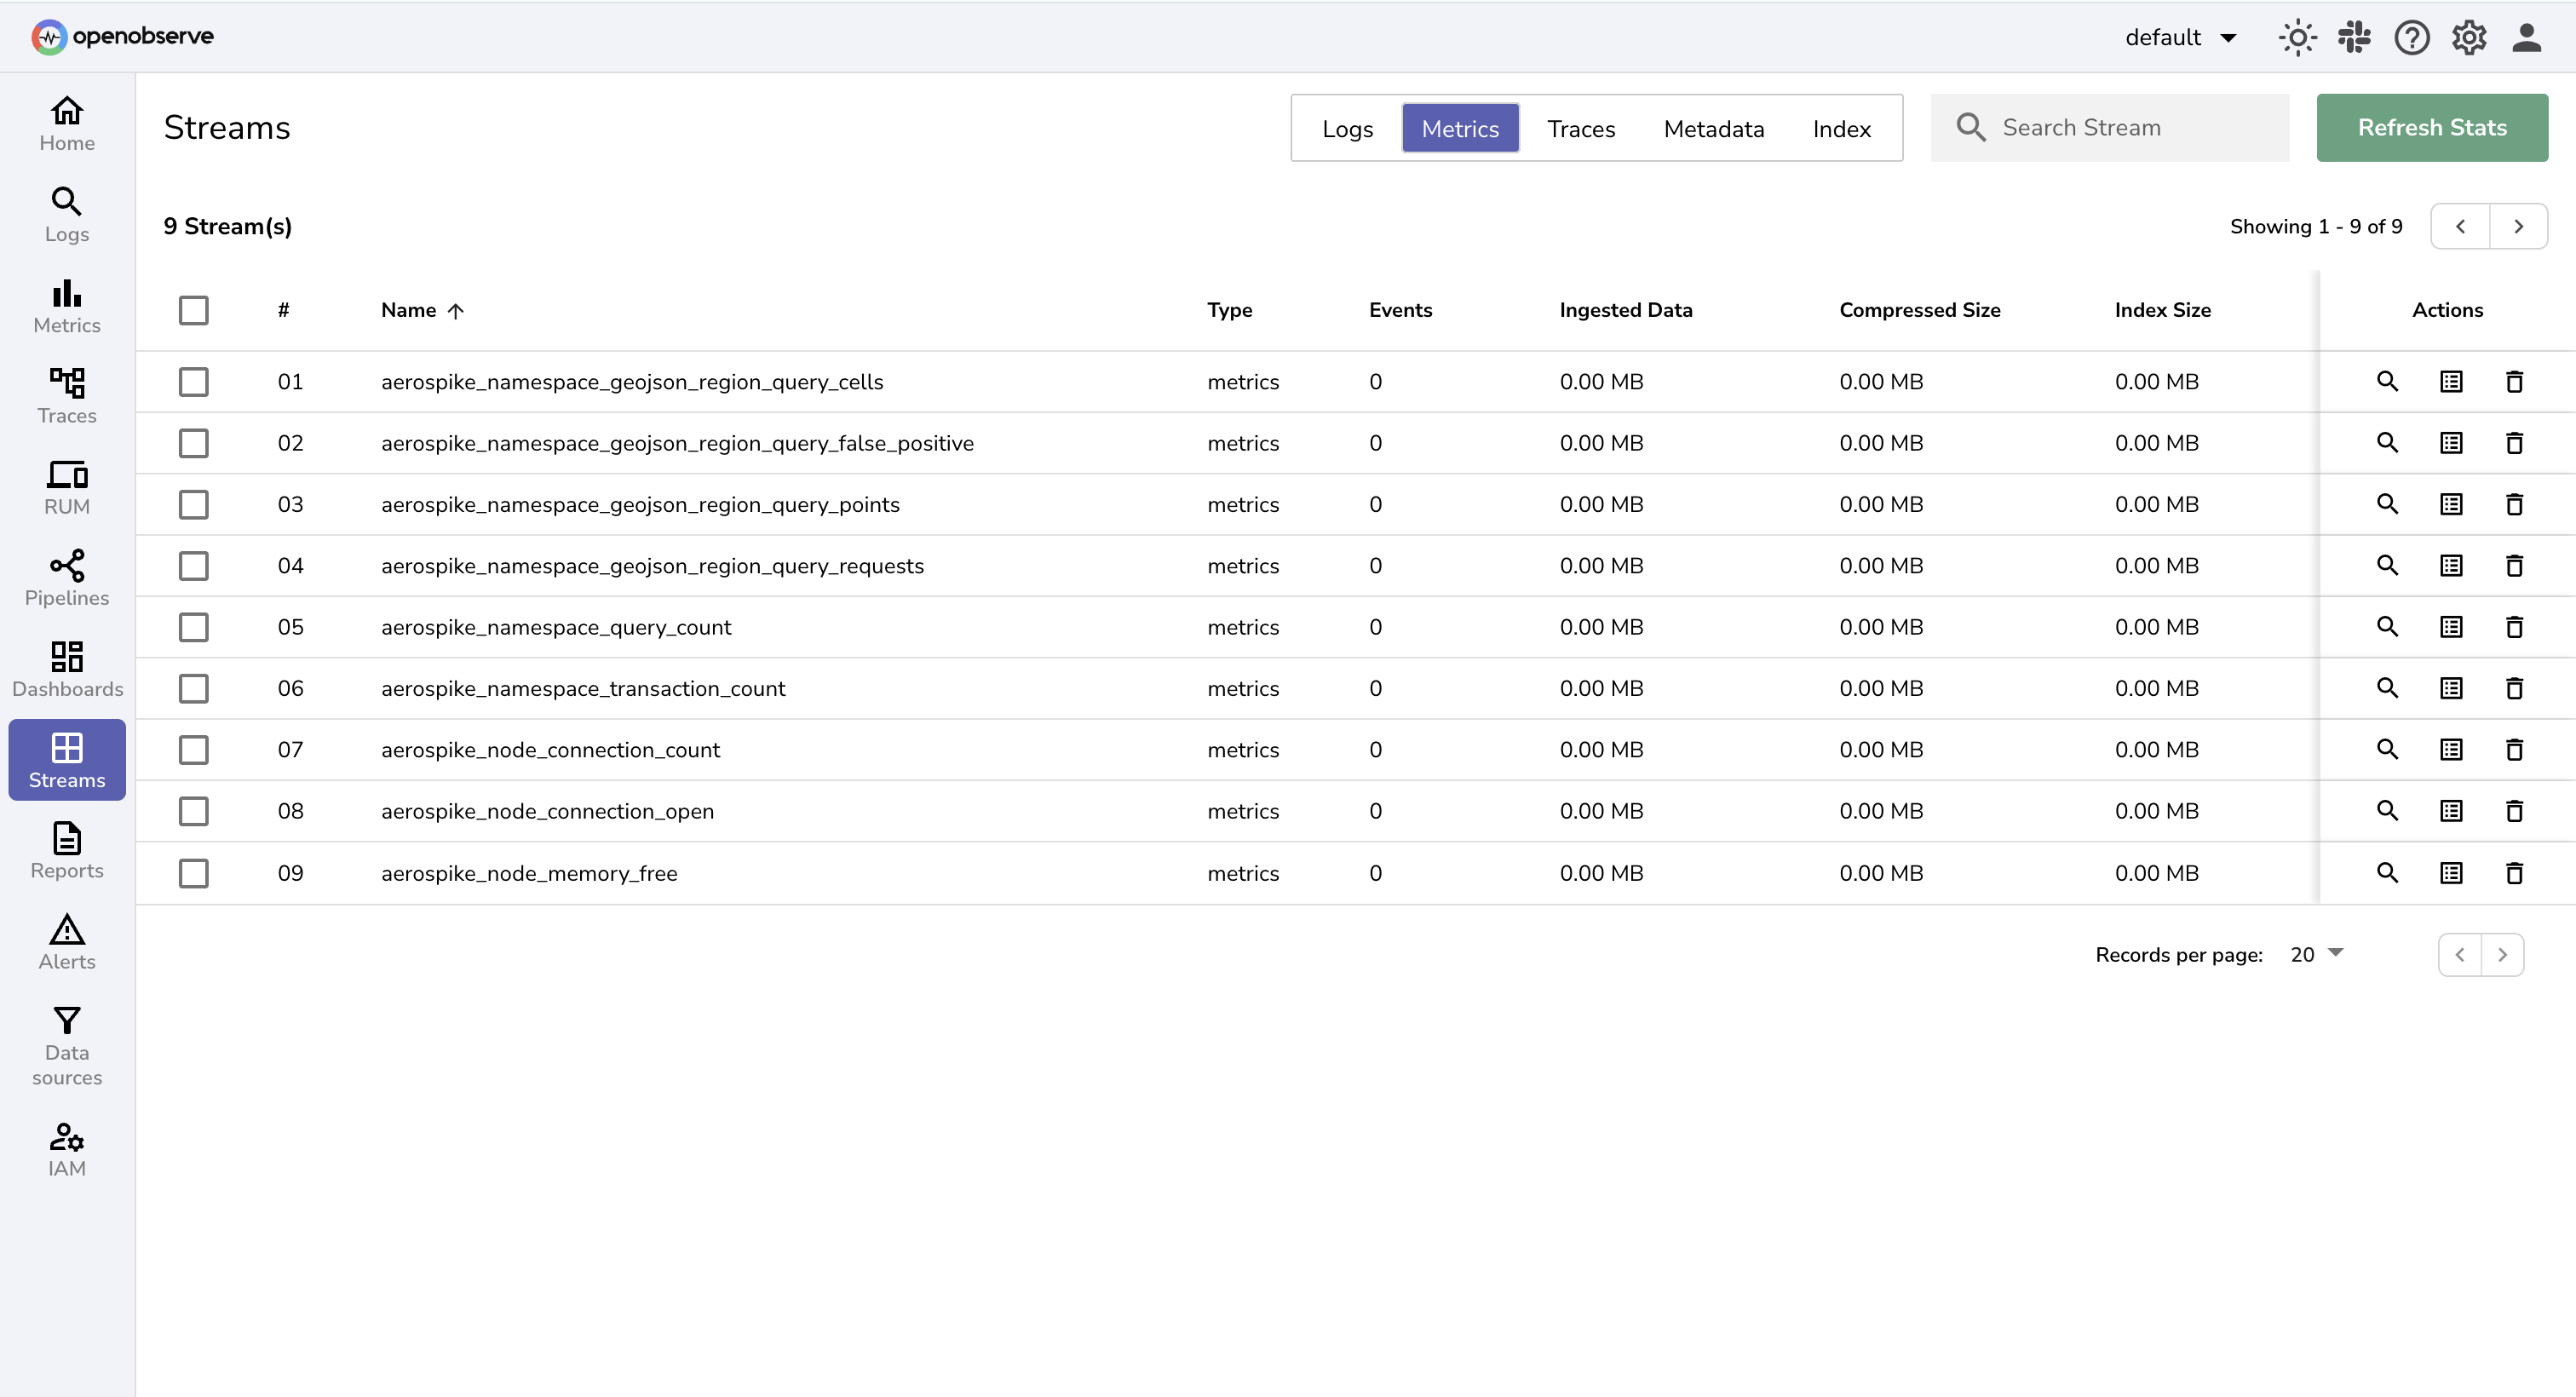
- Open OpenObserve → Streams and select your metrics stream.
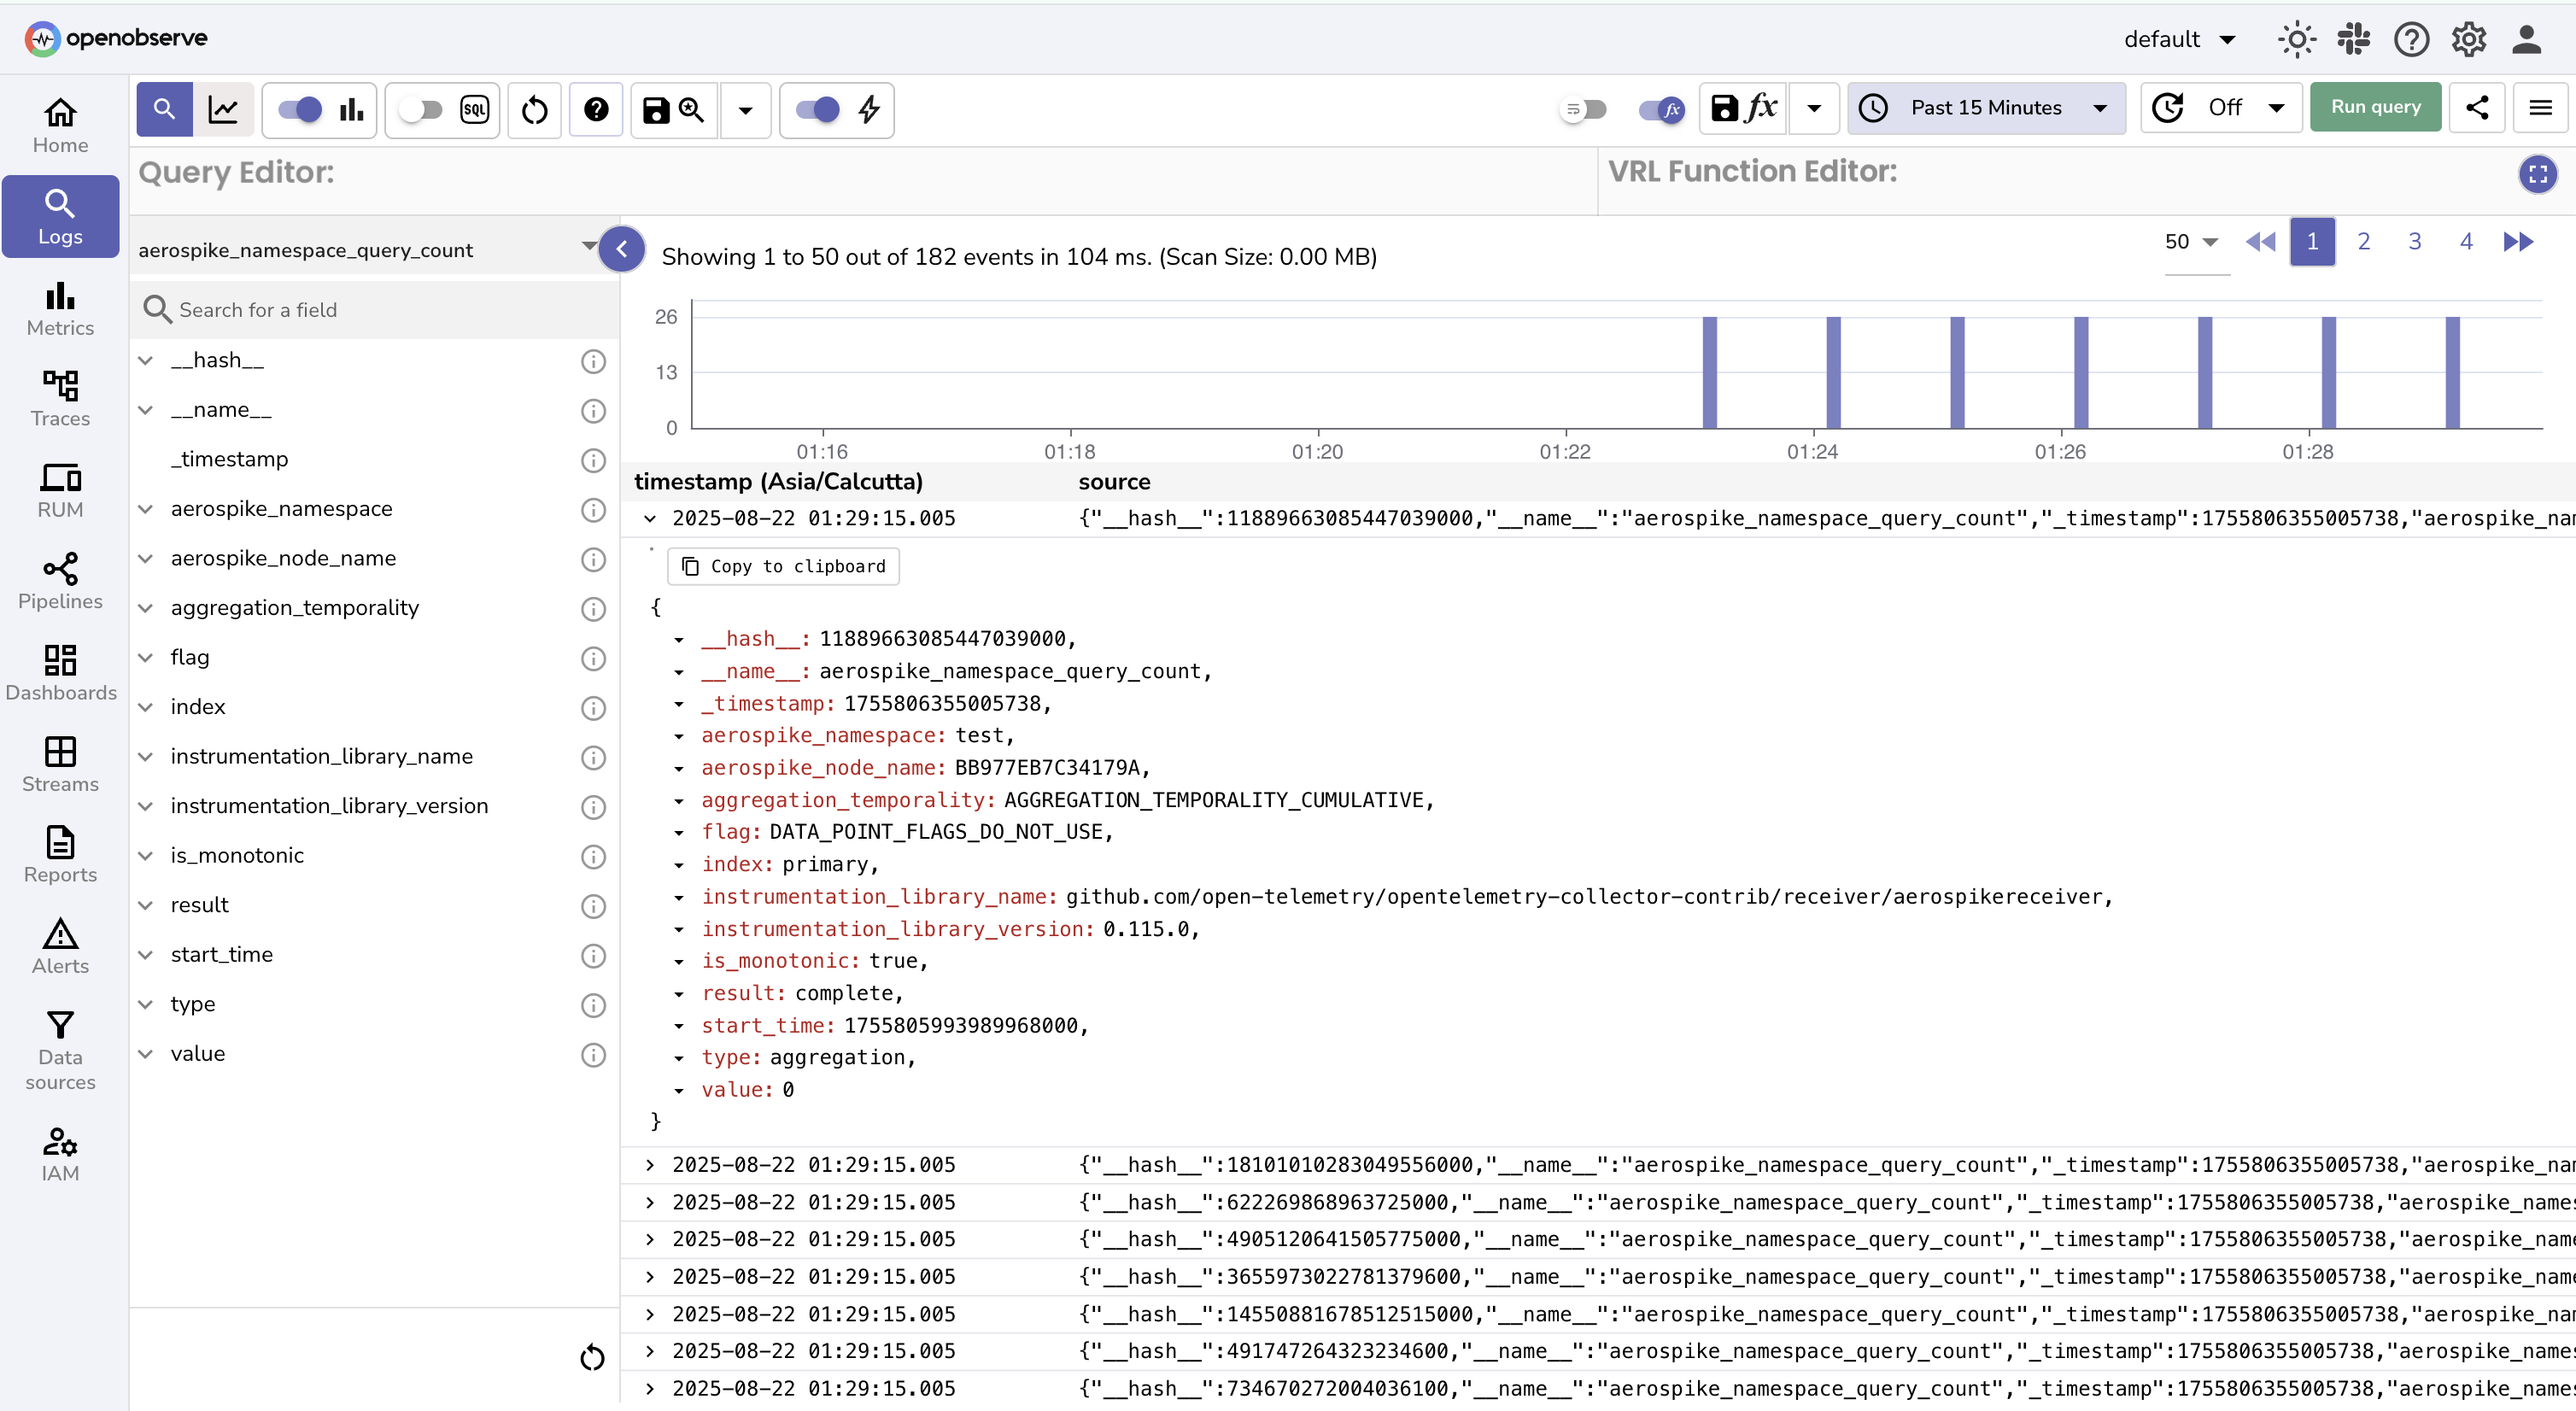
- Explore the metrics, run queries , create dashboards for insights
Troubleshooting
Collector not starting
- Check the logs for misconfigurations:
No metrics in OpenObserve
- Verify Aerospike is running: systemctl status aerospike
- Check if the Aerospike receiver is binding to the correct port (default: 3000).
- Confirm your OPENOBSERVE_TOKEN and OPENOBSERVE_STREAM are correct.
Last updated on
Cassandra
Monitor Apache Cassandra by collecting metrics with the OpenTelemetry JMX receiver and logs from files, then forwarding both to OpenObserve.
DevOps Integrations Overview
DevOps monitoring integrations for CI/CD pipelines, Jenkins, Terraform, GitHub Actions, and Ansible automation with OpenObserve.