
NGINX Monitoring - Web Server Log Analysis & Performance Monitoring
Monitor NGINX web server with comprehensive NGINX monitoring for collecting NGINX access logs, error logs, and web server performance data. This guide walks you through setting up real-time NGINX log monitoring using Fluent Bit for NGINX log analysis, web server monitoring, and HTTP request tracking.
Overview
NGINX web server monitoring requires structured log collection for effective log analytics. By default, NGINX logs in a custom format that isn't optimal for web server log analysis. This guide helps you convert NGINX logs into structured JSON format for NGINX access log analysis, error monitoring, and web server performance tracking using Fluent Bit.
Steps to Integrate
Prerequisites
- NGINX installed and running
- OpenObserve account (Cloud or Self-Hosted)
Step 1: Configure NGINX to Emit JSON Logs
- Open your NGINX configuration file:
sudo vi /etc/nginx/nginx.confOn macOS:
/opt/homebrew/etc/nginx/nginx.conf
- Add the following
log_formatinside thehttpblock:
log_format json_combined escape=json '{"@timestamp":"$time_iso8601",'
'"remote_addr":"$remote_addr",'
'"request":"$request",'
'"status":"$status",'
'"body_bytes_sent":"$body_bytes_sent",'
'"http_referer":"$http_referer",'
'"http_user_agent":"$http_user_agent"}';

access_log /var/log/nginx/access.log json_combined;
Adjust the path if needed (e.g.,
/opt/homebrew/var/log/nginx/access.logon macOS)
- Restart or reload NGINX:
sudo systemctl reload nginx
# or
sudo nginx -s reload
Step 2: Install Fluent Bit
- Install Fluent Bit:
# Ubuntu/Debian
curl https://raw.githubusercontent.com/fluent/fluent-bit/master/install.sh | sh

# macOS
brew install fluent-bit- Verify installation:
fluent-bit --versionStep 3: Configure Fluent Bit for NGINX Logs
- Create a config file:
vi nginx-fluent-bit.conf- Paste the configuration below:
[INPUT]
    Name tail
    Path /var/log/nginx/access.log
    Tag nginx-access
    DB /var/log/fluent-bit-nginx-access.db
    Mem_Buf_Limit 5MB
    Skip_Long_Lines On

[OUTPUT]
    Name http
    Match *
    Host localhost
    Port 5080
    URI /api/default/default/_json
    Format json
    Json_date_key    _timestamp
    Json_date_format iso8601
    HTTP_User <YOUR_USERNAME>
    HTTP_Passwd <YOUR_PASSWORD>
    tls Off
    compress gzip
- Adjust the access log path if you're using macOS (`/opt/homebrew/var/...`)
- Replace `<YOUR_PASSWORD>` with your OpenObserve password.
Step 4: Start Fluent Bit
- Run Fluent Bit with your config:
fluent-bit -c nginx-fluent-bit.conf2. Optionally, run in verbose mode for debugging:
fluent-bit -c nginx-fluent-bit.conf -vvStep 5: Verify Logs in Openobserve
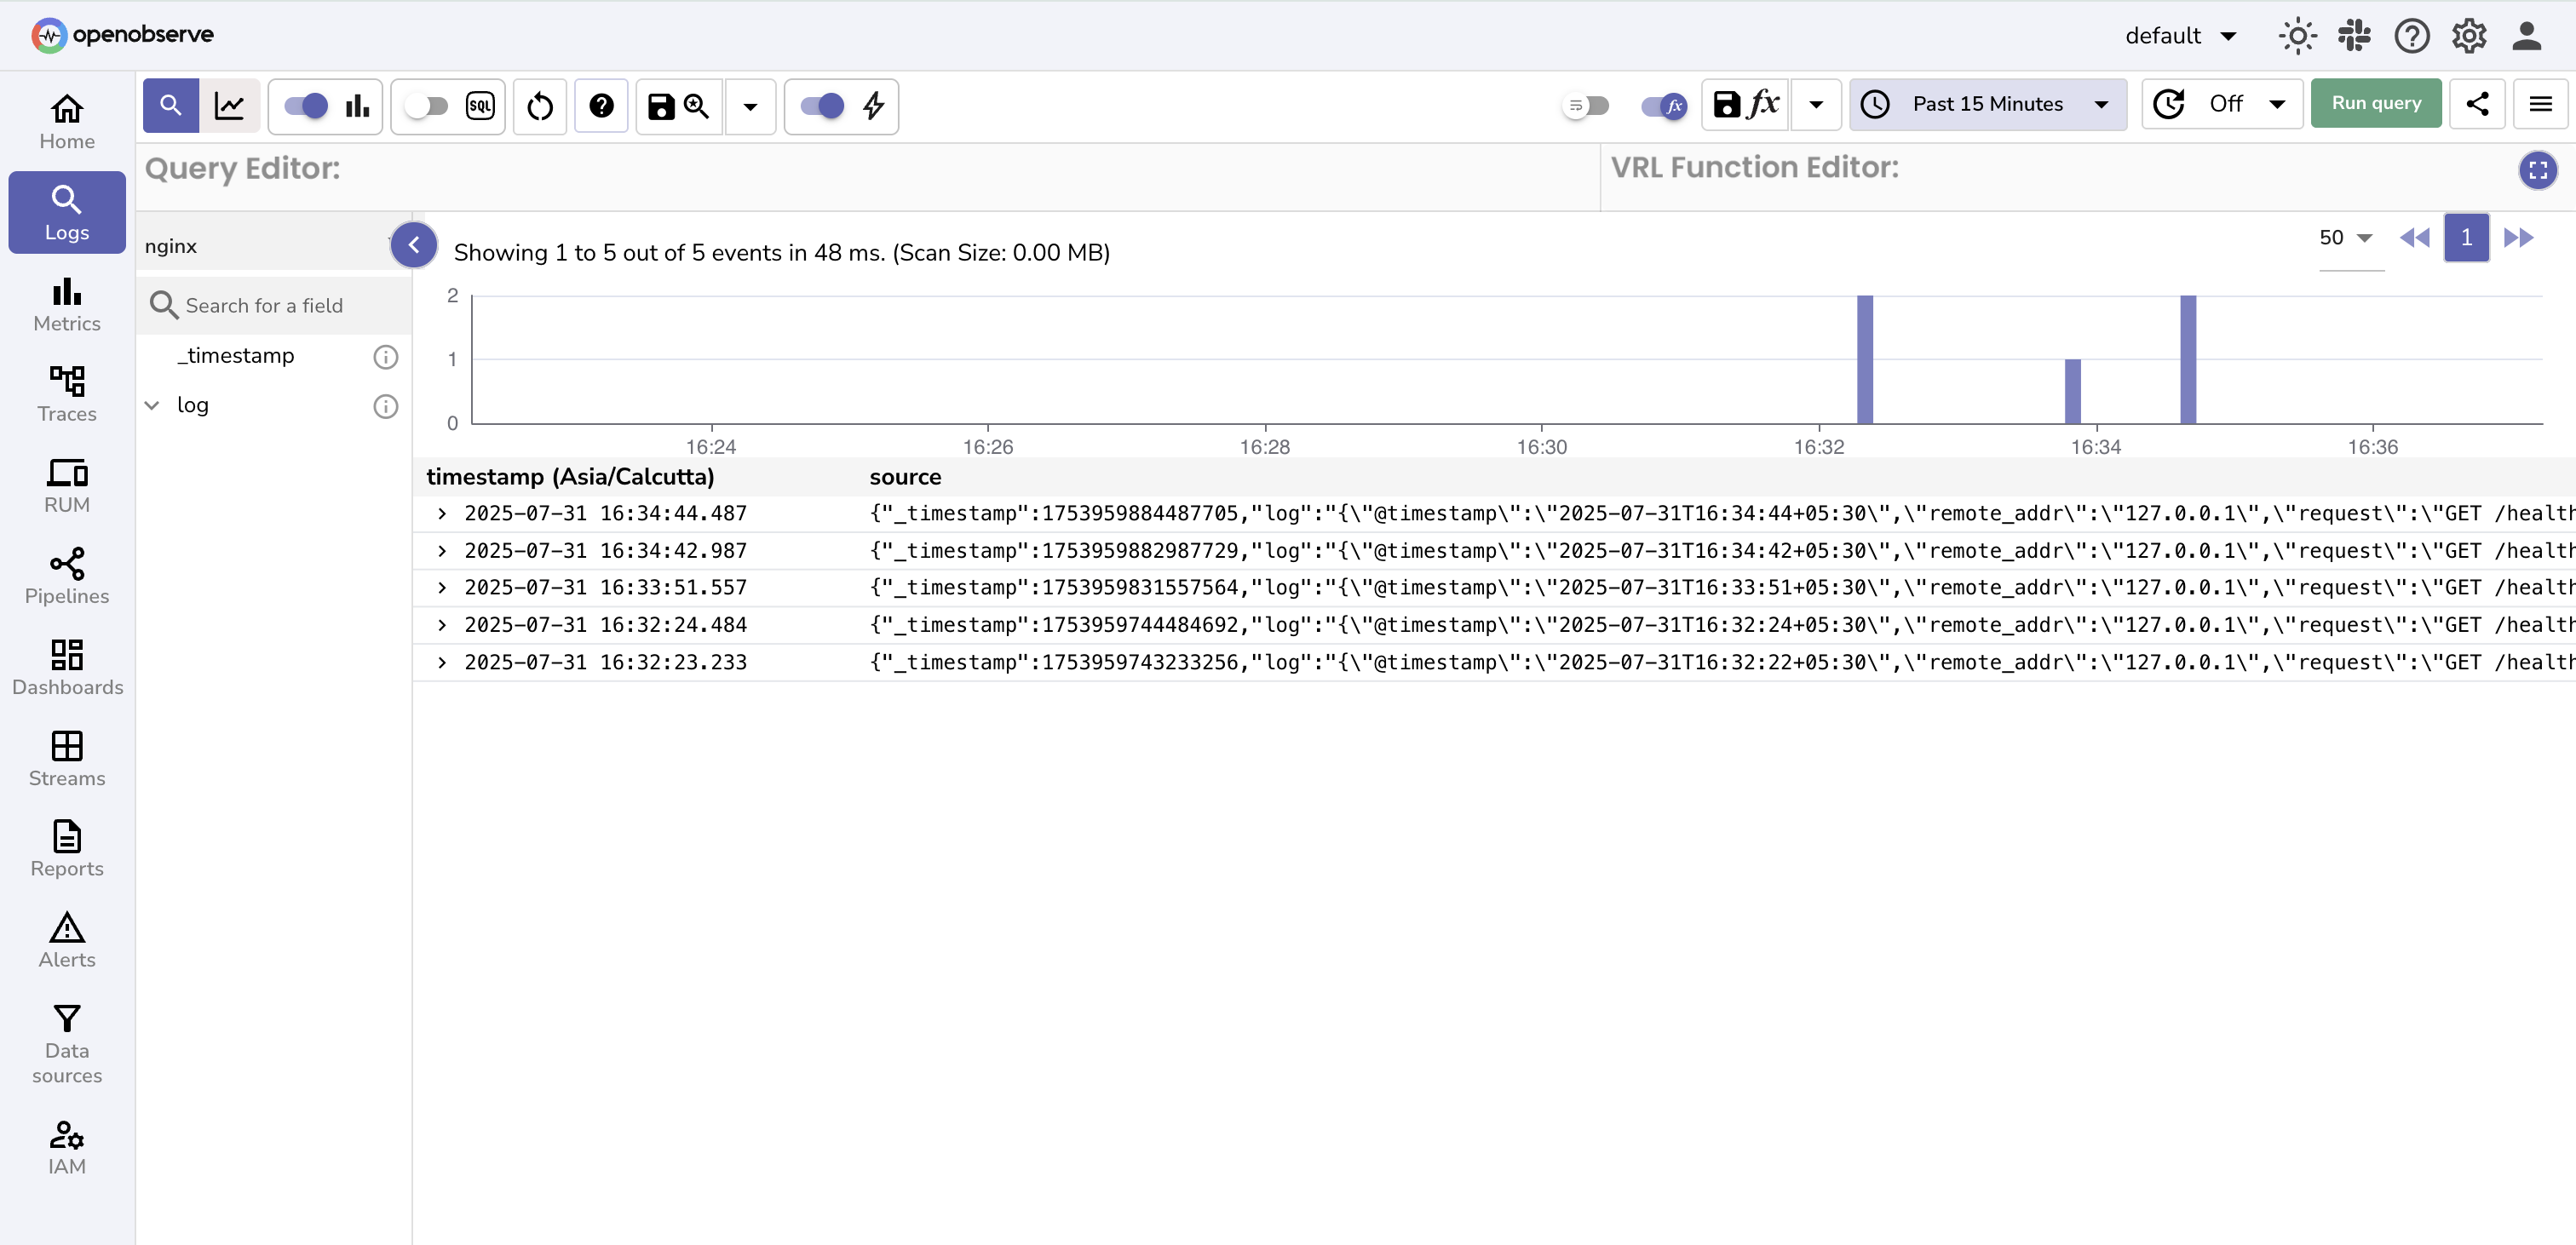
- In your Openobserve instance, Go to Logs → select your log stream → Set time range → Click Run Query
- You should see logs in JSON format, like:
{
  "_timestamp": 1729109276178847,
  "log": {
    "@timestamp": "2024-10-16T15:07:55-05:00",
    "remote_addr": "127.0.0.1",
    "request": "GET / HTTP/1.1",
    "status": "200",
    "body_bytes_sent": "615",
    "http_referer": "",
    "http_user_agent": "curl/8.7.1"
  }
}
Troubleshooting
No logs appearing in OpenObserve?
- Check Fluent Bit is running and not erroring:
fluent-bit -c nginx-fluent-bit.conf -vv - Validate HTTP output settings (host, user, password, URI)
- Confirm the log path exists and is readable
NGINX access log not updating?
- Tail the log file to check for updates:
tail -f /var/log/nginx/access.log- Ensure NGINX reloads after config changes
- Use traffic generation script to populate logs
Fluent Bit not reading logs?
- Check if
tailinput path is correct - Ensure permission to read the access log
- Delete or reset the
.dbfile if state is stale
Last updated on