
Alerting on SLOs
An SLO on its own is a report. What makes it operational is alerting on the rate at which its error budget is being spent, so a page arrives while there is still budget left to protect.
An SLO alert is an ordinary OpenObserve alert. It has destinations, silence, priority, history, and folders like any other — though the SLO page's form edits only the name, description, condition, schedule, and destinations. Priority, tags, and folder are set through the API and preserved across form edits. What is different is its condition: instead of a query, it references an SLO.
The defining property: an SLO alert runs no query
A regular scheduled alert re-scans your data every time it evaluates. An SLO alert does not. Measurement already happened on the SLO's own schedule, so the alert just reads the number that was computed.
Three consequences worth planning around:
- Cost is flat. Five alerts on one SLO cost five cheap row reads and zero extra data scans. Attaching fast, mid, and slow burn alerts to the same SLO is nearly free.
- The alert's frequency is independent of measurement. Checking every
minute does not make measurement any fresher. The floor on detection latency
is set by the SLO's slice interval and
ZO_SLO_INGEST_DELAY_SECS, not by the alert. - Alerts inherit the SLO's coverage. If the SLO cannot be measured, its alerts freeze. They do not resolve.
Creating an SLO alert
SLO alerts are created and edited from the SLO's own page, not from the generic alert form.
- Open Reliability > SLOs and select an SLO.
- Go to the Alerts tab.
- Select Add alert.
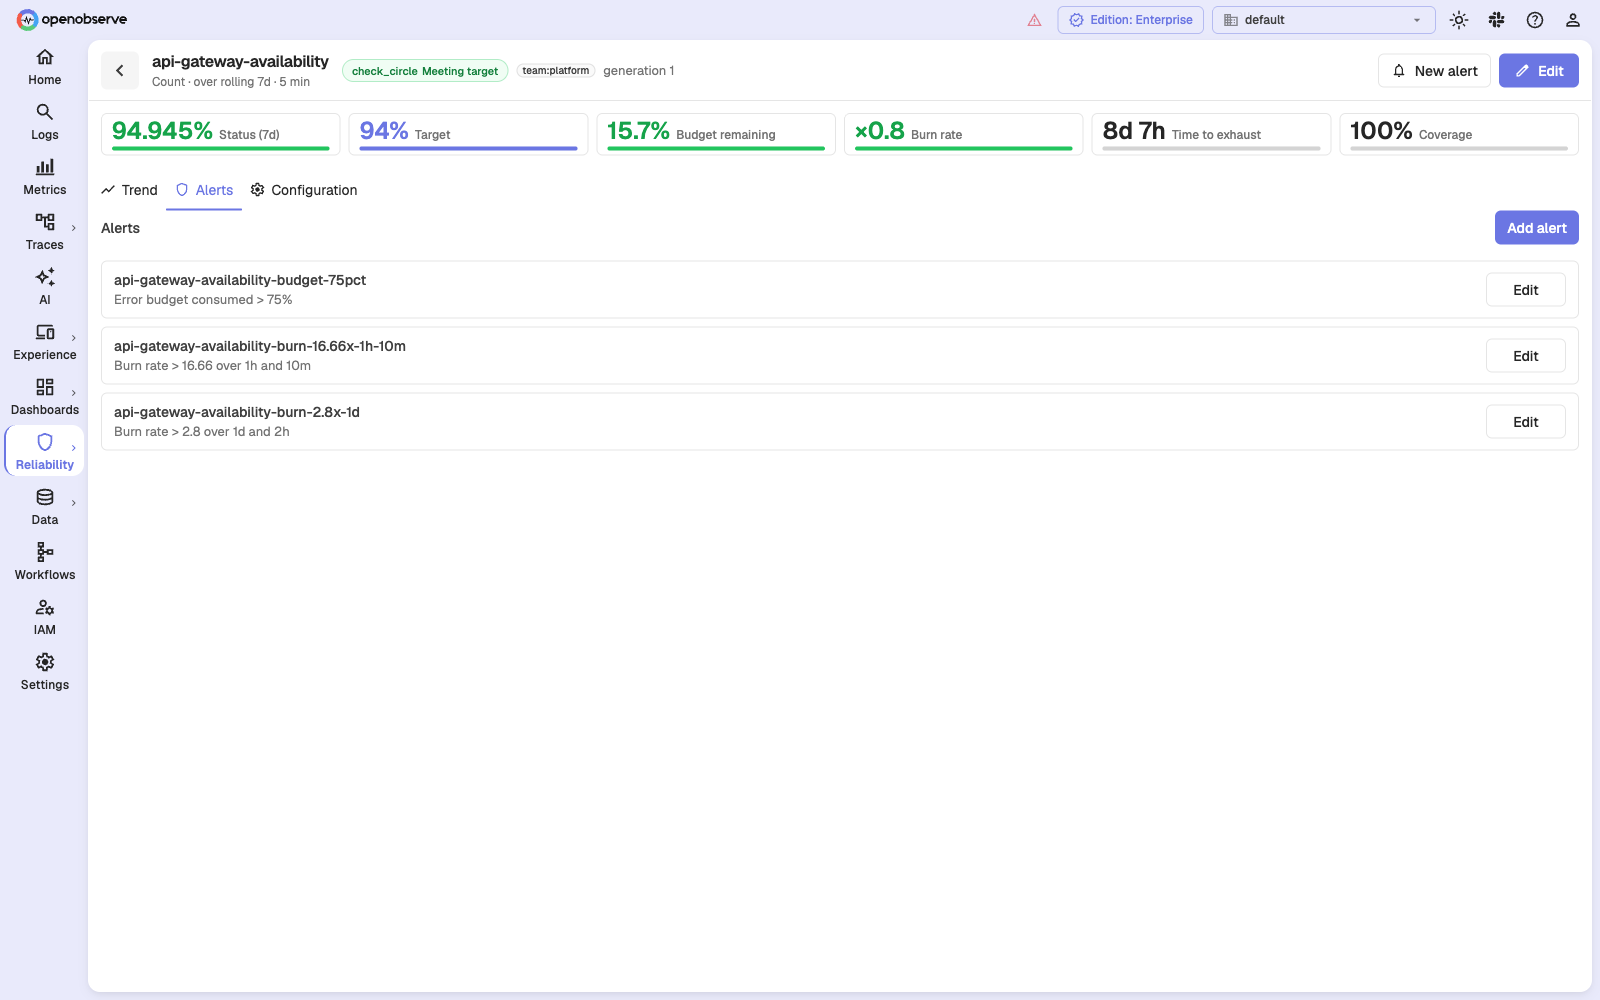
Editing an SLO alert from the alerts list, or from an alert's detail page, redirects you back to the owning SLO page. The HTTP API remains the automation path and accepts the same objects directly.
The two alert kinds
Burn rate
Fires when the error budget is being spent faster than a chosen multiple of budget-neutral, measured over two windows at once.
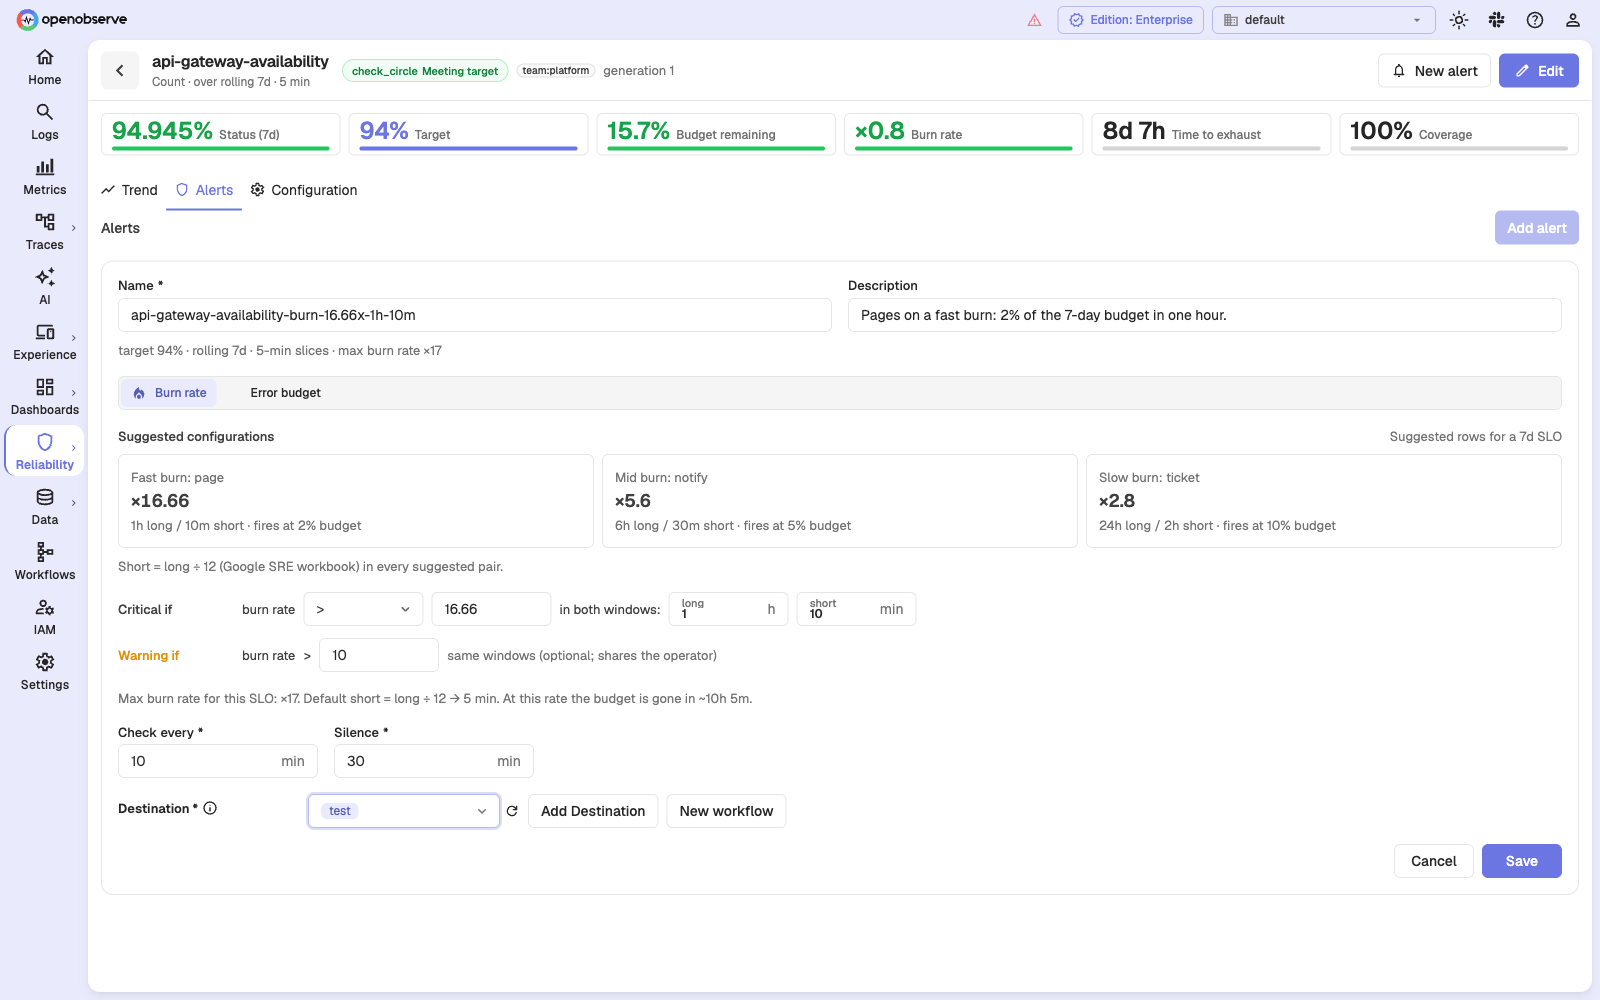
| Field | Meaning |
|---|---|
| Critical if burn rate > N | The paging threshold, as a multiple. |
| Warning if burn rate > M | Optional, and must be strictly less severe than critical. |
| long | The main measurement window: 1 hour to 48 hours. |
| short | The confirmation window: no longer than the long window, at least two slices, and an exact multiple of the slice interval. |
Both windows must exceed the threshold for the alert to reach a level. This is the standard multi-window rule, and it is the entire reason the short window exists.
The alert's level is the less severe of the two windows' classifications. In practice this means a healthy short window holds the alert down even while the long window is breaching — which is what suppresses a spike that has already recovered. Concretely, on an SLO with a 35% target — a 65% error budget; the numbers come from a real test run, and the arithmetic is the same at any target:
| Window | SLI | Burn rate |
|---|---|---|
| long (1h) | 35.85% | ×0.987 |
| short (10m) | 57.46% | ×0.654 |
With thresholds of warning ×0.8 and critical ×1.2: the long window breaches the warning, the short window does not, and the governing value is ×0.654 — so the alert is Ok. The recovery already visible in the short window is trusted over the damage still sitting in the long one.
The value reported in the notification is the governing burn rate — the one that actually gated the decision. The reported SLI and remaining budget come from the same window, so a notification can never show a burn rate that contradicts its own SLI.
Error budget
Fires on the percentage of the error budget consumed over the whole SLO window. It sets no burn windows — the SLO's window is the window, by definition.
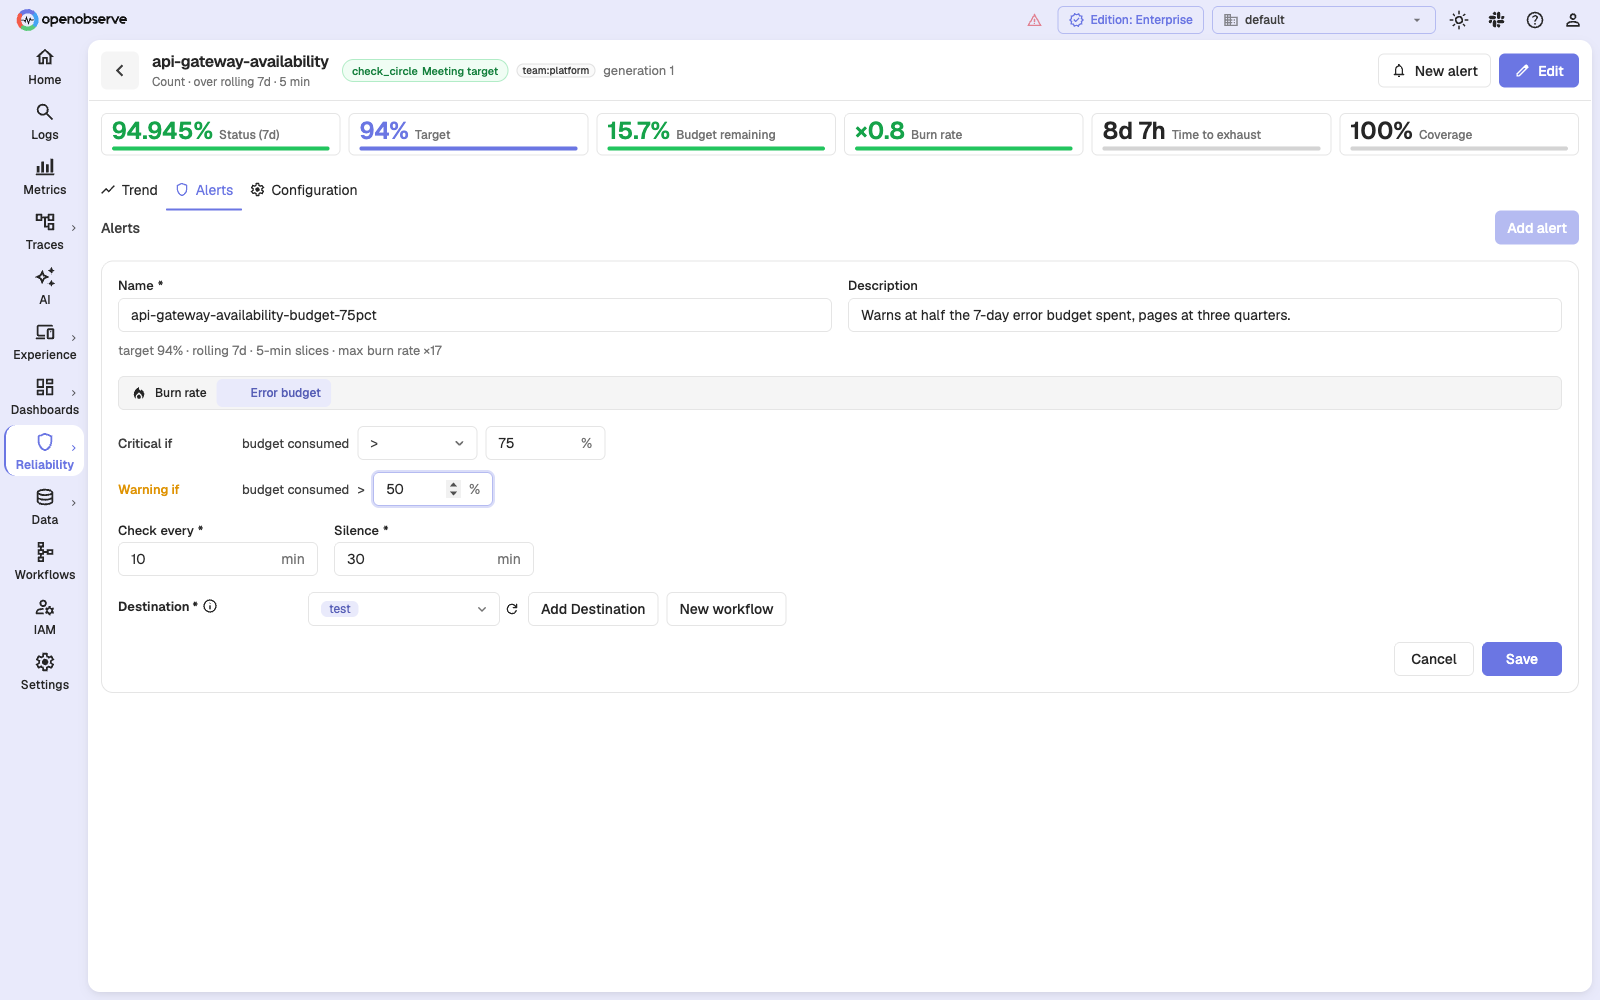
| Field | Meaning |
|---|---|
| Critical if budget consumed > N% | Page when this much of the window's budget is gone. |
| Warning if budget consumed > M% | Optional, strictly less severe. |
Use this for the slow-moving conversation — "three quarters of the trailing 30-day budget is gone" — rather than for paging. Note that the window is rolling, not a calendar period, so there is no month-end reset. It says nothing about speed either: the same 75% can be the residue of one bad hour or a fortnight of drizzle.
A practical pairing is warning at 50% and critical at 75%, so the budget review happens with time left to change something.
Suggested configurations
The form offers three prefilled configurations. Their windows are the same for every SLO; the burn thresholds depend on the SLO's window length:
| Preset | Intent | Windows | 7-day threshold | 30-day threshold | 90-day threshold |
|---|---|---|---|---|---|
| Fast burn: page | Wake someone up | 1h / 5m | ×16.8 | ×14.4 | ×21.6 |
| Mid burn: notify | Tell the team channel | 6h / 30m | ×5.6 | ×6 | ×10.8 |
| Slow burn: ticket | File it for the week | 24h / 2h | ×2.8 | ×3 | ×4.5 |
Every pair uses short = long ÷ 12, following the Google SRE workbook. Two adjustments are then made so that every card offered can actually be saved:
- The short window is snapped onto the SLO's slice grid — this depends on the slice interval, not the window length. On a 5-minute-slice SLO the fast card's 5-minute short window would be a single slice, which is rejected, so it is raised to 10 minutes; the 30m and 2h short windows are unaffected.
- The burn threshold is clamped down to the SLO's ceiling (×14.4 is impossible for any target at or below about 93%).
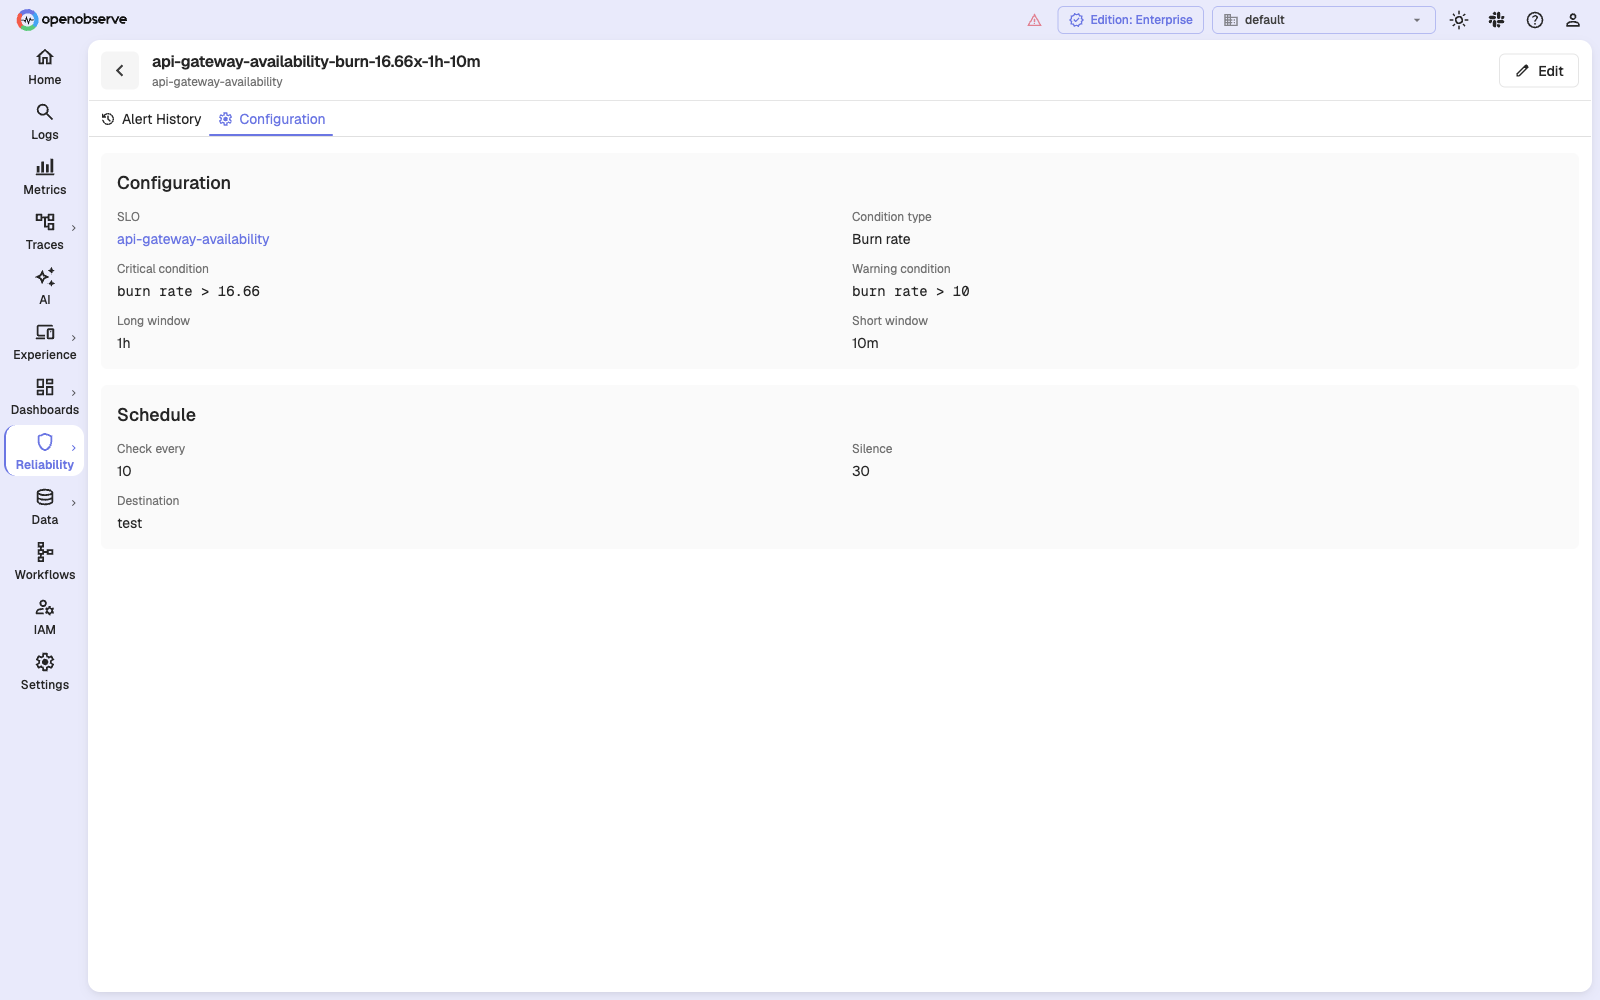
On a 94% SLO with 5-minute slices, the fast-burn card therefore reads ×16.66 with a 10-minute short window — the ×16.66 from the target, the 10 minutes from the slice interval.
What "fires at N% budget" means
Each card states the fraction of the error budget its threshold spends over the
long window — burn rate × (long window ÷ SLO window), computed from the
clamped threshold, so it is accurate for this SLO's window length and target:
| Preset | 7-day SLO | 30-day SLO | 90-day SLO |
|---|---|---|---|
| Fast burn | ~10% | 2% | ~1% |
| Mid burn | 20% | 5% | 3% |
| Slow burn | 40% | 10% | 5% |
Notice how different the same card is per window: "Slow burn: ticket" on a 7-day SLO fires once 40% of the budget is gone, versus 10% on a 30-day SLO. Shorter windows tolerate proportionally deeper spend before the slow-burn ticket, because the same 24 hours is a larger share of the window.
The recommended shape is the pair: one fast-burn alert to a paging destination, one slow-burn alert to a ticket queue, both on the same SLO and the same budget.
Delivery settings
| Field | Meaning |
|---|---|
| Check every | How often the alert re-reads the SLO's measurement. Minutes. |
| Silence | How long the alert holds off after a notification. |
| Destination | One or more destinations, or a workflow on Enterprise. |
Silence behaves differently depending on whether the alert has a warning threshold, and the difference matters during an incident:
- With a warning threshold, the alert keeps evaluating through the silence window and suppresses only delivery. A Warning to Critical escalation inside the window is still observed.
- Without one, silence pauses evaluation for the whole window. The alert does not look at the SLO again until the silence expires.
If you want a fast-burn alert to escalate mid-silence, give it a warning threshold.
Because the alert runs no query, Check every is cheap — but setting it below
the SLO's slice interval buys nothing.
Cron schedules are not offered in the form, which works in minutes. An SLO alert created through the API with a cron frequency keeps its cron schedule when saved from the form — but the form does not display the cron expression, and its Check every box does not control a cron alert. Editing that box stores a value the scheduler ignores. Manage cron-scheduled SLO alerts through the API.
What SLO alerts do not have
- No count gate. For other alert types, the trigger threshold means "for at least N groups". Here it is meaningless, and a non-default value is rejected rather than ignored — configuration that is silently ignored is configuration you cannot see.
- No lookback period, aggregation, VRL function, or multi-time-range. None of
them apply to an alert that runs no query. The stored object still carries a
periodbecause the API model requires one; it is inert — evaluation never reads it, and it only surfaces if a template uses{alert_period}. - No stream.
stream_nameis stored empty.stream_typeis left at itslogsdefault and is meaningless here — see the template variable notes below. - No per-group fan-out. One alert covers the SLO's overall rollup. Per-group SLO alerting is not supported yet and is rejected at save rather than silently degraded.
- No real-time mode. SLO alerts are always scheduled.
Freezing: the safety property
An SLO alert has three possible outcomes, not two:
| Outcome | Meaning |
|---|---|
| Observed, matched | Real measurement, threshold exceeded. Fires at Warning or Critical. |
| Observed, healthy | Real measurement, threshold not exceeded. Resolves to Ok. |
| Frozen | Nothing was measured. The alert's level is left untouched — it neither fires nor resolves. |
A frozen evaluation is recorded in the alert's history as skipped, with no level and no error, and it does not touch the alert's state. An alert that was Critical stays Critical through a measurement outage rather than reporting a recovery that nobody observed.
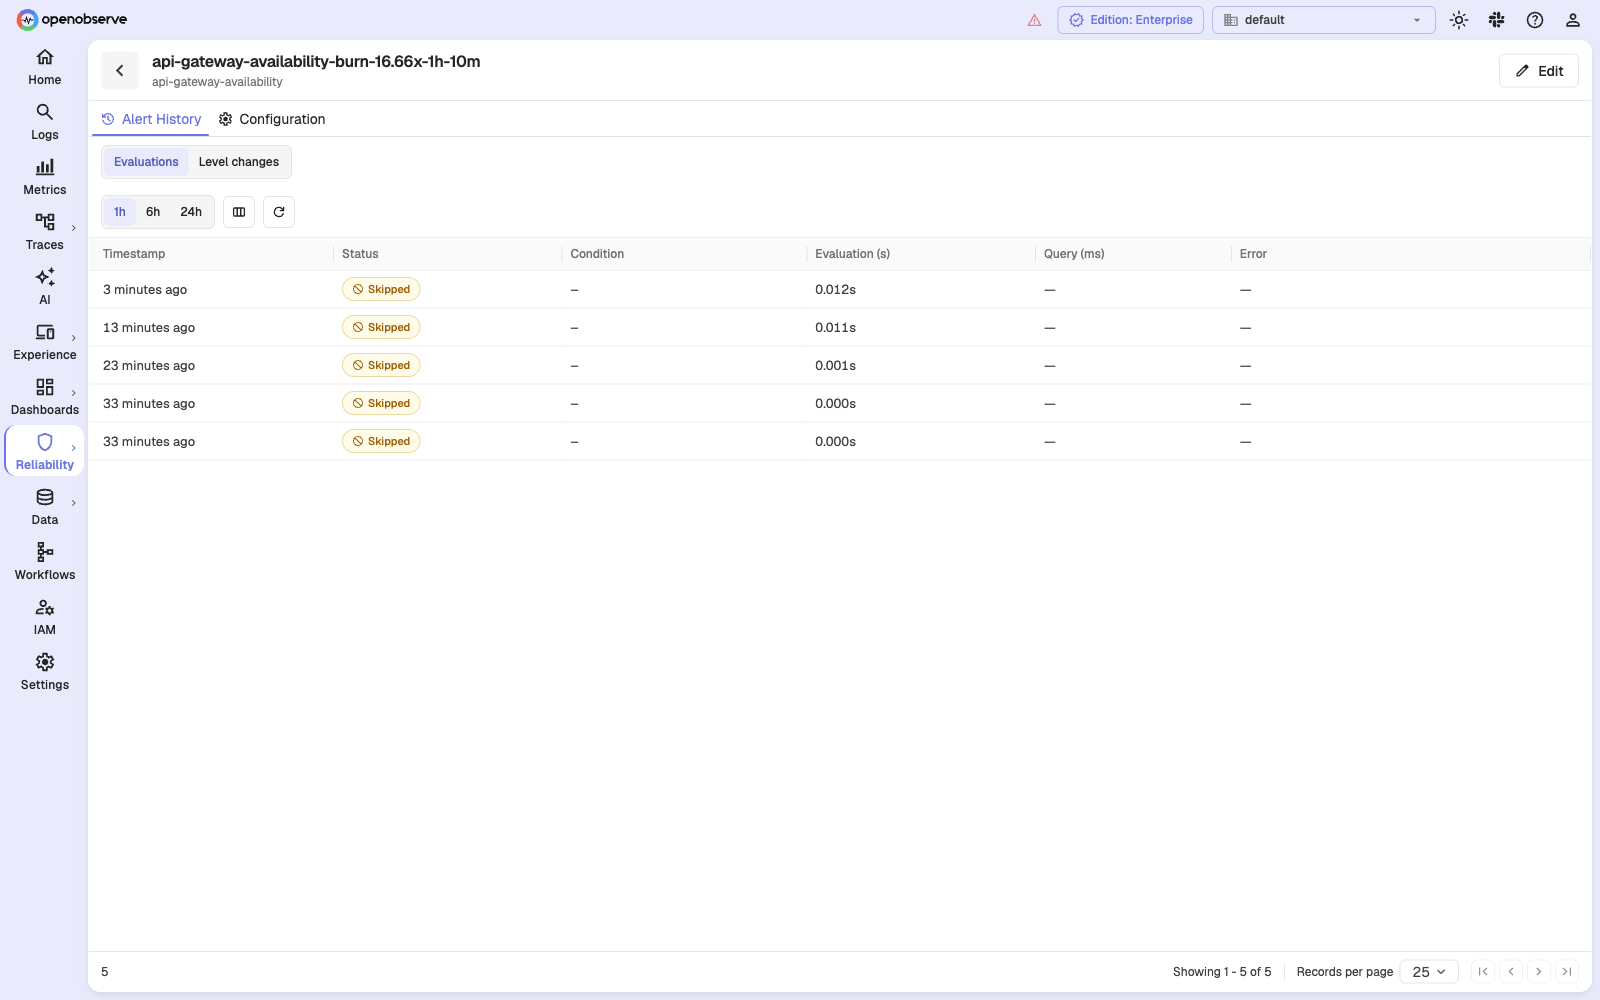
An evaluation freezes when:
- The watermark is stale — measurement has stopped advancing. Checked first: if the data is not current, nothing about it is a measurement.
- Coverage is below the floor —
ZO_SLO_MIN_COVERAGE, default 0.9. We cannot claim a window was clean if we did not measure it. - The window was covered but carries no events at all, so the SLI is undefined.
- The SLO is brand new and has not measured anything yet. A new SLO has not observed a healthy window; it has observed nothing.
- The SLO was redefined and the current generation has no measurements yet.
- The required burn window was never precomputed for this pair.
For a burn-rate alert, either window being unobserved freezes the whole classification.
A newly created alert on a newly created SLO will therefore sit frozen until backfill has filled enough of the window. That is expected, and the SLO page shows the coverage climbing.
Notification template variables
The following variables are available in destination templates for SLO alerts:
| Variable | Notes |
|---|---|
{slo_id} | |
{slo_name} | Use this in place of {stream_name}, which is blank. |
{slo_target} | |
{slo_window} | Rendered as 7d, 30d, 90d. |
{value} | Whatever was compared — the generic name. |
{burn_rate} | Burn-rate alerts only. Same value as {value}. |
{error_budget_consumed} | Error-budget alerts only. Same value as {value}. |
{sli} | The SLI from the governing window. |
{error_budget_remaining} | Signed; negative once the budget is blown. |
{group} is reserved for per-group SLO alerting and is never emitted today —
evaluation reads only the SLO's overall rollup row, so there is no group name to
substitute.
{stream_name} substitutes to blank, and {stream_type} renders logs, which
means nothing for an alert that reads no stream. Prefer {slo_name}.
A usable Slack template:
{slo_name} is burning error budget at ×{burn_rate}
SLI {sli}% against a {slo_target}% target over {slo_window}
Budget remaining: {error_budget_remaining}%
Window rules and limits
Validation rejects configurations that could never work, and each rejection names its own bound:
- Long window between 1 hour and 48 hours. Both windows must be exact multiples of the SLO's slice interval, at least two slices wide, and no longer than the SLO's own window.
- Short window no longer than the long window.
- Only
>and>=. Burn rate and budget consumption are bad when high; there is no meaningful "burn rate below X" alert. - Thresholds finite and strictly positive.
- Critical burn rate at or below
100 / (100 − target). Above that ceiling the alert would require an error rate over 100% and could never fire. On a 94% target the ceiling is about ×16.7; the form rounds it and states "Max burn rate for this SLO: ×17" under the threshold fields. - Error-budget threshold at or below 100%. Anything higher is dominated by alerting at 100.
- Warning strictly less severe than critical.
- At most 8 distinct (long, short) pairs per SLO, configurable with
ZO_SLO_MAX_BURN_WINDOW_PAIRS. The cost is per SLO, not per alert: ten alerts sharing two pairs cost two pairs. Reusing a pair another alert already uses is free, and disabling an alert releases its pair.
Multiple alerts on one SLO
One SLO is expected to carry several alerts. The measurement is shared; only the thresholds differ.
A conventional setup for a user-facing service:
| Alert | Kind | Threshold | Windows | Destination |
|---|---|---|---|---|
| fast burn | Burn rate | critical ×16.66, warning ×10 | 1h / 10m | Pager |
| slow burn | Burn rate | critical ×2.8 | 24h / 2h | Ticket queue |
| budget review | Error budget | critical 75%, warning 50% | — | Team channel |
Do not cross-prefill destinations between them. Sending the fast and slow burn alerts to the same place defeats the point of having both.
SLO alerts in the alerts list
SLO alerts appear in the normal alerts list alongside every other alert, in whatever folder they live in, labelled with their SLO.
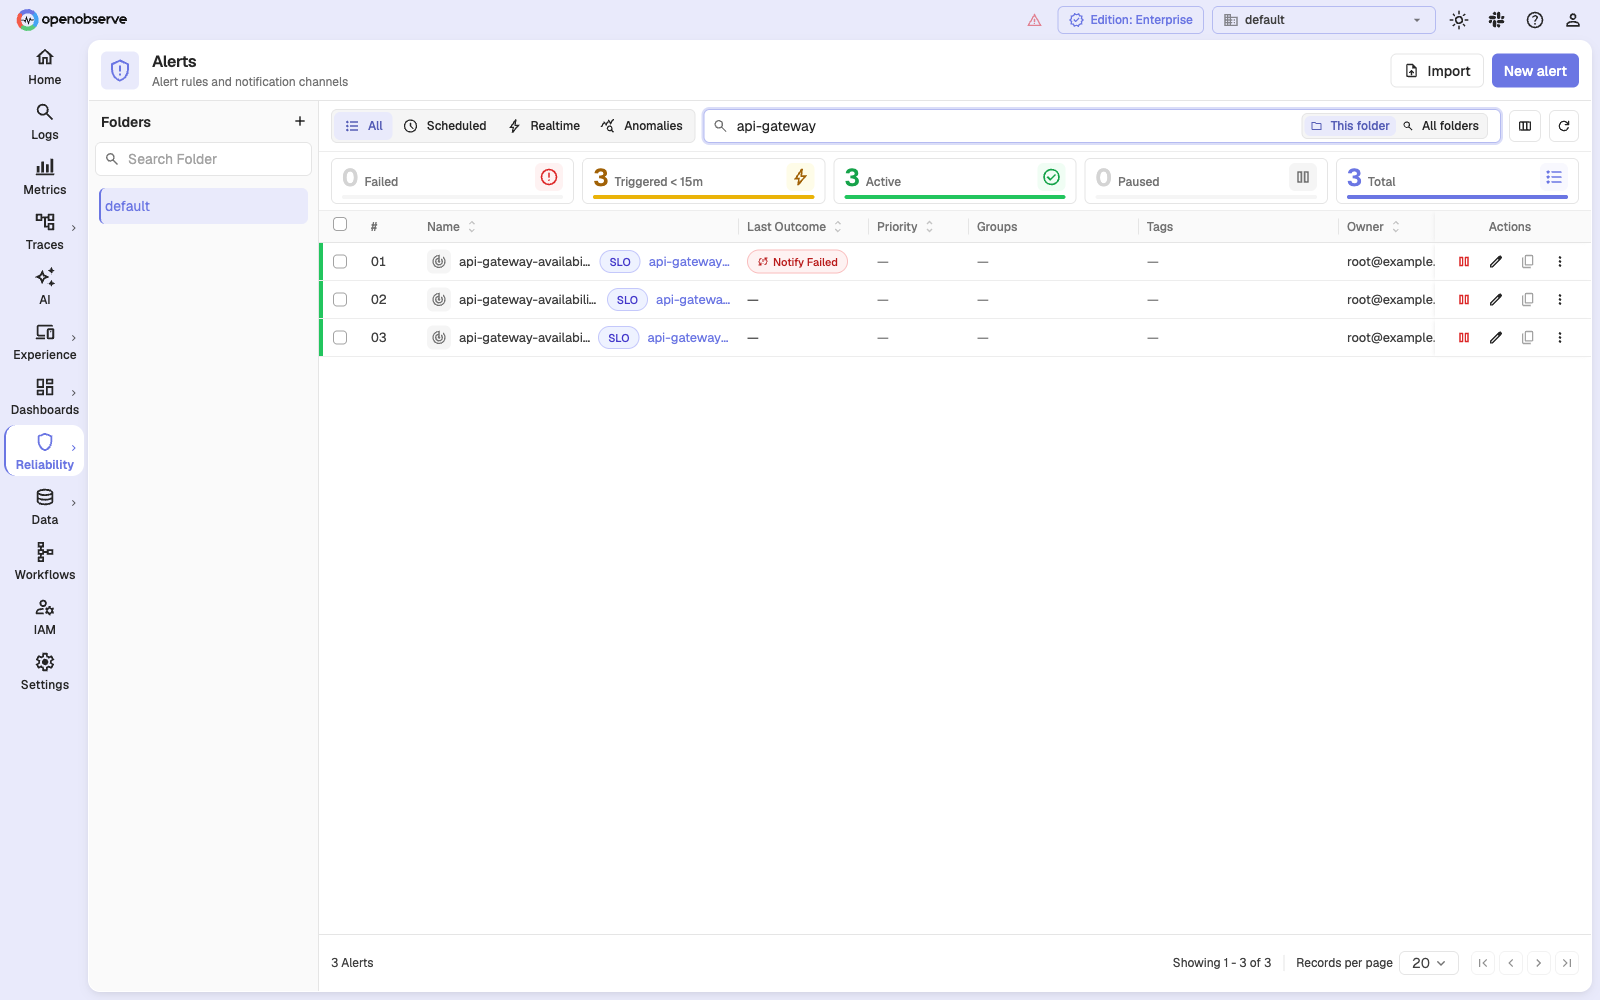
From the list you can enable, disable, delete, move, and export them. Edit takes you back to the SLO page, and Clone is disabled — SLO alerts are authored on their SLO page, and the generic clone flow cannot represent one.
Selecting the row opens the alert's detail page, which shows the SLO it burns against, its kind, thresholds, windows, and schedule.
Troubleshooting
The alert never fires and never resolves. It is frozen. Open the SLO and check the Coverage tile — coverage below the floor and a stale watermark both freeze evaluation, and the alert's history will show runs recorded as skipped.
If Coverage looks healthy and a burn-rate alert is still frozen, its
(long, short) pair is probably not being precomputed. A pair that was never
computed reports the same "below coverage floor" reason as a genuinely
under-covered window, so the tile will not point at it. Check that the alert is
enabled and that the SLO is within ZO_SLO_MAX_BURN_WINDOW_PAIRS.
Saving fails with "critical burn rate N exceeds the maximum".
The threshold is above 100 / (100 − target) for this SLO. Either lower the
threshold or raise the target.
Saving fails with "SLO alerts have no count gate". Something set the trigger threshold, the trigger operator, or the trigger warning threshold away from its default. All three count as part of the gate. Create the alert from the SLO page, which sends the correct defaults.
Saving fails on the burn-window pair cap. The SLO already has 8 distinct (long, short) pairs. Reuse one of the existing pairs, or disable an alert that holds a pair you no longer need.
A firing alert went quiet in the middle of an incident. Somebody edited the SLO. A computation-affecting edit starts a new generation and discards the current window's measurements, and evaluation stays frozen until backfill produces measurements for the new generation.
Next steps
Last updated on
Alert-Based SLOs
Turn an existing scheduled alert into an SLO in OpenObserve: measure the fraction of time the alert was not firing, with proof-of-evaluation coverage.
Dashboards Overview
Visualize and monitor real-time or historical data in OpenObserve using dashboards, variables, comparisons, and custom interactive charts.