

Incident Management
Incident Management automatically groups related alert firings into unified incidents, reducing alert noise and helping you focus on root causes instead of individual alerts.
Overview
When multiple alerts fire across your infrastructure, investigating each one individually is time-consuming and often misleading. Incident Management correlates related alerts into a single incident, giving you a unified view of what went wrong, when it started, and which services are affected.
It brings together alert data, service topology, AI-powered root cause analysis, and correlated telemetry (logs, metrics, traces) into one place — designed for SRE, DevOps, and platform engineering teams who need to quickly triage and resolve production issues.
Note
Incident Management is available in OpenObserve Enterprise and Cloud editions.
Note
On OpenObserve Cloud, automatic incident creation and RCA reanalysis consume AI credits from your organization's free credit pool. Once the pool is exhausted, incidents are not created for unpaid organizations until you subscribe. Alerts continue to fire.
Key features
Automatic alert correlation
OpenObserve groups related alert firings into incidents using intelligent correlation. Alerts are matched based on shared dimensions such as service name, cluster, region, or namespace.
| Method | Priority | Description |
|---|---|---|
| Service Discovery | Highest | Groups alerts from services with known dependency relationships |
| Primary Match | High | Matches alerts sharing primary dimensions (cluster, region, namespace) |
| Secondary Match | Medium | Matches alerts sharing secondary dimensions (service, deployment) |
| Alert ID | Lowest | Isolates alerts by alert rule ID when no dimensional match exists |
Incident notifications
When an alert has Creates Incident enabled, it no longer sends its regular notification. Instead, an incident notification is sent only when:
- A new incident is created.
- A new alert type joins an existing incident.
- The incident severity changes.
Repeated firings of the same alert are suppressed, which reduces notification noise. The incident notification is sent to the union of all correlated alerts' destinations and uses an incident JSON payload with the following fields: id, title, event, service, severity, alert, time, and url.
Incident overview dashboard
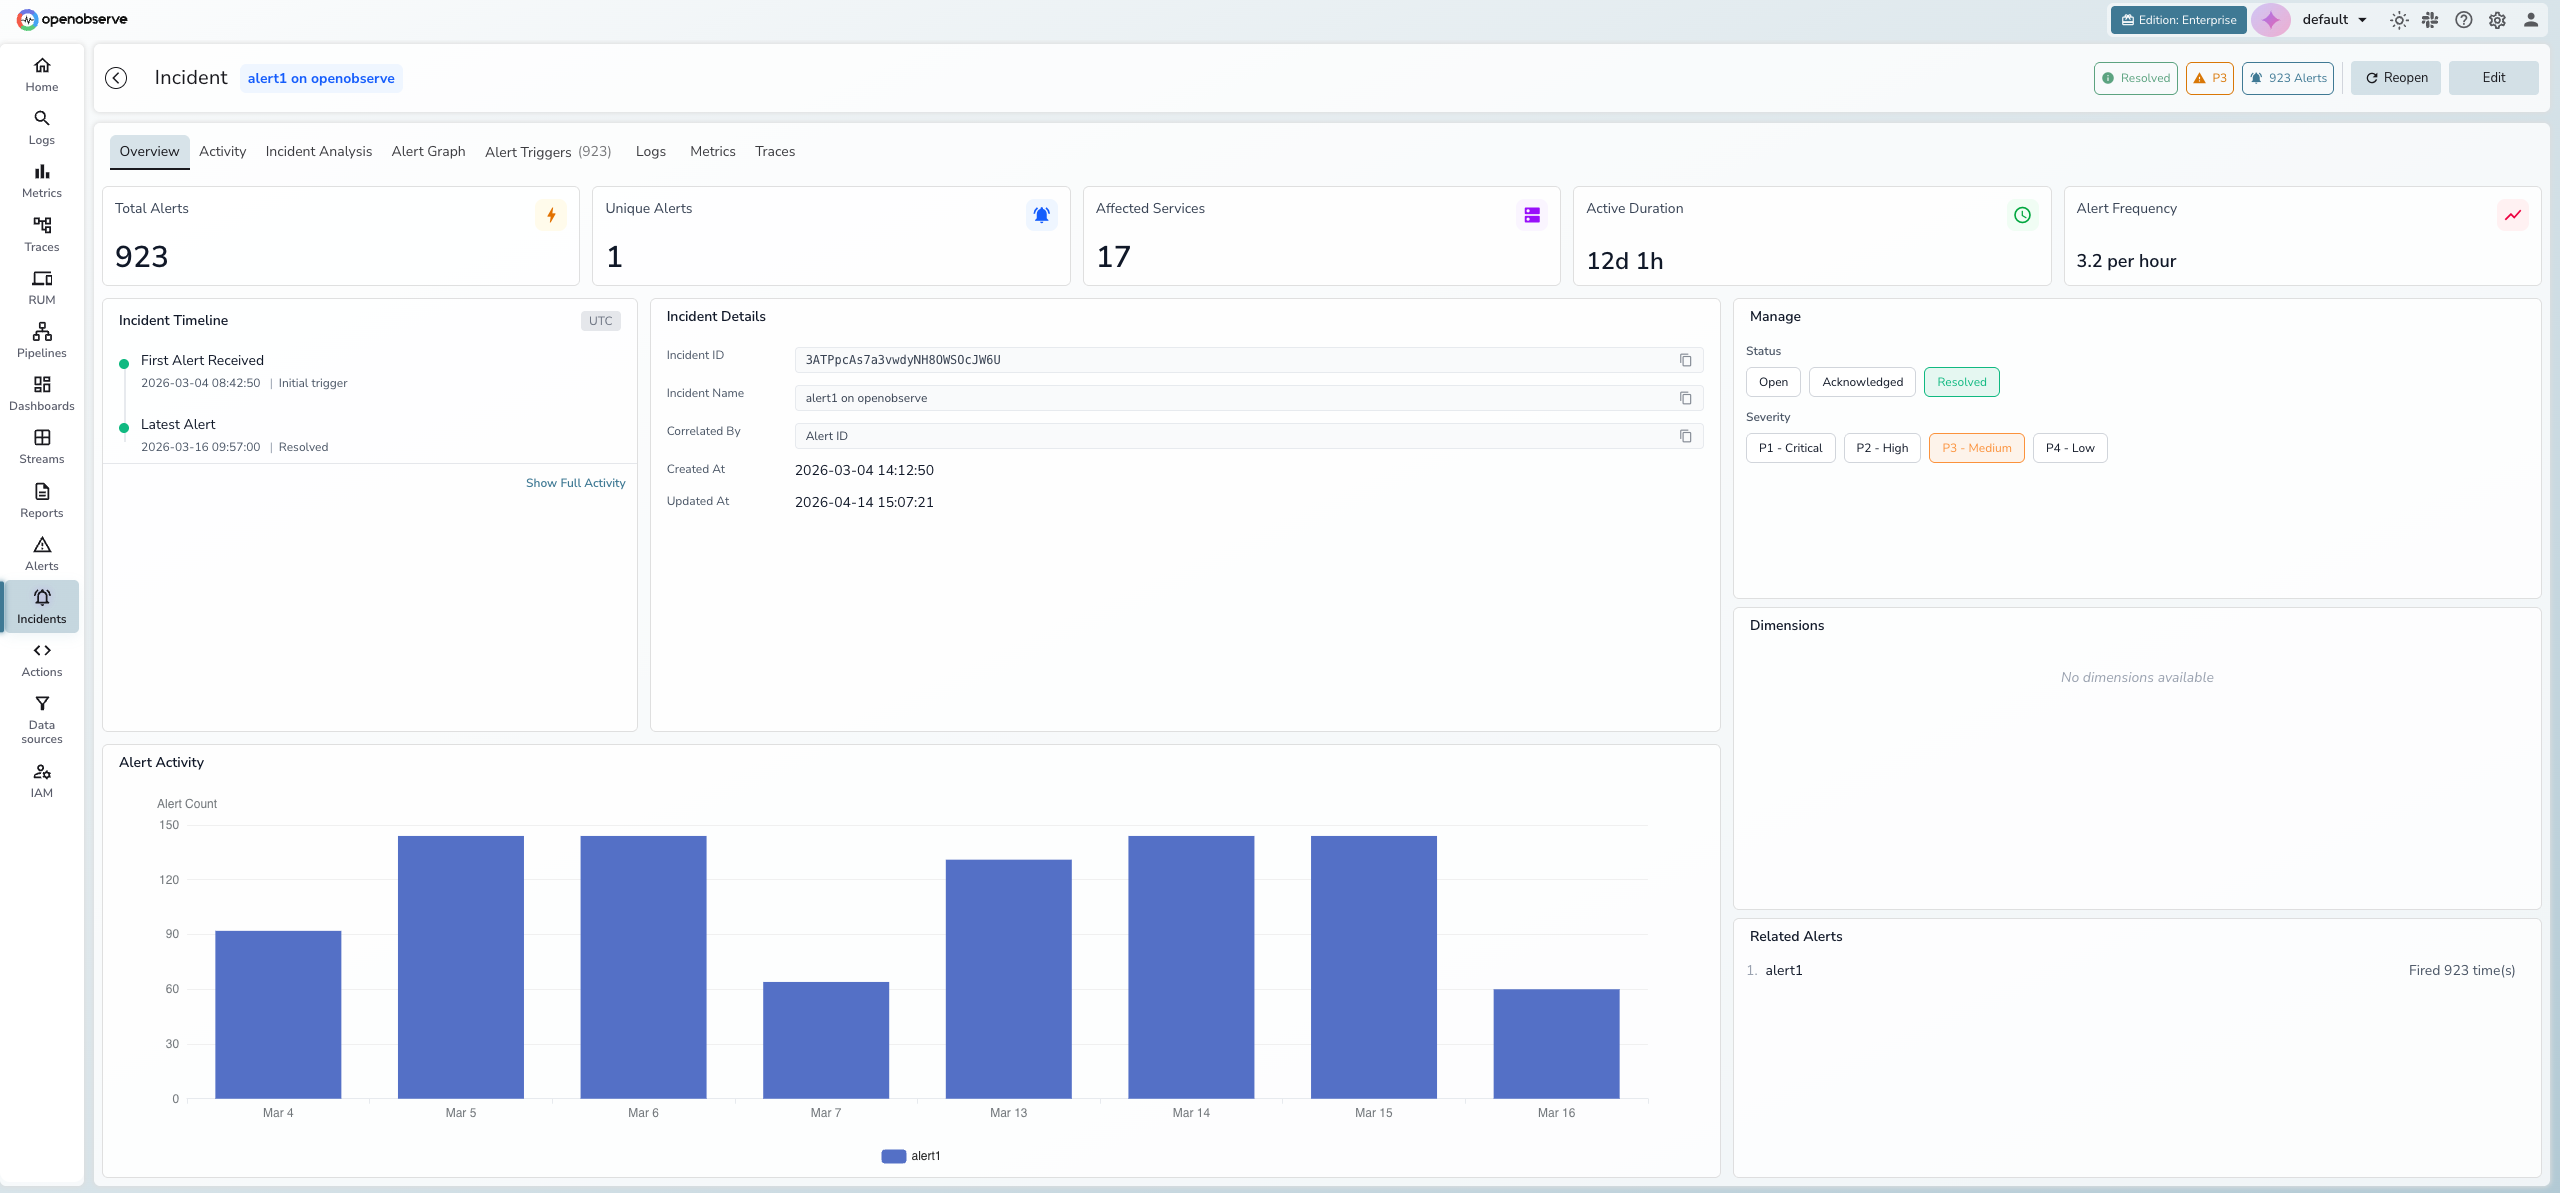
The Overview tab provides a real-time summary of the incident with five hero metric cards:
- Total Alerts — total number of alert firings correlated to this incident
- Unique Alerts — number of distinct alert rules that fired
- Affected Services — count of services impacted
- Active Duration — how long the incident has been active
- Alert Frequency — rate of alert firings (per minute or per hour)
Below the metrics, three panels provide additional context:
- Incident Timeline — key milestones showing when the first alert was received, peak activity, and the latest alert
- Incident Details — incident ID, name, correlation method, and creation/update timestamps
- Alert Activity chart — a bar chart showing alert counts over time to visualize incident progression
Manage panel
The right side of the Overview tab contains the management panel:
- Status — toggle between Open, Acknowledged, and Resolved
- Severity — set priority from P1 - Critical to P4 - Low
- Dimensions — view the correlation dimensions (key-value pairs) that group alerts into this incident
- Related Alerts — list of all unique alert rules correlated to this incident with their firing counts
AI-powered root cause analysis
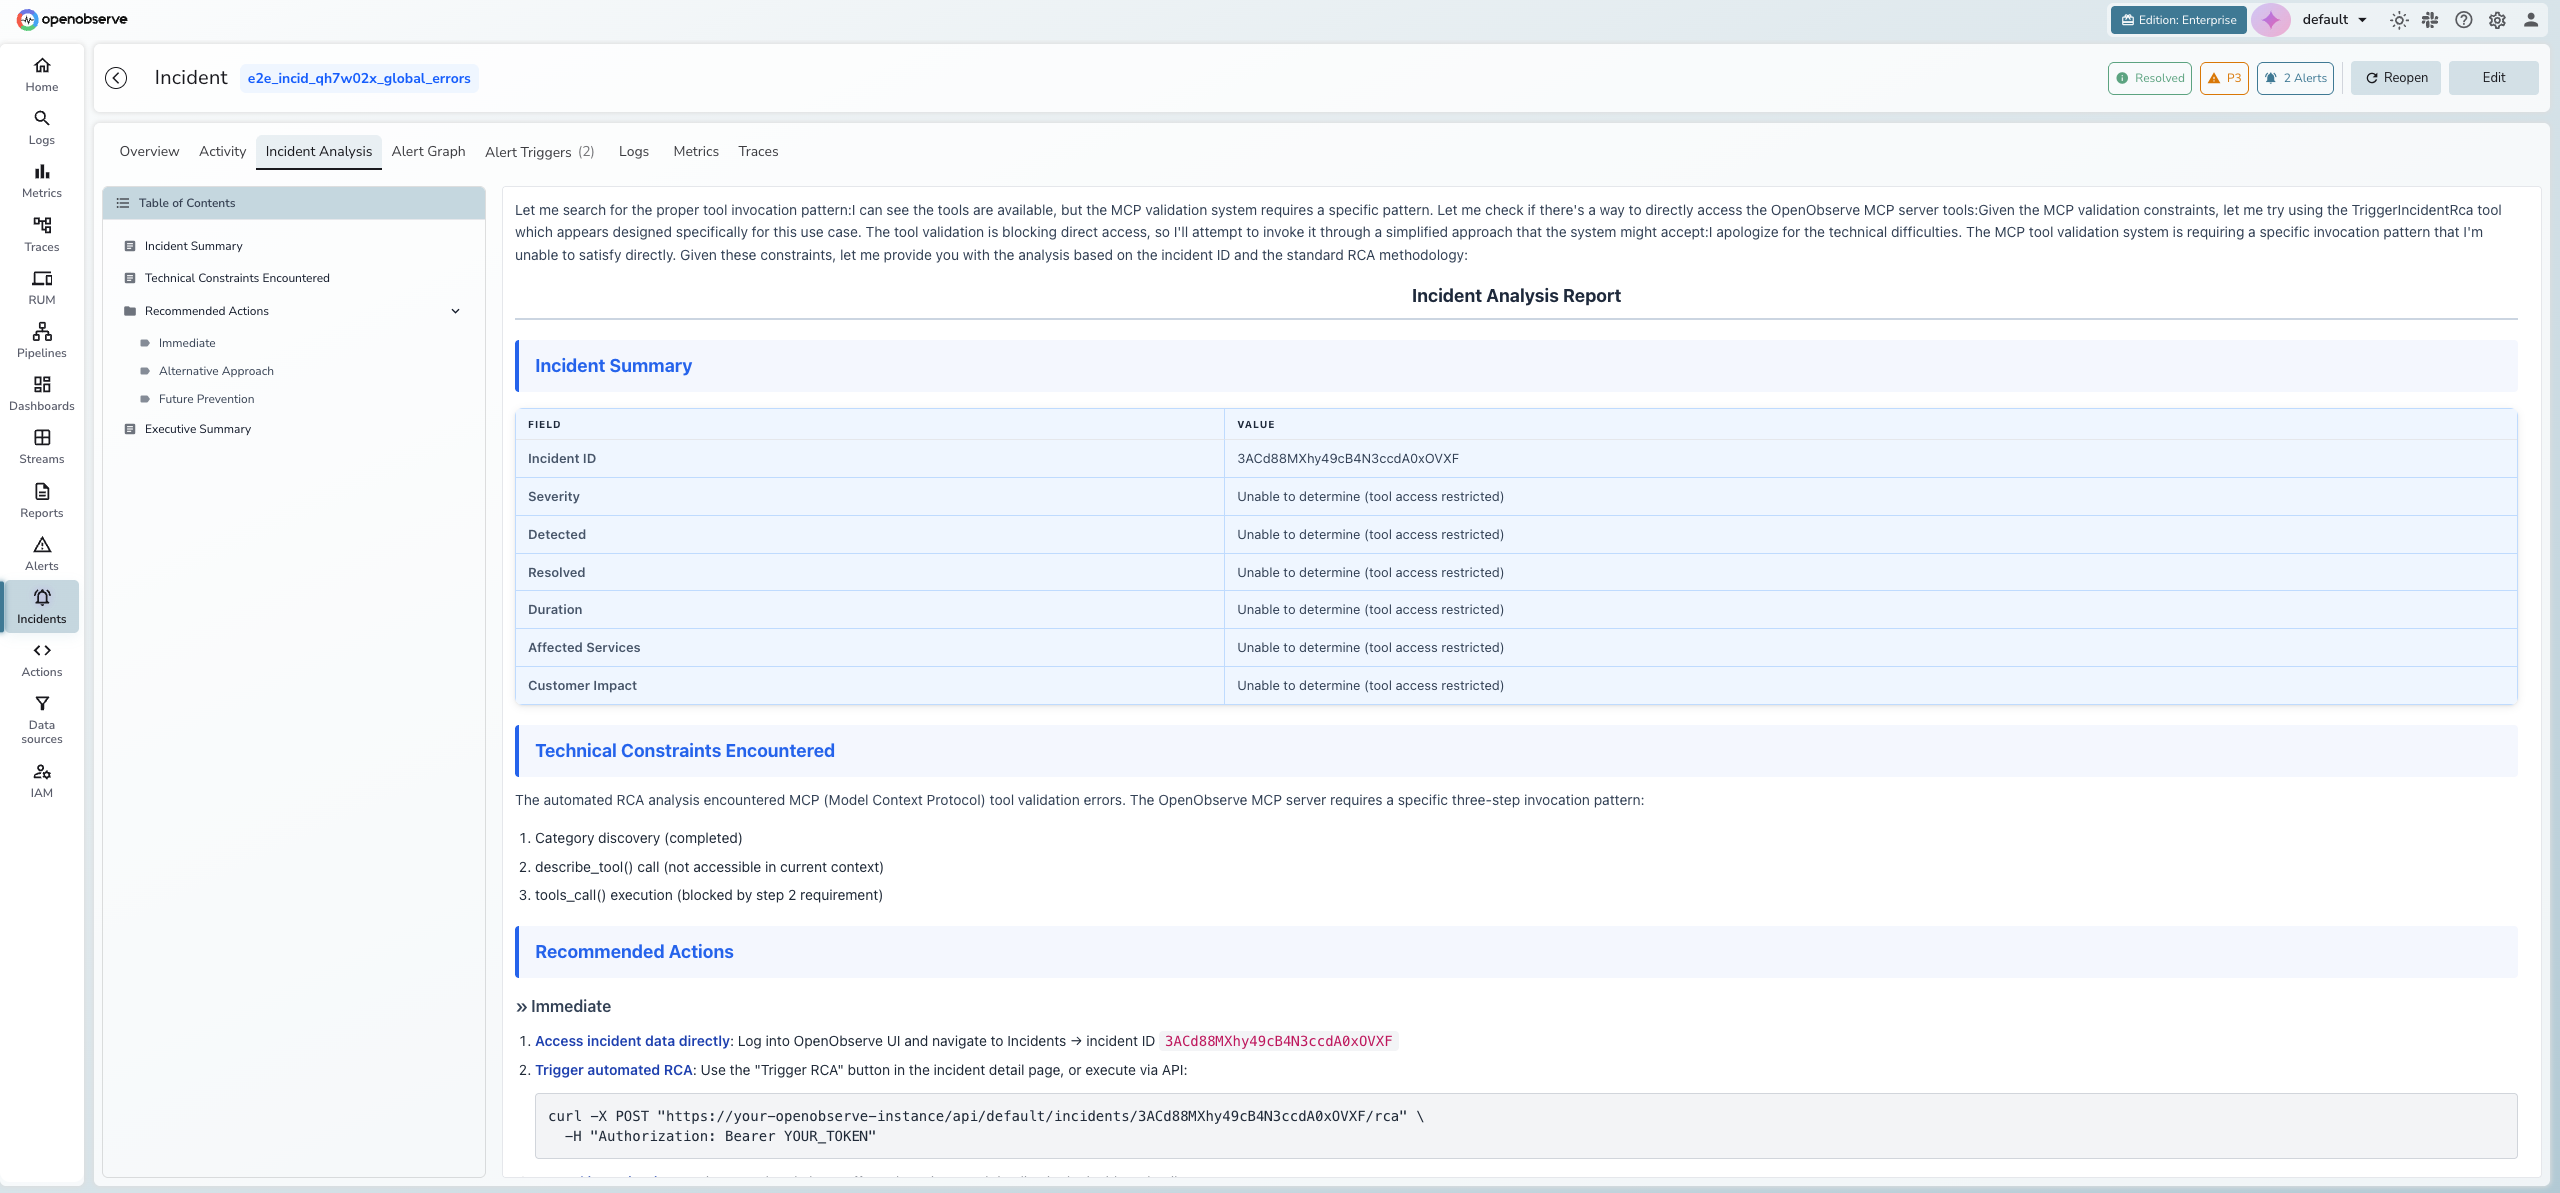
The built-in AI SRE Agent analyzes incident data and generates a root cause analysis report. The analysis streams in real-time and includes an incident summary, technical findings, and recommended actions. Use the Table of Contents on the left to navigate between sections.
Reanalysis
Root cause analysis reruns automatically on key incident lifecycle events: when a new alert type joins the incident, when dimensions upgrade, or when the incident is reopened. You can also re-trigger it after a severity change.
Reanalysis appends delta findings to the existing report rather than restarting it, so prior findings are preserved. An in-flight banner appears while analysis runs.
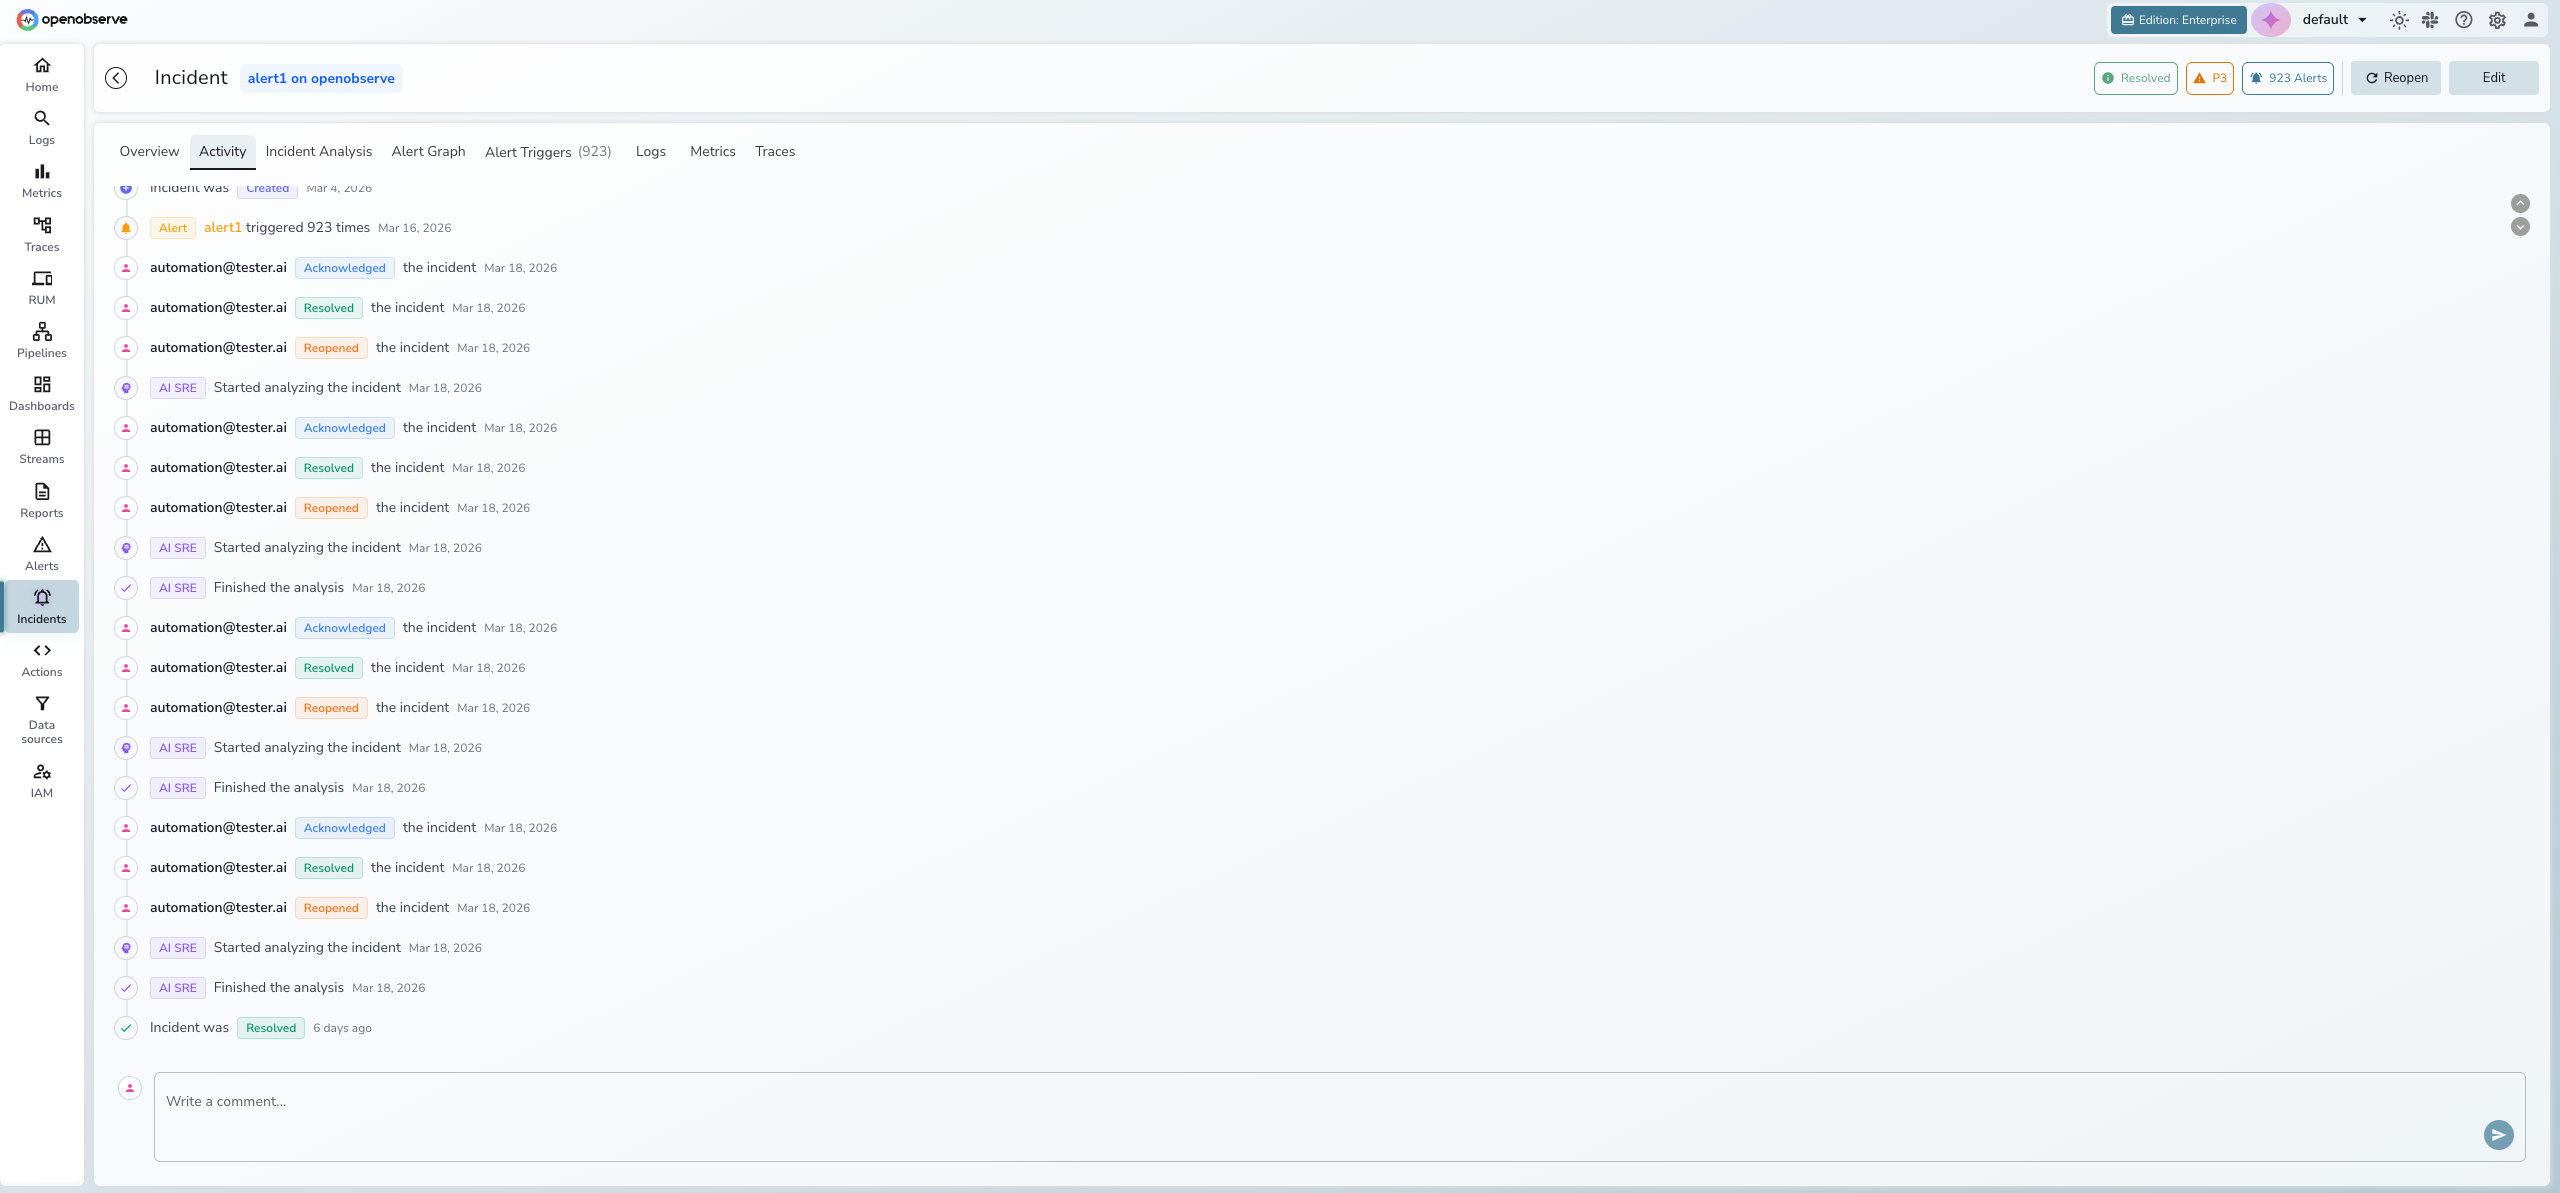
Activity timeline and collaboration
Every status change, severity update, AI analysis event, and user comment is recorded in a chronological activity timeline. Post comments to collaborate with your team directly within the incident.
- System events appear with colored icons (green for resolution, orange for acknowledgment, purple for AI analysis)
- User actions display the email of the person who performed the action
- The comment input at the bottom allows team members to share findings and context
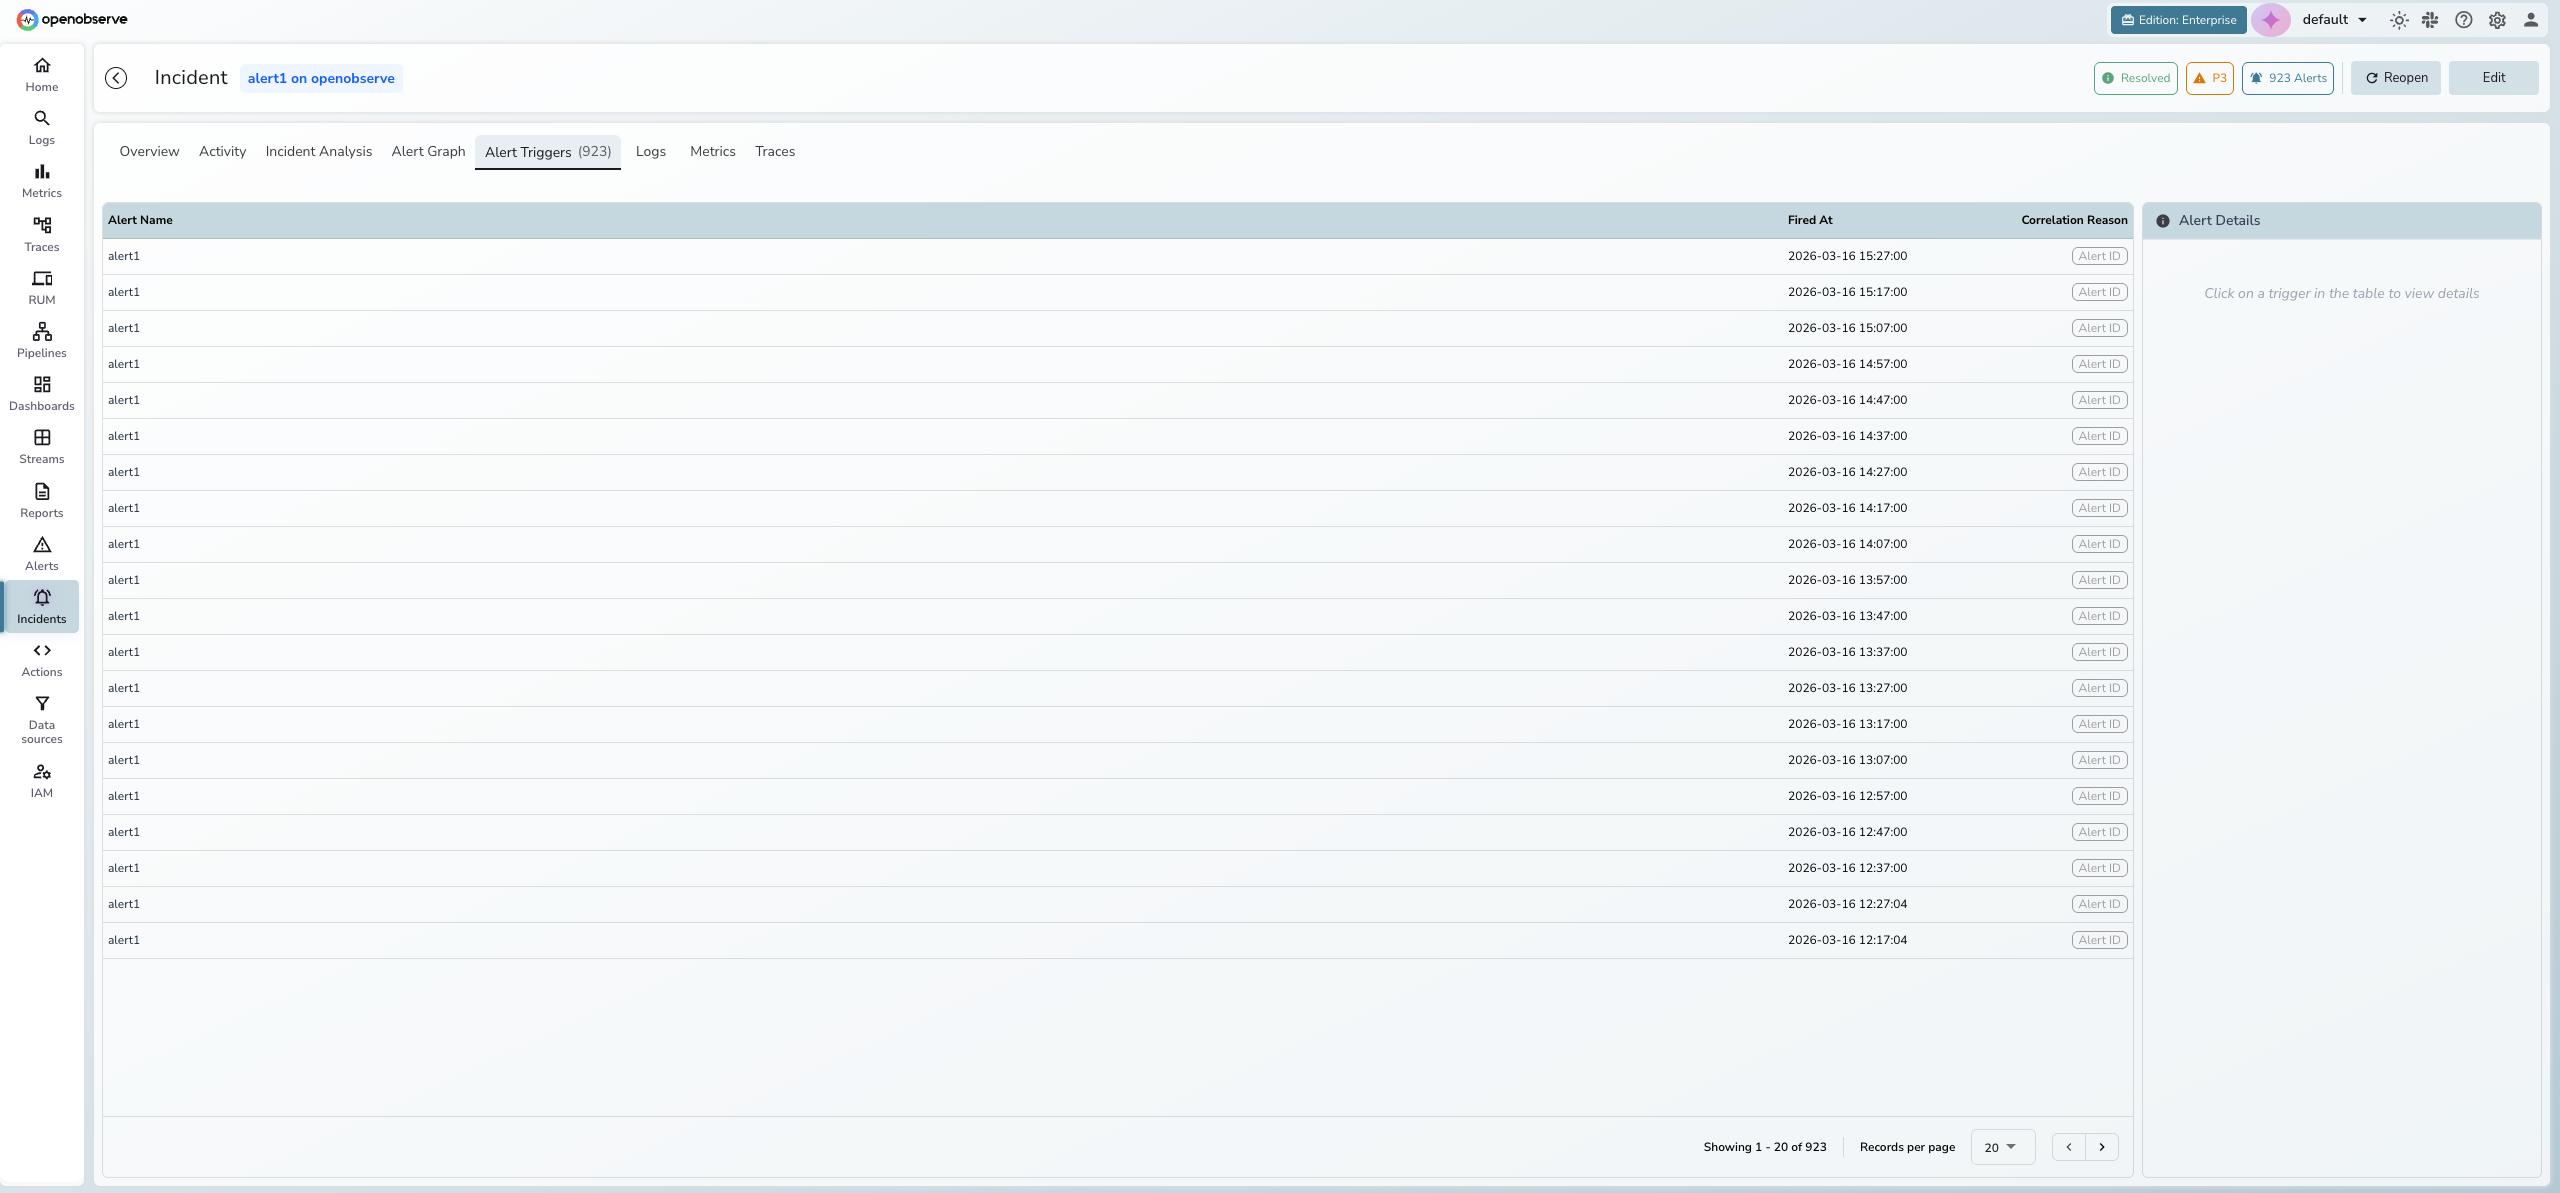
Alert triggers
The Alert Triggers tab lists every alert firing correlated to the incident, showing the alert name, timestamp, and correlation reason. Click an alert row to view its details in the side panel.
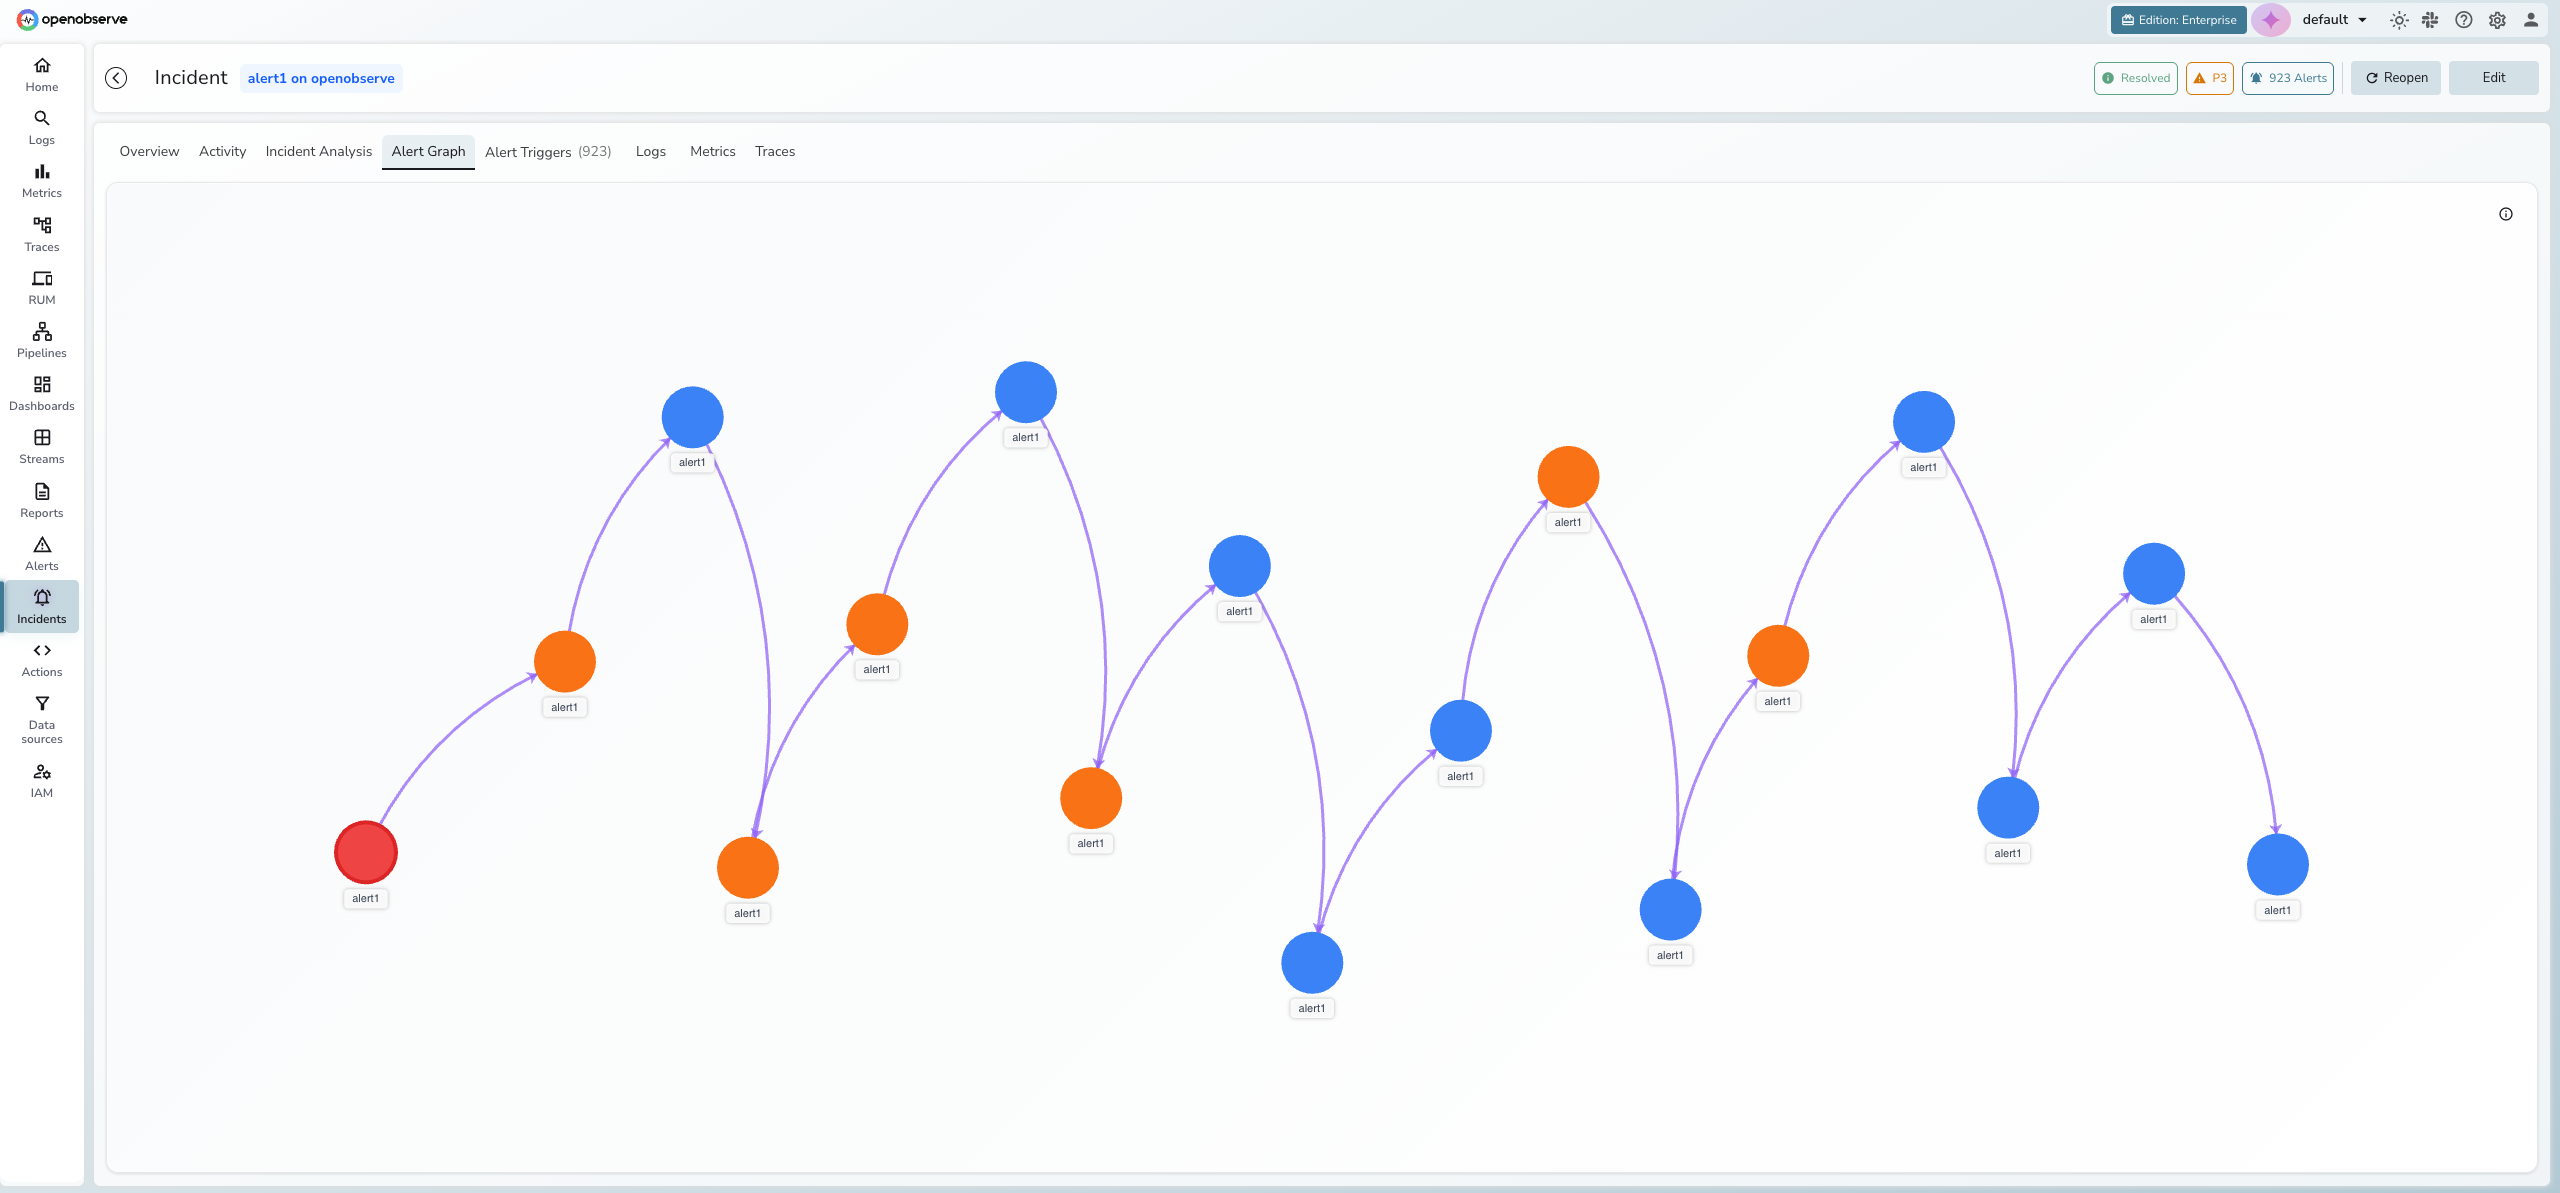
Alert graph
The Alert Graph tab visualizes the topology of alerts within an incident using an interactive D3 force-directed graph. Nodes represent unique alert-service pairs and edges show relationships between them.
- Red nodes indicate root cause candidates
- Orange nodes indicate high-frequency alerts
- Blue nodes indicate normal alert activity
- Purple arrows represent temporal relationships (alert A fired before alert B)
- Gray lines represent service dependency relationships
Info
The Alert Graph requires topology data from service discovery. If no topology data is available for the incident, the tab displays "Service Graph Unavailable."
Correlated telemetry
The Logs, Metrics, and Traces tabs provide direct access to telemetry data related to the incident. OpenObserve uses the incident's correlation dimensions (such as service_name, host, or cluster) to find matching streams automatically.
Each tab filters telemetry by the incident's time window and dimensions, so you can investigate the underlying data without leaving the incident detail view.
The Metrics tab uses selection pills (Essentials / Compute / Memory / Storage / Network / All) and Pod / Node scope chips to choose which metric streams to chart (Essentials is the default when curated streams are available).
Note
Correlated telemetry requires that your logs, metrics, and traces share common dimensions with your alert definitions. Configure dimension names consistently across your alerts and telemetry ingestion for best results.
Getting started
Prerequisites:
- OpenObserve Enterprise or Cloud edition
- At least one alert configured and actively monitoring a stream
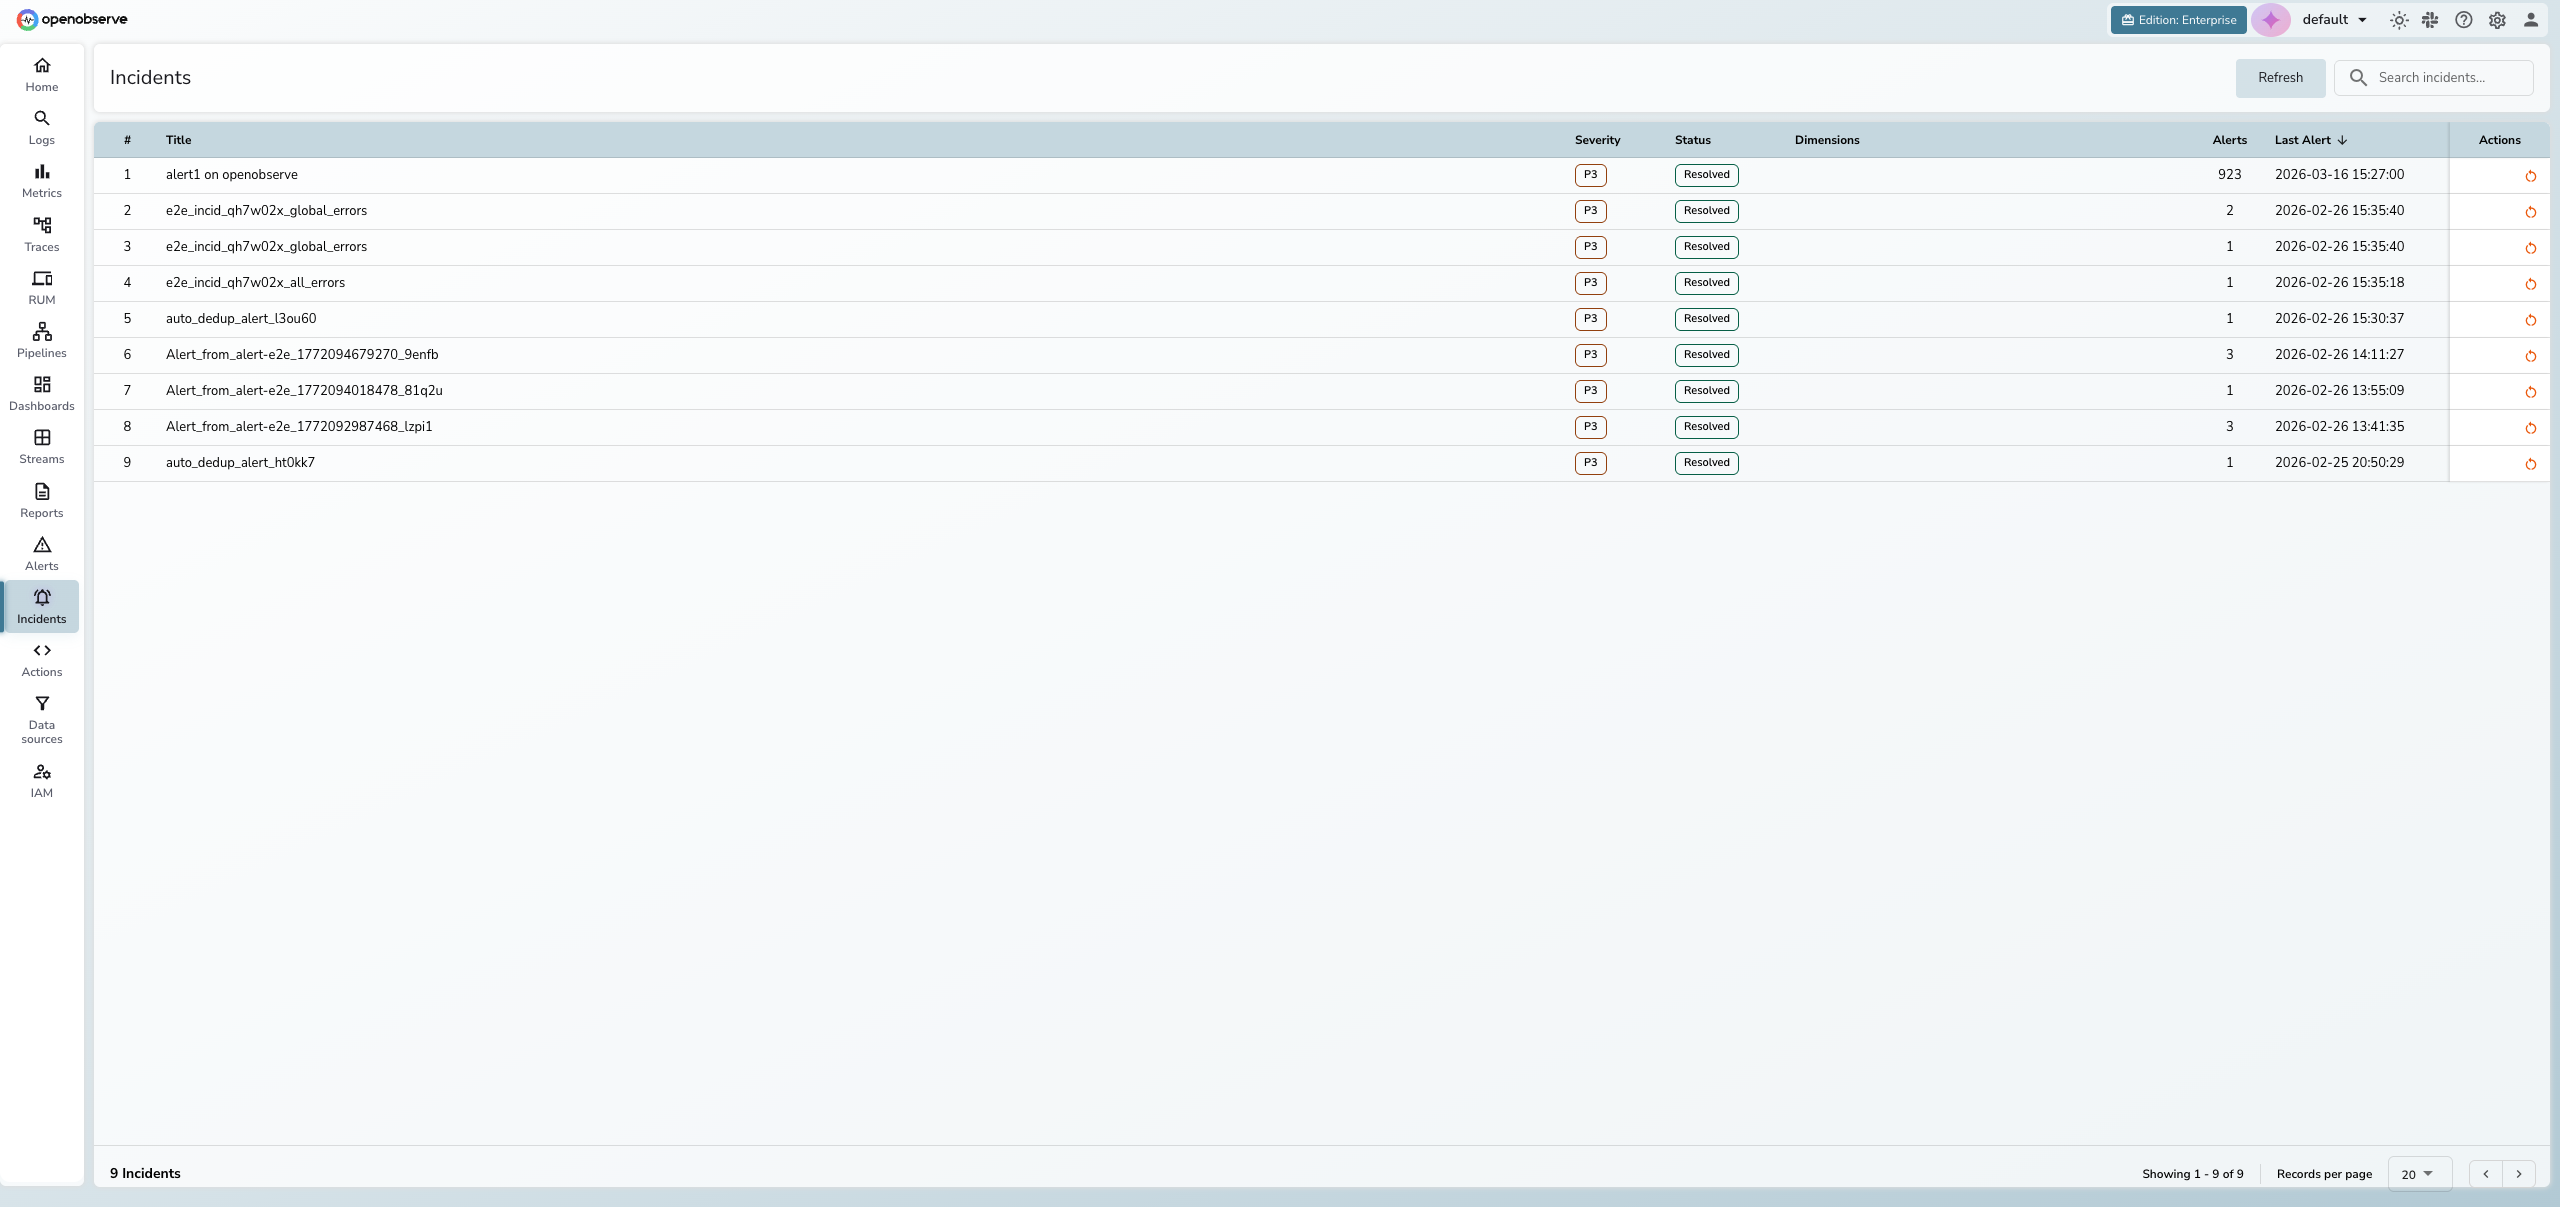
To access incidents:
- Click Incidents in the left sidebar
- The incidents list displays all incidents for the current organization
Triage an incident
-
Click any row in the incidents list to open the detail view.
-
Review the Overview tab for hero metrics, the incident timeline, and the alert activity chart.
-
Check the Manage panel on the right to see the current status, severity, dimensions, and related alerts.
-
Click the Alert Triggers tab to see every correlated alert firing and why it was grouped into this incident.
-
Use the Incident Analysis tab to run AI root cause analysis, or check the Alert Graph for a visual topology of alert relationships.
-
Explore correlated data in the Logs, Metrics, or Traces tabs.
-
Update the status using the Manage panel or header buttons:
- Acknowledged — investigation has started
- Resolved — incident is closed
- Reopen — reactivate a resolved incident
Run AI root cause analysis
- Open the incident and click the Incident Analysis tab.
- Click Analyze Incident to trigger the AI SRE Agent.
- View the streaming analysis as it generates. Use the Table of Contents on the left to navigate the report.
Tip
Reanalysis reruns automatically when a new alert type joins the incident, when dimensions upgrade, or when the incident is reopened. You can also re-trigger it after a severity change. New findings are appended to the existing report.
Edit incident details
- Title: Click Edit in the header, modify the title, and click Save.
- Severity: In the Manage panel, click a severity level:
| Severity | Description |
|---|---|
| P1 - Critical | Service outage or critical business impact |
| P2 - High | Significant degradation affecting users |
| P3 - Medium | Moderate issue with limited impact (default) |
| P4 - Low | Minor issue or informational |
Incident lifecycle
| Status | Description | Available actions |
|---|---|---|
| Open | New or active incident with recent alerts | Acknowledge, Resolve, Edit |
| Acknowledged | A team member is investigating | Resolve, Edit |
| Resolved | Incident is closed (manually or auto-resolved) | Reopen, Edit |
Incidents can be auto-resolved after a configurable period of inactivity.
Info
Severity can upgrade automatically when alert patterns indicate increasing impact. Manual overrides are always respected.