
Metrics Explorer
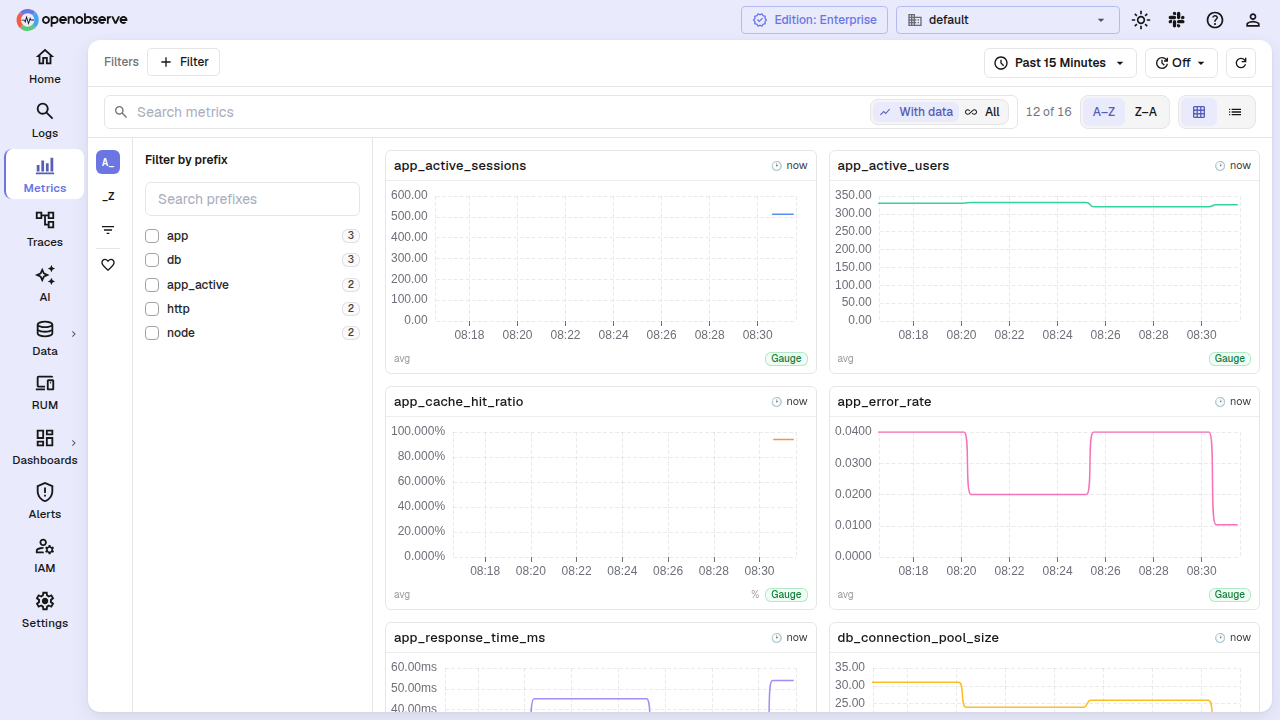
The Metrics Explorer provides two connected views for working with metrics data. Click Metrics in the sidebar to open the browse grid at /metrics — a visual overview of every metric family in your organization. Click any metric card or navigate to /metrics/editor to open the panel editor with PromQL input, chart visualization, and dashboard controls.
Browse grid
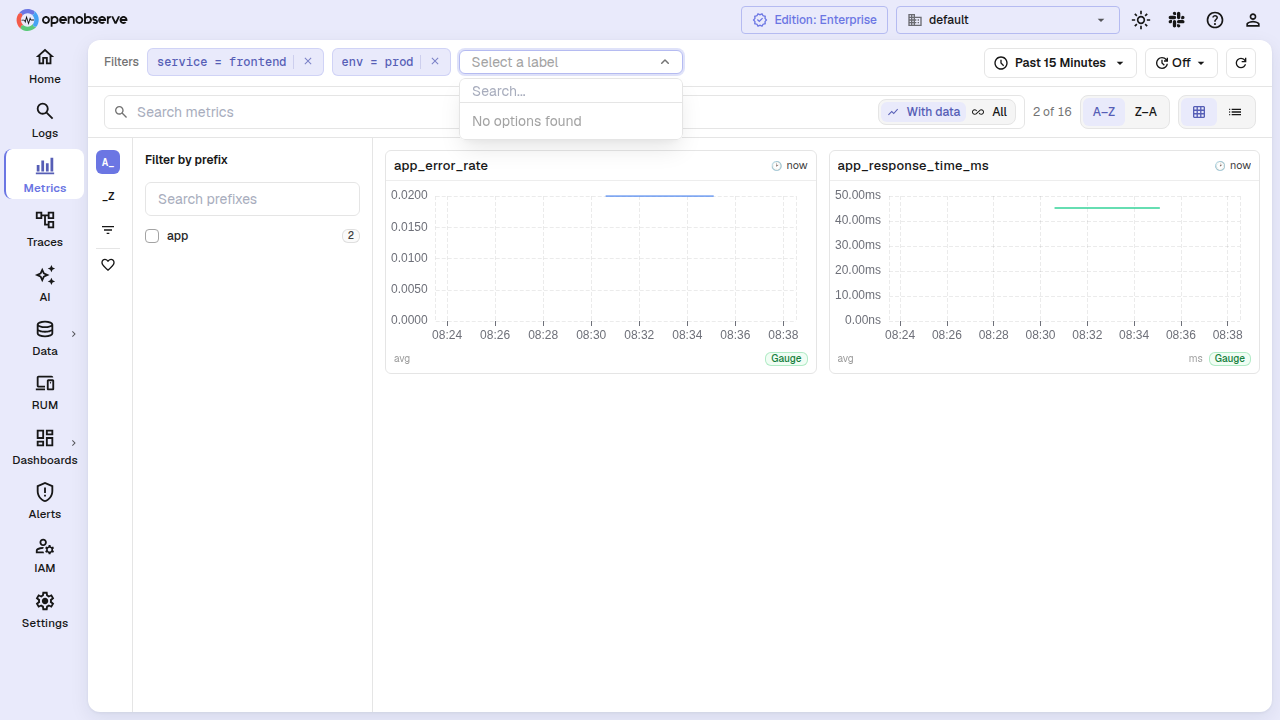
The browse grid gives you a fast, visual overview of all metric families. Each card shows the metric name, its type (via a color-coded badge), the current charted value, and a mini sparkline.
Metric cards
Cards are fetched lazily as you scroll. A card queries its default aggregation only when it enters the viewport, so opening the grid on a large org never fires hundreds of queries at once.
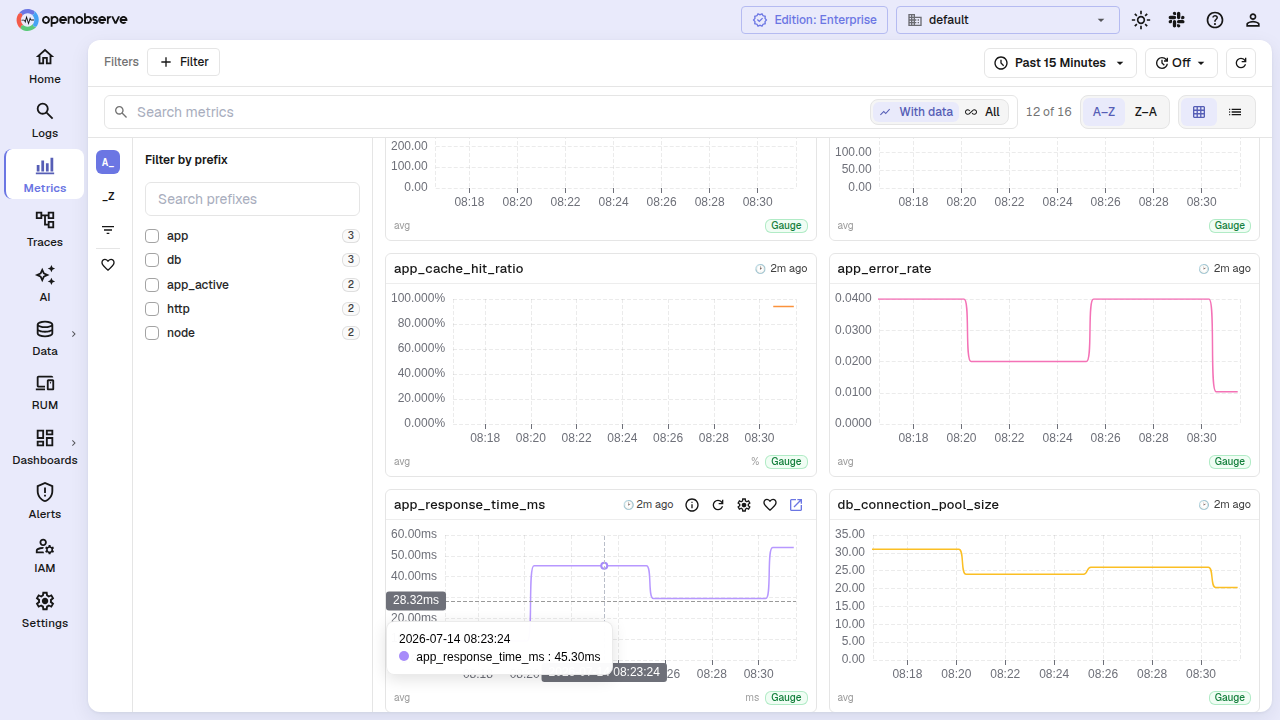
Card defaults by type:
| Metric type | Default query | Card chart |
|---|---|---|
| Counter | sum(rate(metric[window])) | Line chart |
| Gauge | avg(metric) | Line chart |
| Histogram | histogram_quantile(0.95, sum(rate(metric_bucket[window]))) by (le) | Heatmap |
| Summary | avg(metric) | Line chart |
| Info | — | Label table |
You can override a card's function for individual metrics via the gear (⚙) icon on the card. The override is saved per-browser and persists across sessions.
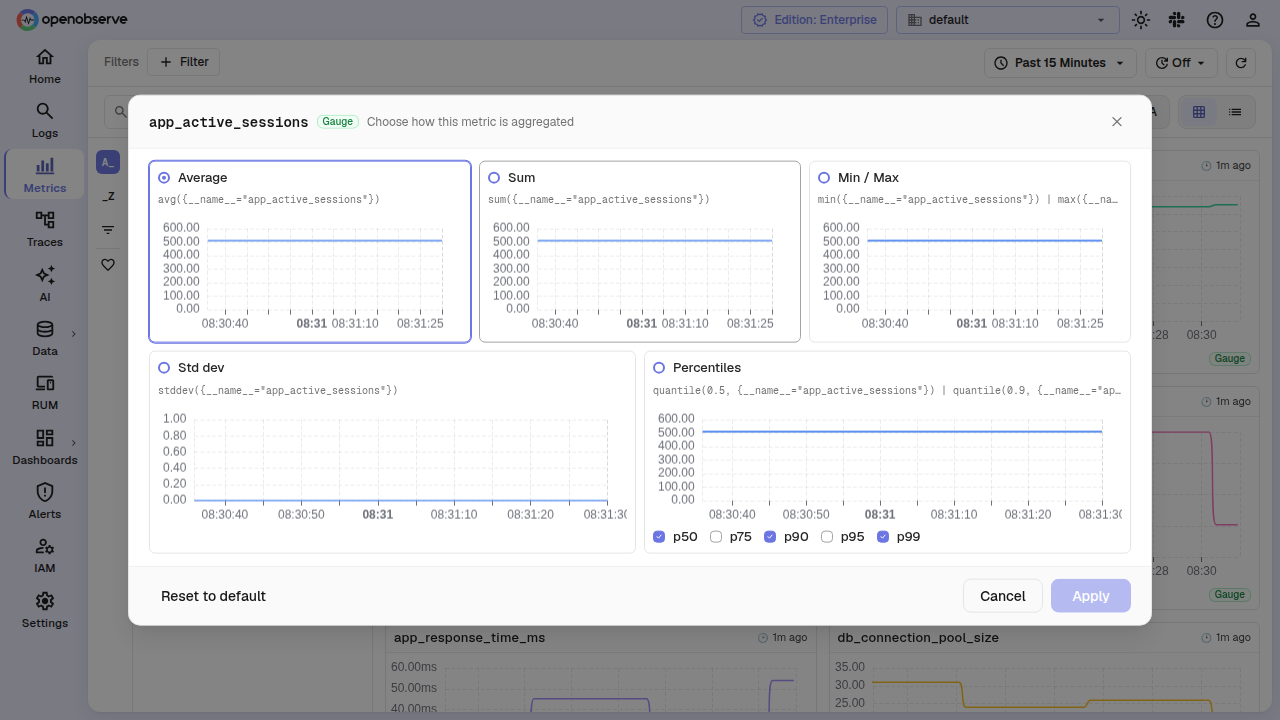
Star a metric to pin it. Use the Favorites toggle in the toolbar to narrow the grid to starred metrics only.
Filtering
The left rail exposes three filter panels:
- Prefix — group by the first segment of the metric name. Useful in orgs that follow naming conventions like
node_cpu_*,node_memory_*,http_request_*. - Suffix — group by the last underscore-delimited segment. Surfaces common units (
_bytes,_seconds,_total) alongside domain suffixes. - Type — filter by metric type: Counter, Gauge, Histogram, Summary, or Other.
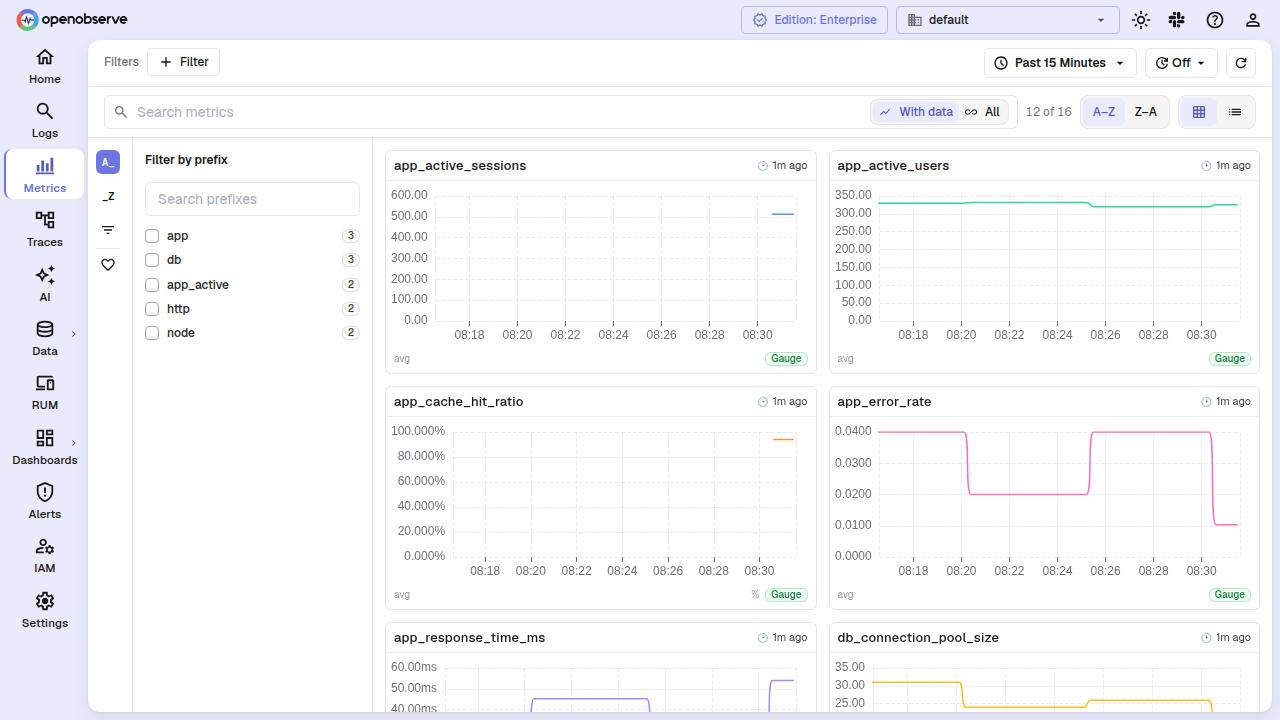
The search bar filters cards by name or help text. The sort toggle switches between A-Z and Z-A ordering. The "With data" toggle (on by default) hides cards whose queries returned no samples, keeping the grid clean of registered-but-unused metrics. A count below the grid shows how many cards are hidden; click the count to show them.
Label filter chips
When the grid has loaded stream schemas (triggered by the first filter interaction), you can add label matchers via the Label chip input. Cards are then narrowed to metrics whose effective streams carry every selected label — so a status=~"5.." chip safely limits the grid to metrics that actually have a status label.
Query editor
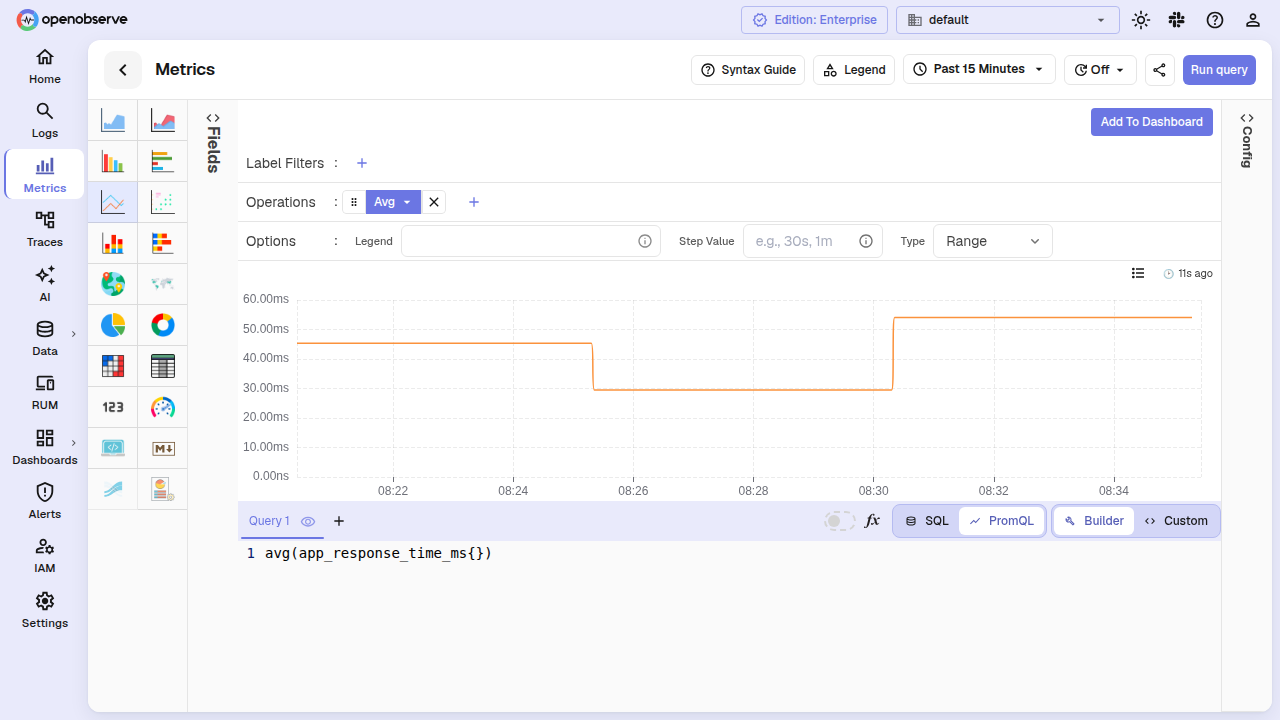
The panel editor at /metrics/editor is where you build queries, visualize results, and configure dashboard panels. It opens with the same layout as a dashboard panel editor.
Stream selector
The stream dropdown shows metric names with type badges — a single letter (C, G, H, S, O) on a color-coded background:
| Badge | Type | Color |
|---|---|---|
| C | Counter | Blue |
| G | Gauge | Green |
| H | Histogram | Purple |
| S | Summary | Orange |
| O | Other | Grey |
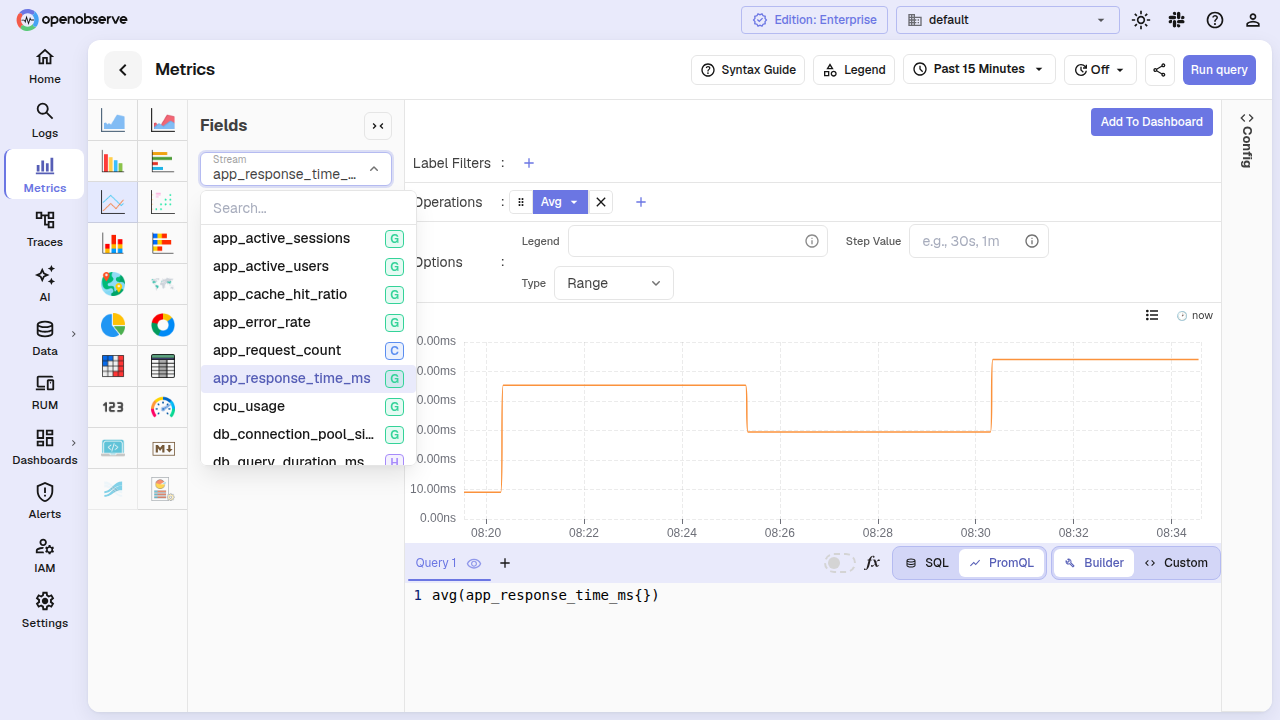
The badge colors match the same palette used in the Metrics Explorer browse grid, so a type looks the same wherever you see it.
Builder mode
The builder lets you construct PromQL queries step by step without writing raw PromQL. Select Builder from the mode toggle.
When you pick a metric, the builder auto-seeds a default query based on its type: sum(rate(counter[4m])) for a counter, avg(gauge) for a gauge, histogram_quantile(...) for a histogram. You can then add or remove operations (rate, sum, avg, topk, etc.) and label filters.
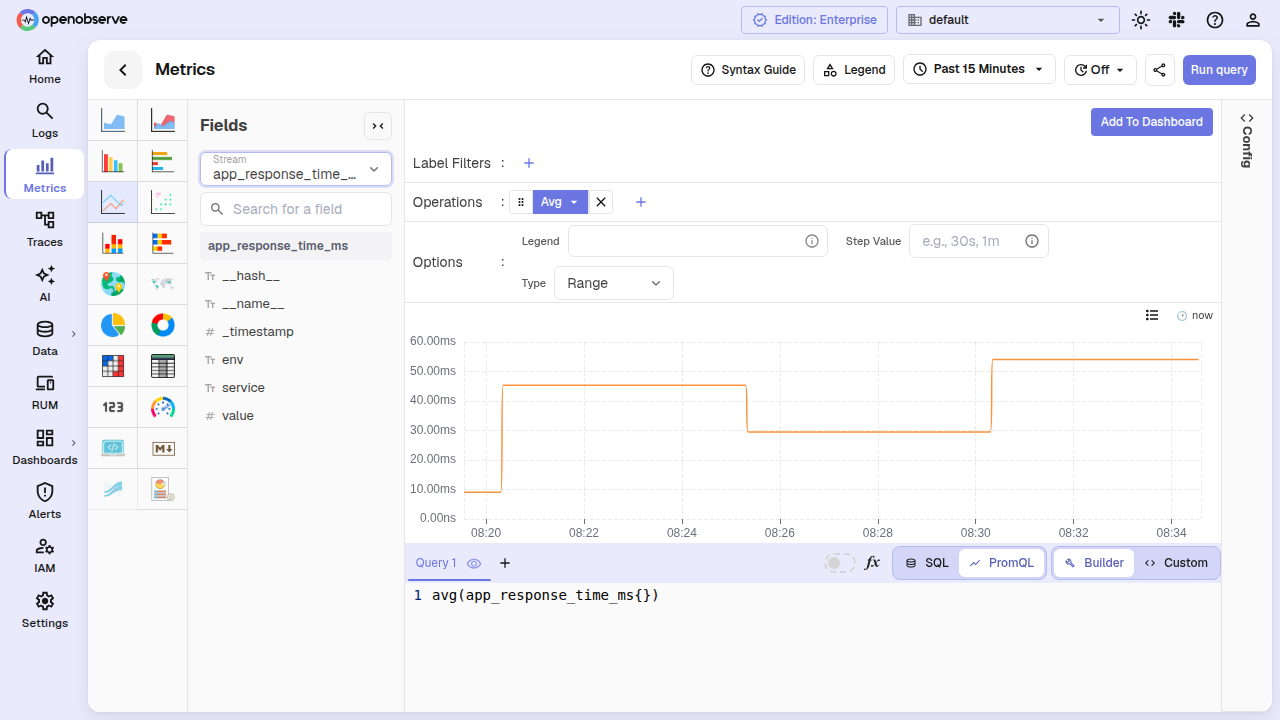
Operations are organized into groups: Rate & range, Aggregation, Math, and more. Each operation is rendered as a draggable chip. Drag to reorder; the query string updates live.
The builder writes the full PromQL into the query input, so you can switch to Code mode at any time to see or edit the raw query.
Code mode
Select Code to write PromQL directly in the editor. The editor provides syntax highlighting, autocompletion for metric names and label keys, and inline error indicators.
Press Ctrl+Enter (or Cmd+Enter on macOS) to run the query from the editor without clicking Apply. The editor flushes any pending input before running, so the query that executes is always what is on screen.
Date and time range
The time picker at the top of the editor supports relative ranges (Past 15 Minutes, Past 6 Hours, etc.) and absolute custom ranges. For dashboards (where auto-apply is off), the picker's trigger label shows the range that is actually in force, not your pending selection — so switching the picker to "Past 6 Hours" without clicking Apply leaves the trigger reading the previous range.
Click Apply to run the query against the selected range. The refresh interval dropdown schedules automatic re-runs.
Visualizations
The editor supports the same chart types available for dashboard panels: line, bar, area, scatter, table, heatmap, and more. Switch the chart type from the dropdown above the chart.
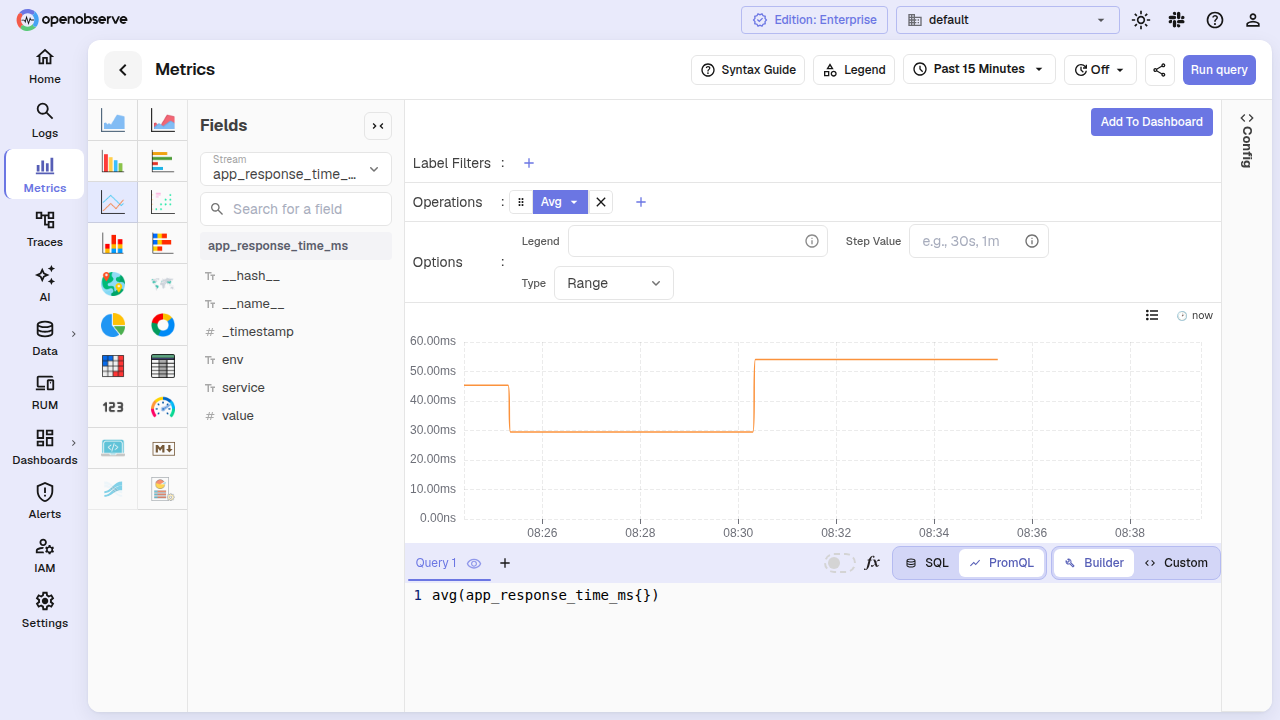
Add to Dashboard
After you have a query and chart you want to keep, click Add to Dashboard. Choose an existing dashboard and tab, or create a new one. The panel is inserted with the current query, chart type, time range, and PromQL builder state preserved.
Sharing a metrics view
The Share button in the editor toolbar copies a URL that encodes your current panel configuration — chart type, query, stream, time range, and refresh interval. Anyone opening the link sees the same chart and data. The share URL carries the full state as a base64 blob in the metrics_data query parameter.
The editor also accepts lightweight deep-link parameters (chart_type, query_type, stream_name, query) for programmatic linking from alerts, dashboards, and other pages.
Choosing a stream type auto-selects PromQL
When you create a new panel and set the stream type to metrics, the query mode automatically switches to PromQL. This saves you one click on exactly the new panels that need it. A panel that already has a written SQL query is never converted — so opening an existing SQL panel for editing keeps its query type intact, and SQL over metrics remains one click away.
Next steps
- Dashboards: add metrics panels to dashboards
- Downsampling: reduce storage for long-term metrics
- Prometheus ingestion: send metrics via remote-write
- Alerts: create alerts on metric thresholds
Last updated on
Metrics Overview
Metrics in OpenObserve store and query time-series data efficiently, with guides covering file access time behavior and downsampling to reduce storage costs.
File Access Time
Analyze file access age in OpenObserve to gauge query performance. Buckets track how recently files were accessed, revealing hot vs. cold data trends.