
Go Profiling
Go has two paths:
| Path | When to use |
|---|---|
| pprof (this page) | CPU, heap, mutex, and block; expose /debug/pprof |
| eBPF profiler | On-CPU by default; optional off-CPU sampling (Linux) |
Expose pprof
Save this as main.go. It burns CPU so the flame graph has samples:
package main

import (
	"crypto/sha256"
	"net/http"
	_ "net/http/pprof"
)

func main() {
	go func() {
		_ = http.ListenAndServe("127.0.0.1:6060", nil)
	}()

	buf := []byte("openobserve")
	for {
		sum := sha256.Sum256(buf)
		buf = sum[:]
	}
}
go mod init pprofdemo
go mod tidy
go run .Scrape with the Collector
Copy the endpoint and Authorization header from Data Sources → Custom → Profiles. Use otelcol-contrib 0.153.0 (remote: scrape config). CPU scrape timeout must be longer than ?seconds= on the pprof URL.
receivers:
  pprof/cpu:
    remote:
      endpoint: http://127.0.0.1:6060/debug/pprof/profile?seconds=5
      collection_interval: 30s
      timeout: 60s

processors:
  resource:
    attributes:
      - key: service.name
        value: your-service
        action: upsert

exporters:
  otlp_http/openobserve:
    profiles_endpoint: http://<your-openobserve-host>/api/<your-org>/v1/profiles
    headers:
      Authorization: Basic <paste-from-Data-Sources>
      stream-name: default

service:
  pipelines:
    profiles:
      receivers: [pprof/cpu]
      processors: [resource]
      exporters: [otlp_http/openobserve]
otelcol-contrib --feature-gates=+service.profilesSupport --config=otelcol-config.yamlHeap, allocs, mutex, and block
For mutex and block, import runtime and call these at process start (CPU and heap work without them):
runtime.SetMutexProfileFraction(1)
runtime.SetBlockProfileRate(1)| Profile | Endpoint |
|---|---|
| CPU | /debug/pprof/profile?seconds=5 |
| Heap | /debug/pprof/heap |
| Allocations | /debug/pprof/allocs |
| Mutex | /debug/pprof/mutex |
| Block | /debug/pprof/block |
Configure a separate pprof/<name> receiver using the corresponding endpoint and add it to the profiles pipeline. Mutex and block profiles need actual contention to contain samples; enabling them alone does not create data.
Verify in OpenObserve
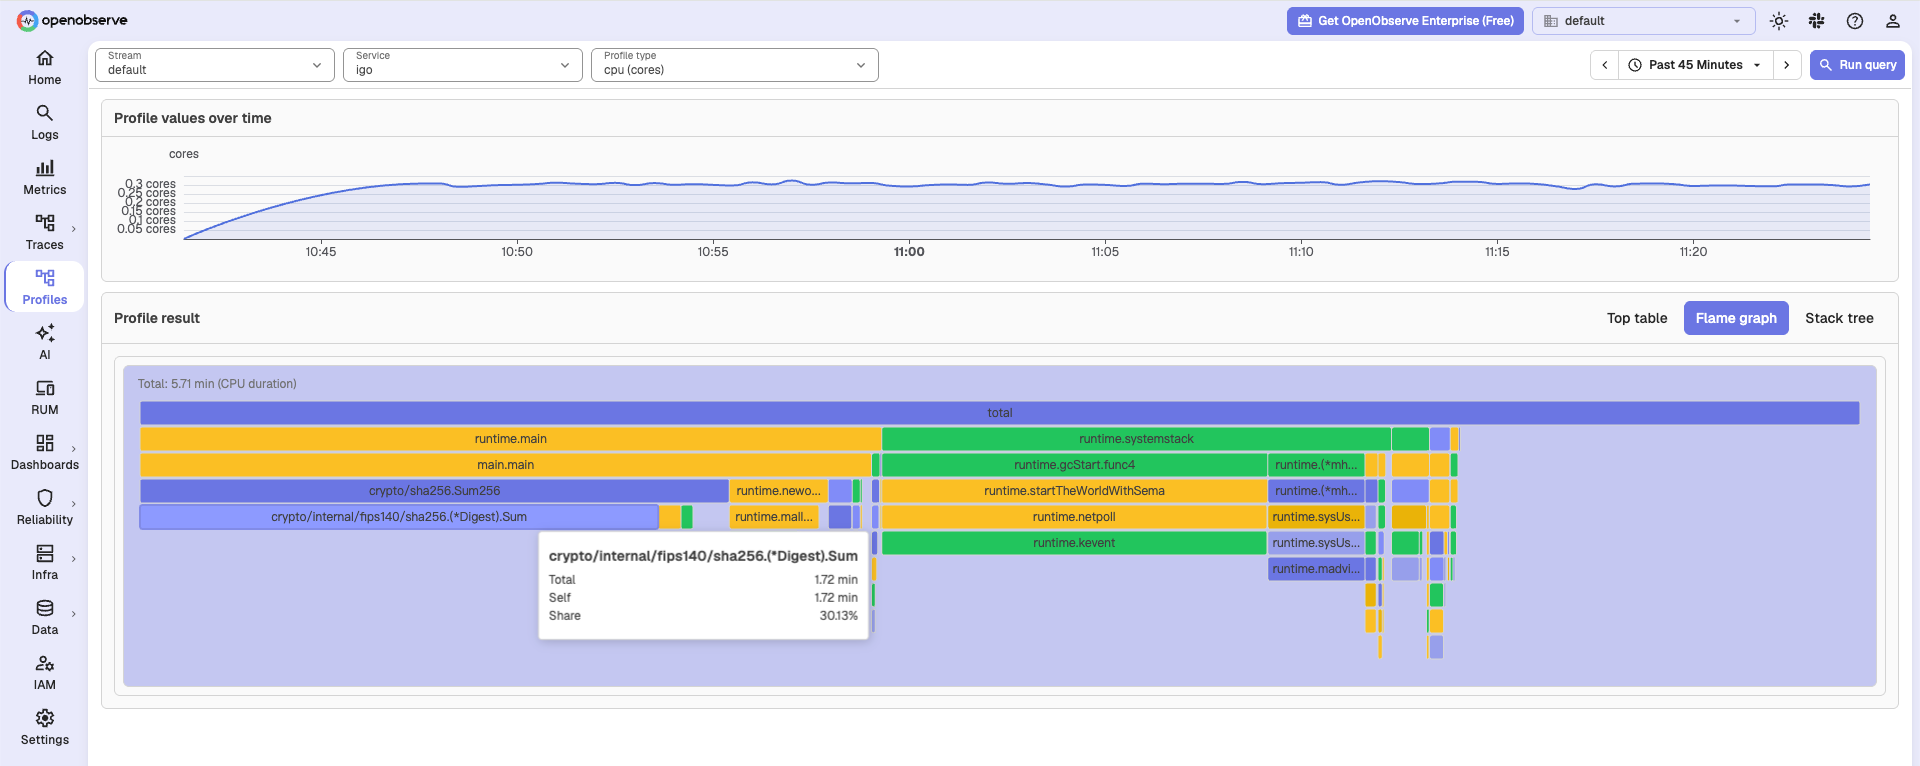
Open Profiles, select the configured stream (default in the example), service, and profile type/unit, then use Last 15 minutes. Check the Collector logs for export failures; see OTLP verification if a dictionary validation error prevents ingestion.
Next steps
- OTLP Profiles: Collector exporter,
Authorization: Basic, andservice.name. - eBPF profiler: zero-code CPU profiling.
- pprof receiver: scrape options.
Need some help?
- Join our Community Slack
- Or Contact support
Last updated on