
Zero-Code CPU Profiling with otelcol-ebpf-profiler
otelcol-ebpf-profiler is the Collector distribution that embeds the eBPF profiler as the profiling receiver. It samples on-CPU stacks on a Linux host and exports OTLP Profiles. No language SDK and no application restart. Do not use otelcol-contrib.
Use it for Java HotSpot, Go, Rust, C/C++, and other supported runtimes. The default tracers: all includes the HotSpot unwinder for Java method and JIT frame names. For JVM-specific allocation and lock events, use async-profiler.
Send profiles
Use otelcol-ebpf-profiler 0.153.0 on Linux kernel 5.10 or newer, with root access to load eBPF programs and attach perf events. Both amd64 and arm64 packages are available. macOS and Windows need a Linux VM; the profiler cannot sample those host kernels.
Copy the endpoint and Authorization header from Data Sources → Custom → Profiles. Save as ebpf-profiler-config.yaml:
receivers:
  profiling:
    samples_per_second: 20
    reporter_interval: 60s
    include_env_vars: OTEL_SERVICE_NAME

processors:
  transform/service:
    profile_statements:
      - context: resource
        statements:
          - set(attributes["service.name"], attributes["process.environment_variable.OTEL_SERVICE_NAME"]) where attributes["process.environment_variable.OTEL_SERVICE_NAME"] != nil

exporters:
  otlp_http/openobserve:
    profiles_endpoint: http://<your-openobserve-host>/api/<your-org>/v1/profiles
    headers:
      Authorization: Basic <paste-from-Data-Sources>
      stream-name: default

service:
  pipelines:
    profiles:
      receivers: [profiling]
      processors: [transform/service]
      exporters: [otlp_http/openobserve]
The receiver exports collected environment variables as process.environment_variable.* attributes. The include_env_vars option and transform above map each process's OTEL_SERVICE_NAME to service.name. Set the variable when launching the application; setting it without this mapping does not name profiles in Collector 0.153.0. Avoid upserting one constant service name for the whole host:
OTEL_SERVICE_NAME=my-app ./your-appLinux host, run as root:
sudo ./otelcol-ebpf-profiler --feature-gates=+service.profilesSupport --config=ebpf-profiler-config.yamlOff-CPU sampling
The configuration above collects on-CPU samples only. To also sample off-CPU waits, add off_cpu_threshold: 0.1 under receivers.profiling. The value is a sampling probability in [0, 1]; 0 disables off-CPU profiling. The exported values are sampled wait durations across threads, rather than the application's wall-clock elapsed time. Select the corresponding emitted profile type in OpenObserve.
Native symbols
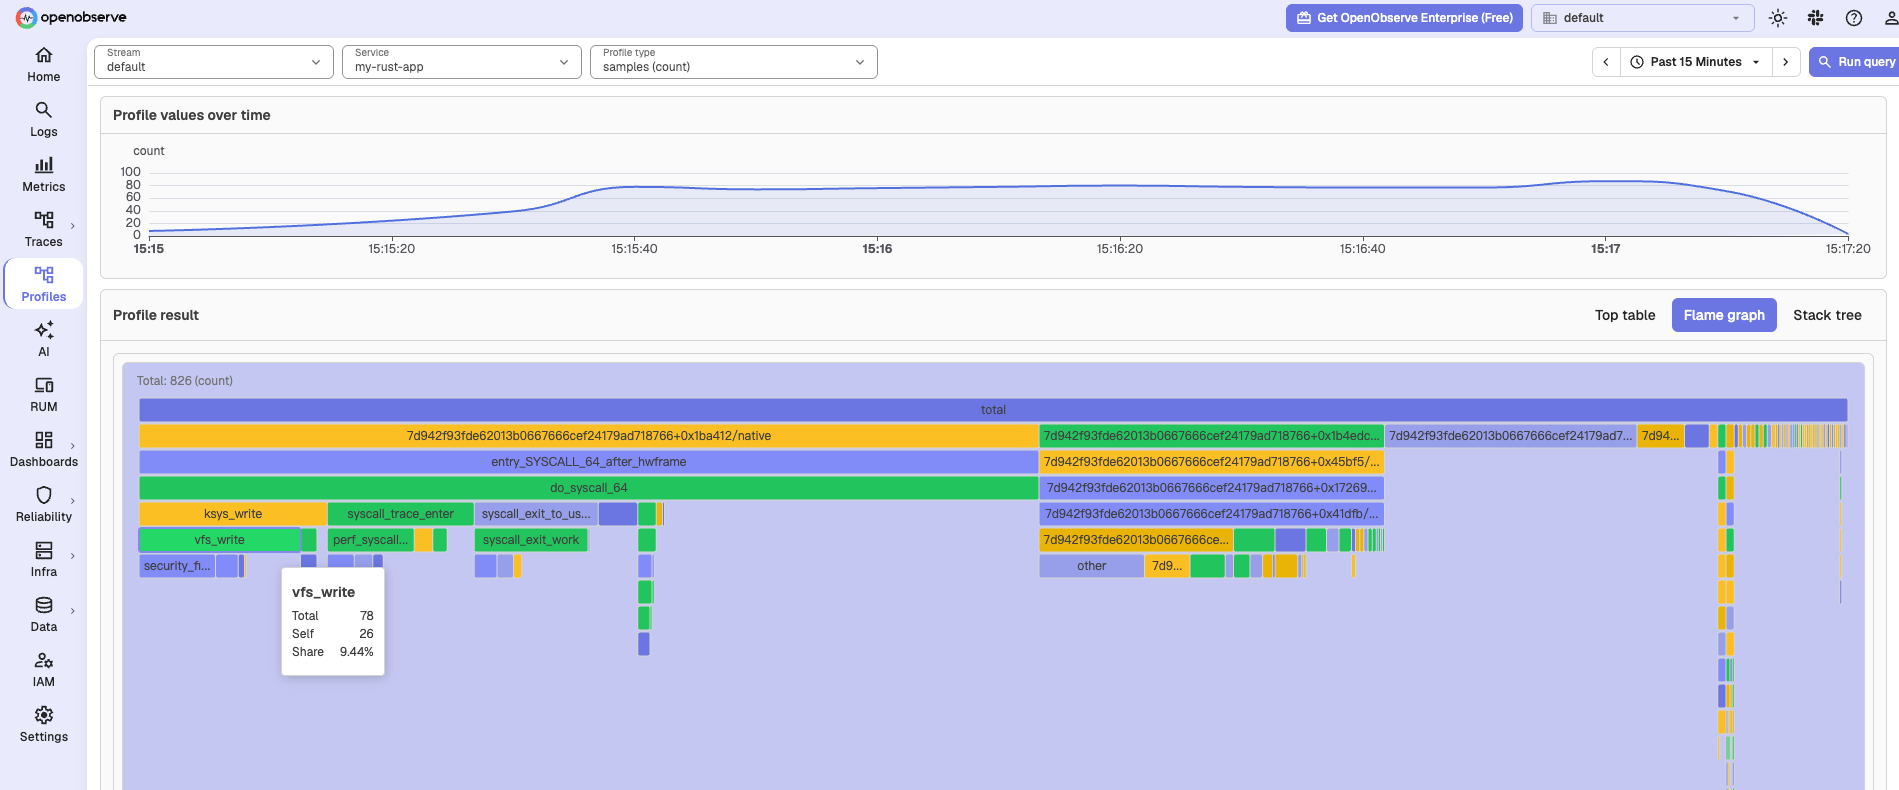
otelcol-ebpf-profiler does not resolve C/C++/Rust symbols on the host. OpenObserve displays the frames it receives. Kernel frames can still show names (vfs_write); userspace stays FileID/native.
The proposal for an on-host symtab tracer was closed without merging. Collector 0.153.0 does not support symtab; do not add it to the receiver's tracers configuration.
For Rust function names with the released integrations, use pprof. Keeping an ELF symbol table alone does not enable on-host symbolization in this Collector version.
Verify in OpenObserve
Wait for at least one reporter_interval (60 seconds above), then open Profiles and select the stream and service. On-CPU profiles from this version use samples / count; enabling off-CPU collection also emits off_cpu / nanoseconds. Check receiver startup and exporter logs; a running Collector alone does not prove that eBPF probes loaded or that OpenObserve accepted profiles.
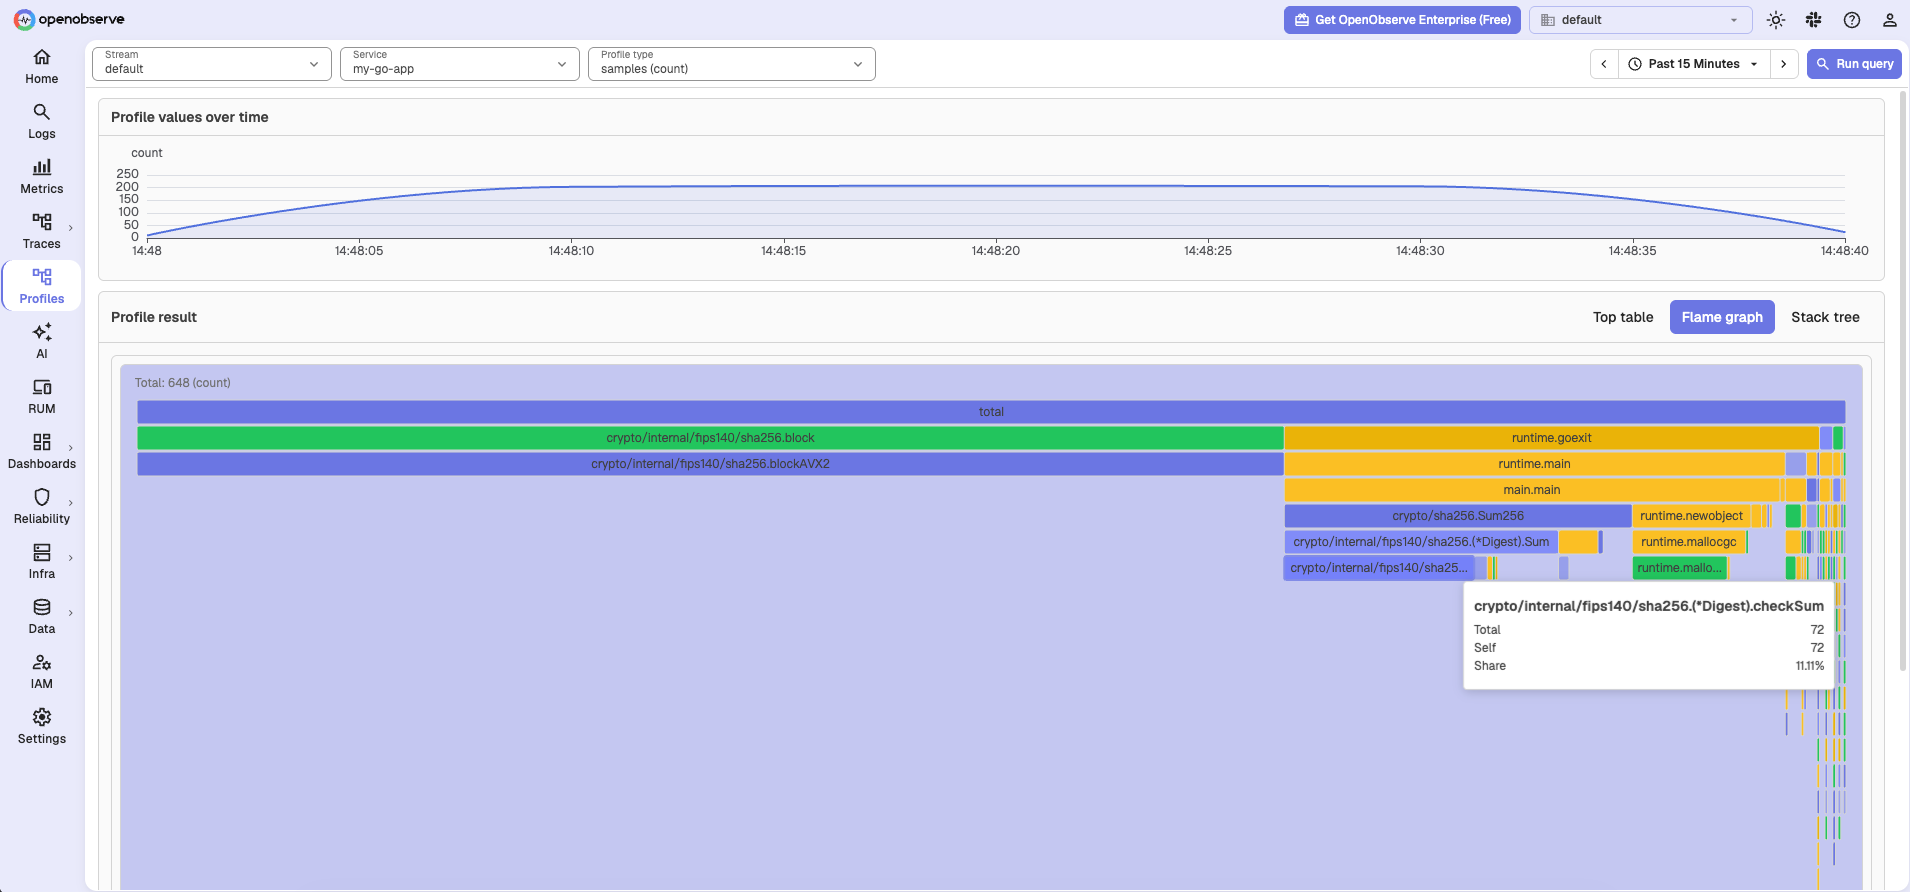
Go demo:
Rust demo:
Next steps
- otelcol-ebpf-profiler releases: Linux
amd64/arm64packages (otelcol-ebpf-profiler_*_linux_*.tar.gz). - OpenTelemetry eBPF Profiler: receiver options.
- opentelemetry-ebpf-profiler#1388: closed on-host symbolization proposal.
Need some help?
- Join our Community Slack
- Or Contact support
Last updated on
Rust
Send Rust CPU profiles to OpenObserve with pprof plus the Collector, or sample on-CPU stacks with the OpenTelemetry eBPF profiler.
Integrations Overview
Integration guides for Kubernetes, AWS, AI and LLM observability, databases, and infrastructure monitoring with OpenObserve logs, metrics, and traces.