
IngestionProfiles
Rust Profiling
Rust has two paths:
| Path | When to use |
|---|---|
| pprof (this page) | Function names in the flame graph |
| eBPF profiler | No code changes (Linux) |
Expose pprof
Create a project with cargo new rsdemo && cd rsdemo. Replace Cargo.toml and src/main.rs with the examples below. The program burns CPU and serves /debug/pprof/profile for the Collector:
# Cargo.toml
[package]
name = "rsdemo"
version = "0.1.0"
edition = "2021"

[dependencies]
pprof = { version = "0.14", features = ["protobuf-codec"] }
sha2 = "0.10"
tiny_http = "0.12"

[profile.release]
debug = 1
strip = falseuse pprof::protos::Message;
use sha2::{Digest, Sha256};
use std::{thread, time::Duration};
use tiny_http::{Response, Server};
fn main() {
thread::spawn(|| {
let server = Server::http("127.0.0.1:6060").unwrap();
for request in server.incoming_requests() {
if !request.url().starts_with("/debug/pprof/profile") {
let _ = request.respond(Response::empty(404));
continue;
}
let guard = pprof::ProfilerGuard::new(99).unwrap();
thread::sleep(Duration::from_secs(5));
let mut body = Vec::new();
if let Ok(report) = guard.report().build() {
if let Ok(profile) = report.pprof() {
body = profile.write_to_bytes().unwrap_or_default();
}
}
let _ = request.respond(Response::from_data(body));
}
});
let mut buf = b"openobserve".to_vec();
loop {
buf = Sha256::digest(&buf).to_vec();
}
}cargo build --release
./target/release/rsdemoScrape with the Collector
Copy the endpoint and Authorization header from Data Sources → Custom → Profiles. Use otelcol-contrib 0.153.0 (remote: scrape config). CPU scrape timeout must be longer than the 5-second profile window.
receivers:
  pprof/cpu:
    remote:
      endpoint: http://127.0.0.1:6060/debug/pprof/profile?seconds=5
      collection_interval: 30s
      timeout: 60s

processors:
  resource:
    attributes:
      - key: service.name
        value: your-service
        action: upsert

exporters:
  otlp_http/openobserve:
    profiles_endpoint: http://<your-openobserve-host>/api/<your-org>/v1/profiles
    headers:
      Authorization: Basic <paste-from-Data-Sources>
      stream-name: default

service:
  pipelines:
    profiles:
      receivers: [pprof/cpu]
      processors: [resource]
      exporters: [otlp_http/openobserve]
otelcol-contrib --feature-gates=+service.profilesSupport --config=otelcol-config.yamlVerify in OpenObserve
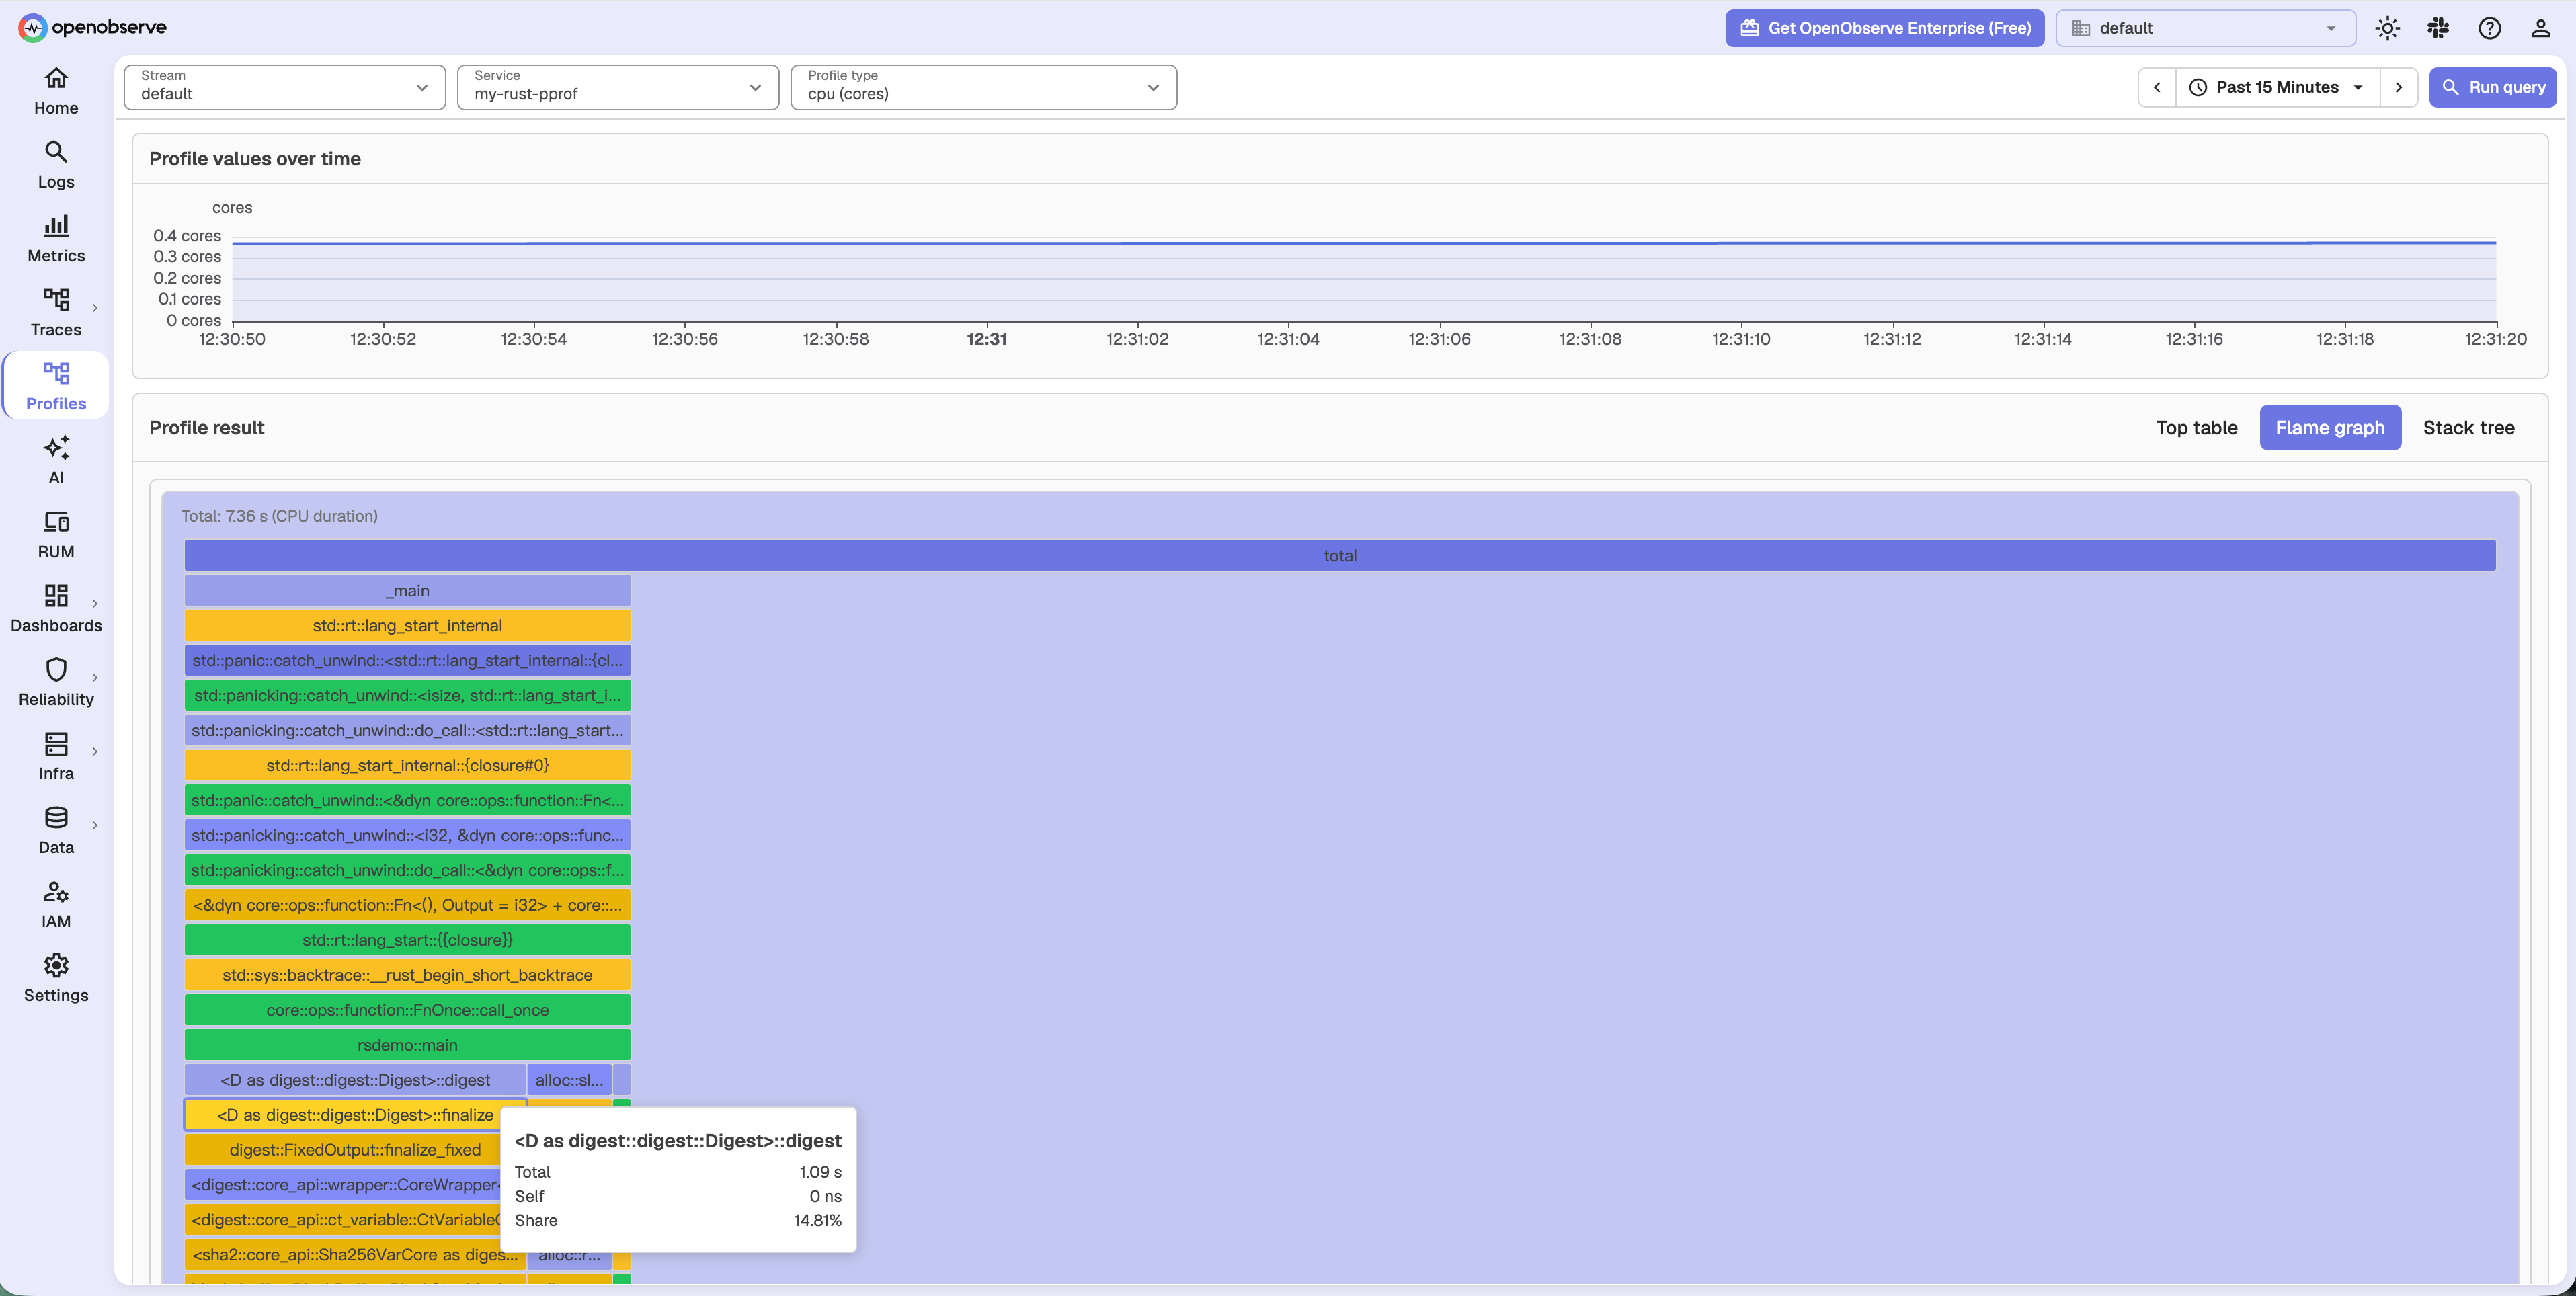
Open Profiles, select the configured stream (default in the example), service, and profile type/unit, then use Last 15 minutes. Check the Collector logs for export failures; see OTLP verification if a dictionary validation error prevents ingestion.
Next steps
- OTLP Profiles: Collector exporter,
Authorization: Basic, andservice.name. - eBPF profiler: zero-code on-CPU sampling.
- pprof-rs: in-process profiler.
- pprof receiver: scrape options.
Need some help?
- Join our Community Slack
- Or Contact support
Was this page helpful?
Last updated on