
Java Profiling
Java has two integration paths:
| Path | What it captures | Requirements |
|---|---|---|
| async-profiler | CPU, allocation, and lock events from the JVM | Attach the profiler or load its JVM agent |
| eBPF profiler | On-CPU stacks and optional off-CPU thread waits | Linux, root access; no JVM agent |
The async-profiler instructions below support JVM-specific allocation and lock events. For zero-agent Linux sampling, see Java with eBPF.
async-profiler 4.5 attaches to a JVM and can export OTLP Profiles (-o otlp).
Experimental OTLP output
Use async-profiler 4.5 with Collector 0.153.0 for the examples below. Version 4.2 emits an older, incompatible OTLP Profiles schema. The format is experimental; re-test both components when upgrading.
Send profiles with async-profiler
Run a Collector with the OTLP Profiles configuration. async-profiler writes -o otlp to a local protobuf file; -f http://... does not POST it and fails with Could not open output file.
Capture a 60-second CPU profile, then upload it to the Collector:
PID=8983
asprof -d 60 -e cpu --total -o otlp -f profile.pb "$PID"
curl --fail-with-body \
  -H 'Content-Type: application/x-protobuf' \
  --data-binary @profile.pb \
  http://127.0.0.1:4318/v1development/profiles
Replace 8983 with the JVM PID. The Collector adds service.name and OpenObserve authorization; the local Collector endpoint above has no authentication. --total exports the event's total value, such as time or allocated bytes, instead of sample counts.
For continuous collection, finish each file before uploading it:
while kill -0 "$PID" 2>/dev/null; do
  asprof -d 60 -e cpu --total -o otlp -f profile.pb "$PID" || break
  curl --fail-with-body \
    -H 'Content-Type: application/x-protobuf' \
    --data-binary @profile.pb \
    http://127.0.0.1:4318/v1development/profiles || break
done
Capture from JVM startup
-agentpath:lib=options is one argument. Use libasyncProfiler.so on Linux or libasyncProfiler.dylib on macOS:
java -agentpath:/path/to/libasyncProfiler.so=start,event=cpu,total,otlp,file=profile.pb \
  -jar app.jar
The file is written when profiling stops or the JVM exits. To upload while the JVM is running, stop and dump with asprof stop -o otlp --total -f profile.pb "$PID", then run the curl command above. This captures one window; use the collection loop for repeated uploads.
Events
| Goal | Flags |
|---|---|
| CPU | -e cpu (default) |
| Allocations | -e alloc |
| Lock contention | -e lock |
See async-profiler profiling modes for wall-clock, native memory, and other events (asprof list).
Do not use --all in production
--all turns on CPU, wall, allocation, lock, and native-memory profiling at the same time. Overhead is high. For continuous profiling, pick one event from the table above.
Verify in OpenObserve
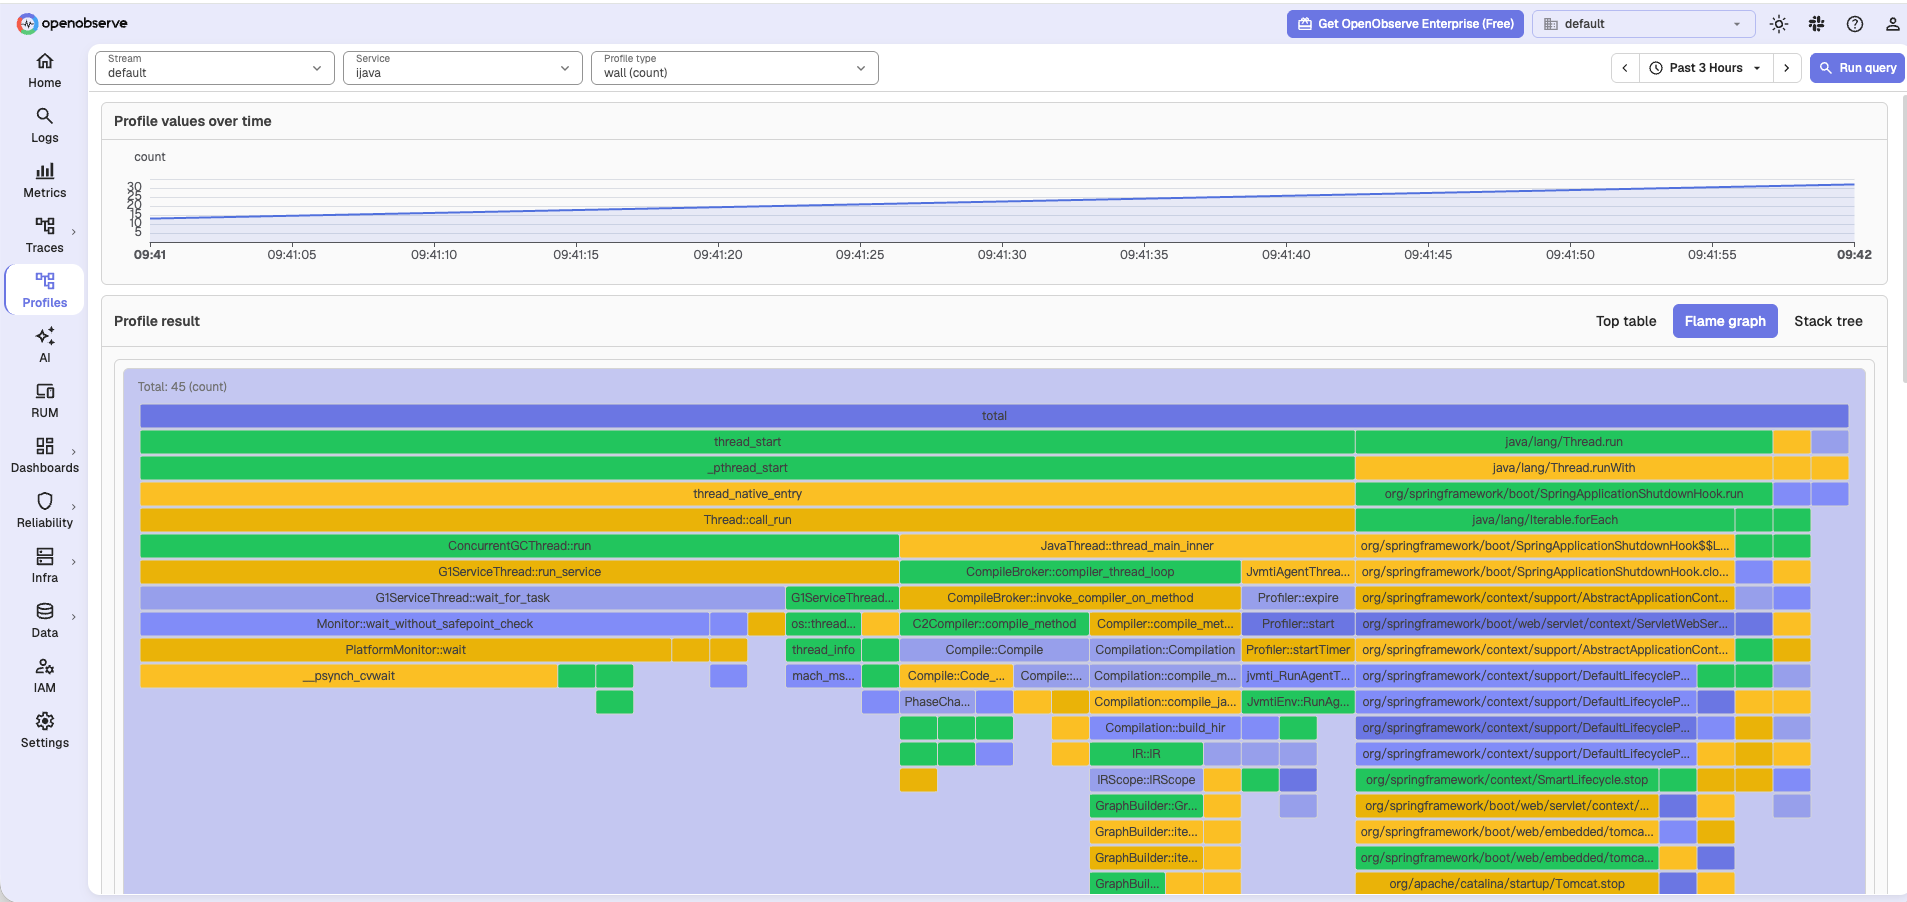
Open Profiles, select the destination stream and service, choose a profile type and unit, and use a time range covering the capture. Event labels are supplied by the profiler; on macOS, cpu sampling can appear as wall. Check the Collector logs for export errors even when its receiver returns HTTP 200.
Java with eBPF
Use the eBPF profiler configuration with otelcol-ebpf-profiler 0.153.0. Its default tracers: all includes the HotSpot unwinder, which resolves Java method names and JIT frames. A running JVM can be sampled without attaching async-profiler or restarting it. Java method frames can appear alongside JVM/libc native frames represented by binary identifiers and offsets.
To assign a service name when launching the application:
OTEL_SERVICE_NAME=your-java-service java -jar app.jarKeep include_env_vars: OTEL_SERVICE_NAME and the per-process service-name transform from the eBPF configuration. For a JVM already running without this variable, use the process_pid tag filter in OpenObserve to select it.
Select samples / count for on-CPU profiles. Enable off_cpu_threshold: 0.1 and select off_cpu / nanoseconds for sampled off-CPU waits. These are OS-thread wait durations: JVM runtime threads, sleeps, and blocked monitors can appear in the stacks. Use async-profiler's allocation or lock mode when you need those specific JVM events.
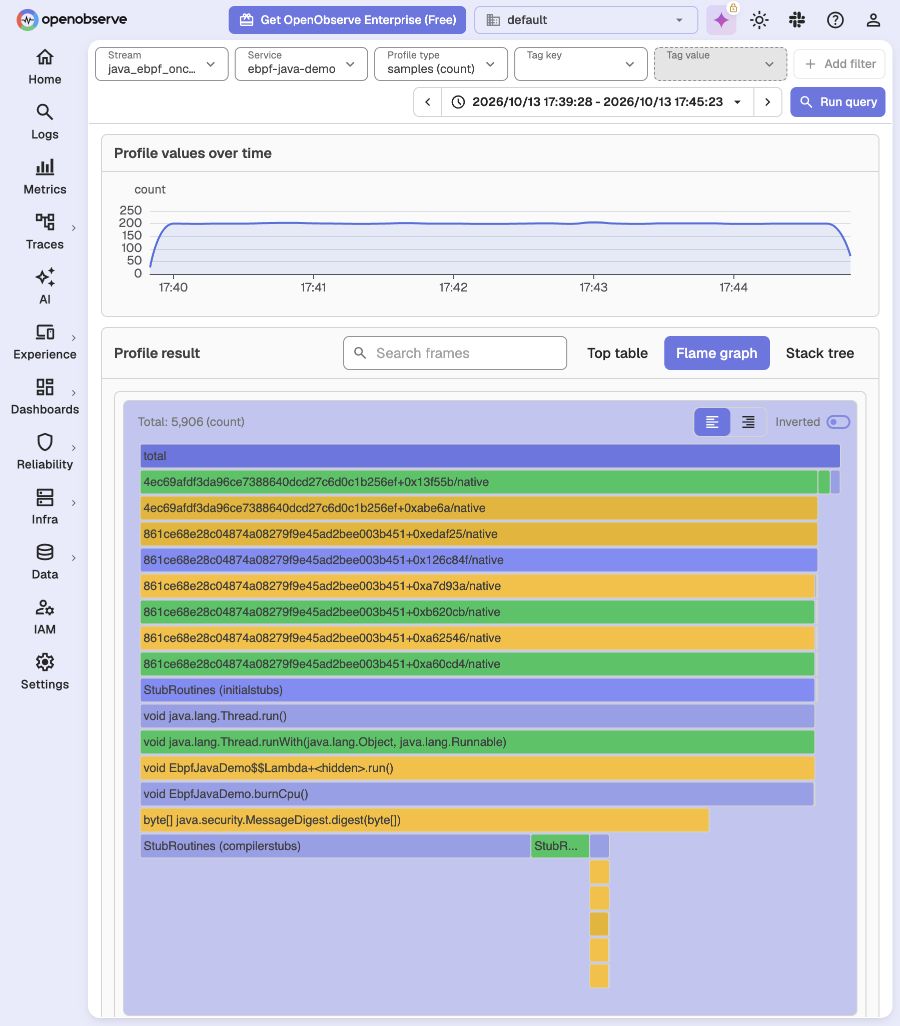
This path was tested on OpenJDK HotSpot 25.0.4.1, x86_64 Ubuntu 26.04, kernel 7.0.0-1006-aws. Check the profiler logs and re-test when changing JDK or Collector versions; other JVM implementations are not covered by this test.
Next steps
- OTLP Profiles: Collector exporter,
Authorization: Basic, andservice.name. - eBPF profiler: whole-host Java on-CPU and off-CPU sampling.
- async-profiler profiling modes
Need some help?
- Join our Community Slack
- Or Contact support
Last updated on